Operational Performance: Transit
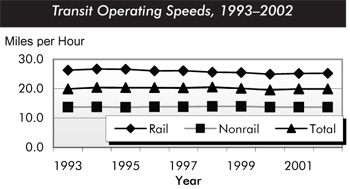
Average operating speed in 2002 was higher than in 2000, but below its 10-year average. Average vehicle utilization levels were lower in 2002 than in 2000, but the utilization of rail vehicle modes remained high in 2002 relative to the 10-year averages. Buses had the smallest decline in vehicle utilization from 2000 to 2002.
Average operating speed is the average speed that a passenger will travel on transit rather than the pure operational speed of transit vehicles. In 2002, the average operating speed for all transit modes was 19.9 miles per hour, up from 19.6 in 2000, but below the 10-year average of 20.1. The average speed for rail was 25.3 miles per hour in 2002, up from 24.9 in 2000, most likely due to a decline in vehicle utilization and shorter vehicle dwell times. The average speed of nonrail modes was 13.7 miles per hour in both 2000 and 2002.
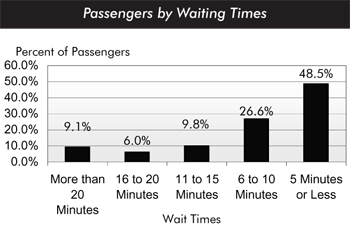
Most passengers who ride transit wait in areas that have frequent service. The 2001 National Household Travel Survey found that 49 percent of all passengers who ride transit wait for 5 minutes or less for a vehicle to arrive, and 75 percent wait 10 minutes or less. Nine percent of passengers wait for more than 20 minutes. To some extent, waiting times are correlated with incomes. Passengers with annual incomes above $65,000 are more likely to wait less time for a transit vehicle than passengers with incomes lower than $30,000. Higher-income passengers are more likely to be choice riders; passengers with lower incomes are more likely to use transit for basic mobility and to have more limited alternative means of travel.
Vehicle utilization is measured as passenger miles per vehicle adjusted to reflect differences in the passenger-carrying capacities of transit vehicles. Capacity-adjusted vehicle utilization levels in this edition of the report are based on revised capacity-equivalent factors, and, with the exception of buses, are not comparable to utilization levels reported in earlier editions. The revisions to capacity-equivalent factors did not affect year-to-year changes in utilization rates. On average, rail vehicles operate at a higher level of utilization than nonrail vehicles. Commuter rail has consistently had the highest vehicle utilization rate, and demand response the lowest.
| Mode | Utilization | |
|---|---|---|
| 2000 | 2002 | |
| Heavy Rail | 697 | 675 |
| Commuter Rail | 863 | 831 |
| Light Rail | 546 | 528 |
| Vanpool | 577 | 539 |
| Bus | 393 | 390 |
| Ferryboat | 305 | 294 |
| Trolleybus | 257 | 246 |
| Demand Response | 188 | 178 |