U.S. Department of Transportation
Federal Highway Administration
1200 New Jersey Avenue, SE
Washington, DC 20590
202-366-4000
Federal Highway Administration Research and Technology
Coordinating, Developing, and Delivering Highway Transportation Innovations
 |
| This report is an archived publication and may contain dated technical, contact, and link information |
|
Publication Number: FHWA-HRT-04-046 Date: October 2004 |
Previous | Table of Contents | Next
In chapter 5, candidate quality measures were investigated with respect to their accuracy and precision when estimating the true population parameters. The candidate quality measures that were analyzed were PWL (or its complement, PD), AAD, and CI.
From the simulation analyses summarized in chapter 5, both the sample PWL and the sample AAD were unbiased estimators of the corresponding population values. They both showed decreasing variability in the estimated values as the sample size increased. For PWL, the variability values peaked at a population PWL of 50 and then decreased as the population PWL approached either 100 or 0. The AAD variability values were lowest when the population mean was centered at the target and they increased as the offset from the target of the population mean increased, leveling off as the offset approached 3 standard deviations.
The simulation analyses for CI showed similar variability relationships as were found for AAD. However, the CI appeared to be a slightly biased estimator of the population CI since all of the simulated average CI sample values were negative.
Since there appears to be no appreciable benefit to using CI rather than AAD (i.e., they have similar variability traits, but AAD is unbiased while the CI is slightly biased), the CI was eliminated from further analyses. This chapter presents the results of the further analyses that were conducted on PWL and AAD.
The quality measure that is selected needs to be capable of being used to determine the payment factor. Therefore, it must be easy to develop an equation that relates the quality measure to the anticipated performance of the pavement. For the analyses to be conducted at this point, it was sufficient to accept the fact that the quality of the material in the population would increase as either its PWL value increased or its AAD value decreased. The relationship of payment to projected performance is discussed in a later chapter.
For each quality measure, it was necessary to determine whether or not it could provide an unbiased estimate for the payment factor for a given population. The amount of variability in the payment factor estimates for individual lots also required study. These results were both generated by computer simulation studies.
Since it is rare that only a single quality characteristic is used to determine the payment factor for a lot, it was necessary to consider how the quality measures performed when multiple acceptance characteristics were used and to consider methods for combining these individual estimated quality measures into a combined (or composite) payment factor. While it was not within the scope of the original project, it was decided that, if multiple quality characteristics were to be investigated, it would be necessary to consider potential correlations among these characteristics.
Finally, it was necessary to investigate the risks associated with the quality measures and how they would be used for acceptance decisions. The concept of risks for acceptance is similar to that discussed in chapter 7 for verification testing. If pass and fail are the only options, the acceptance decision is simply a form of hypothesis testing and the concept is fairly straightforward. When acceptance at payments other than 100 percent is possible (either incentives or disincentives), the evaluation of the risks becomes much more complicated and not nearly as clear-cut as for pass or fail decisions. The analysis of the payment risks associated with PWL and AAD quality measures was conducted for single quality characteristics and for two quality characteristics that were either independent or correlated.
In chapter 5, it was determined that both PWL and AAD were unbiased estimators for the true population values. As such, they should also provide unbiased payment factor estimates when used in a payment equation. Computer simulation studies were conducted to verify that this was true.
Computer simulation was used to generate expected payment (EP) curves for a payment equation that based payment on the estimated PWL value. Since PWL is an unbiased estimator of the actual PWL value, the EP curve should follow the payment equation exactly. This will be true provided that an appropriate incentive provision is included in the specification. This is discussed at length in a later section on evaluating risks.
For the purposes of the simulation, any payment equation could have been used. For the simulation studies, the payment equation from the AASHTO Quality Assurance Guide Specification was used.(3) This payment equation is:
Pay = 55 + (0.5 X PWL) (18)
This equation was used with sample sizes = 3, 5, and 10. Figures 54 and 55 show the results of the analyses. The plots in figure 54 show the EP curves and the limits within which 95 percent of the estimated payment values fell. As expected, the EP (i.e., the average payment in the long run) follows the same line as the payment equation (equation 18). However, there is considerable variability in the payment values for individual lots. This variability (or spread about the EP line) decreases as the sample size increases from 3 to 10. This was also expected since it follows exactly what was found when PWL values were simulated and since it is the PWL values that determine the payment factor.
To further illustrate the distribution of individual lot payment factors, figure 55 presents histograms of both the individual PWL and the payment factors for populations with an actual PWL = 90 and 50, for sample sizes = 3, 5, and 10.
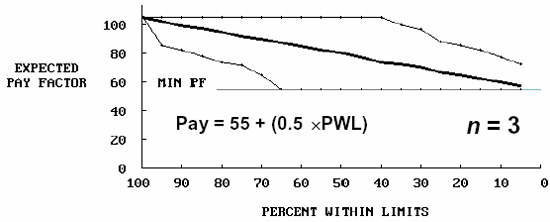
Figure 54a. EP curves for PWL payment schedule with sample size = 3.
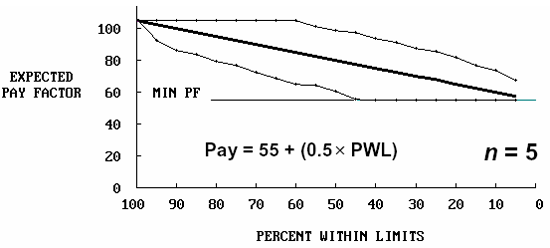
Figure 54b. EP curves for PWL payment schedule with sample size = 5.
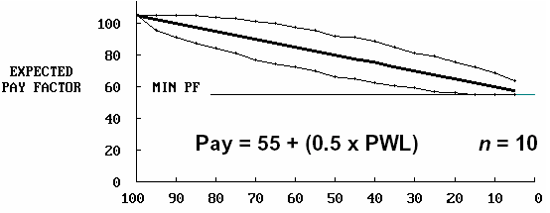
Figure 54c. EP curves for PWL payment schedule with sample size = 10.
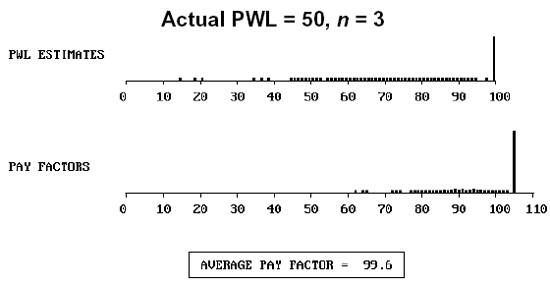
Figure 55a. Distribution of actual PWL = 90, sample size = 3, and the resulting payment factors.
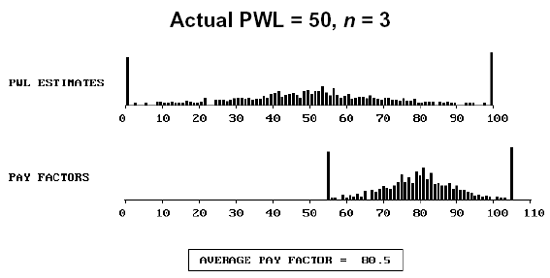
Figure 55b. Distribution of actual PWL = 50, sample size = 3, and the resulting payment factors.
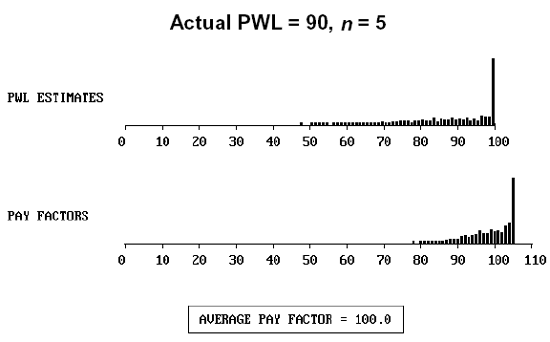
Figure 55c. Distribution of actual PWL = 90, sample size = 5, and the resulting payment factors.
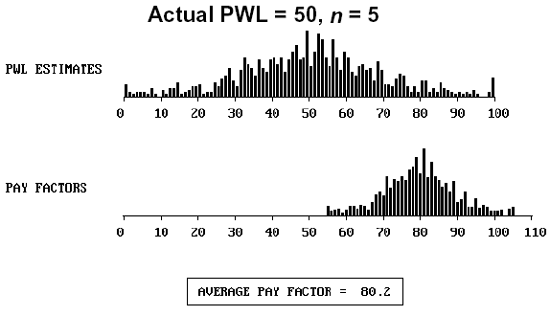
Figure 55d. Distribution of actual PWL = 50, sample size = 5, and the resulting payment factors.
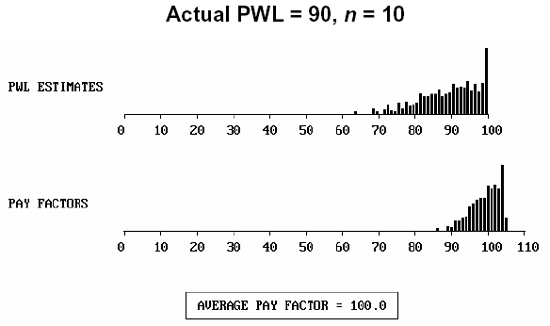
Figure 55e. Distribution of actual PWL = 90, sample size = 10, and the resulting payment factors.
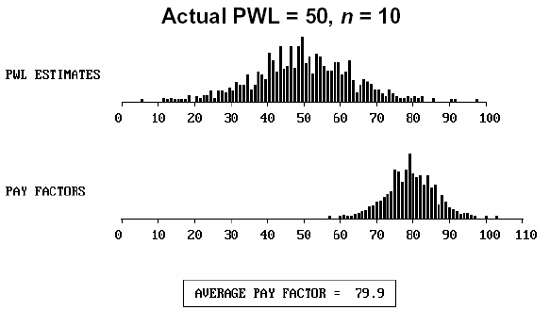
Figure 55f. Distribution of actual PWL = 50, sample size = 10, and the resulting payment factors.
Computer simulation was also used to generate EP curves for a payment equation that based payment on the estimated AAD value. Since AAD is an unbiased estimator of the actual AAD value, the EP curve should follow the payment equation exactly. For the purposes of the simulation, any payment equation could have been used.
Since it is known that the expected value for the distribution of absolute deviations for a normal distribution is 0.798s, a logical equation for relating AAD to payment is:
Pay = 105 - 24.75(AAD - 0.798), and Pay ≤ 105% (19)
This equation provides a maximum payment of 105 percent for an AAD = 0.798s (i.e., the value for a normal distribution centered on the target). This payment equation was used in the comparison analysis. It should be noted that this equation was not intended to provide exactly the same EP curve as the PWL payment equation.
Figure 56 shows an EP curve for a sample size = 5, using equation 19 to determine the payment factor. It is shown in the figure that the EP curve follows a straight line. This is true because the payment equation is a straight line and AAD is an unbiased estimator. Also, the same trends of increasing variability about the EP line with a smaller sample size and decreased variability with a larger sample size would hold true for AAD.
Table 38 shows the EP values from the plot in figure 56 and the payment factor that should have been received for a population with the AAD value shown. The final column shows the difference between the EP and the correct payment. For lower AAD populations (i.e., those with higher quality), the EPs are lower than called for in the payment equation (equation 19). As the AAD value increases, the EP values come in line with the correct values. This issue may be related to the selection of the payment equation rather than the AAD estimation process. This issue is discussed in the section on risks.
Although at first PWL and AAD seem very different, they are both based on the assumption that the population being sampled is normal. All normal distributions can be related to the standard normal distribution (i.e., μ = 0.0 and σ = 1.0) by transforming the measurement axis to standard deviation units by the relationship:
 (20)
(20)
where: Z = number of standard deviation units from the population mean
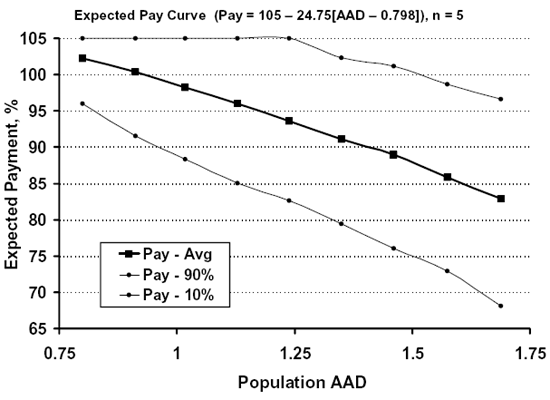
Figure 56. EP curve with the 90th and 10th payment percentiles for the AAD payment schedule.
Table 38. Simulated EP factors and correct payment factors based on AAD.
| Actual AAD | Expected Payment | Correct Payment | Difference |
|---|---|---|---|
| 0.798 | 102.24 | 105.00 | -2.76 |
| 0.912 | 100.40 | 102.18 | -1.78 |
| 1.018 | 98.21 | 99.55 | -1.34 |
| 1.128 | 95.96 | 96.83 | -0.87 |
| 1.238 | 93.60 | 94.11 | -0.51 |
| 1.349 | 91.06 | 91.36 | -0.30 |
| 1.461 | 88.93 | 88.59 | +0.34 |
| 1.574 | 85.89 | 85.79 | +0.10 |
| 1.688 | 82.90 | 82.97 | -0.07 |
A similar approach can be taken for AAD. If AAD is measured in standard deviation units, then AAD can be related to the number of standard deviation units that the population mean is offset from the target value. This works for any normal distribution as long as AAD is measured in standard deviation units. In this way, AAD computer simulation results can be applied to any normal distribution in much the same manner that the standard normal curve can be used to calculate areas under any normal distribution. Figure 57 illustrates how this concept works. ZTarg represents the distance that the population mean (μ) is offset from the target value (T) when measured in units of standard deviation (σ).
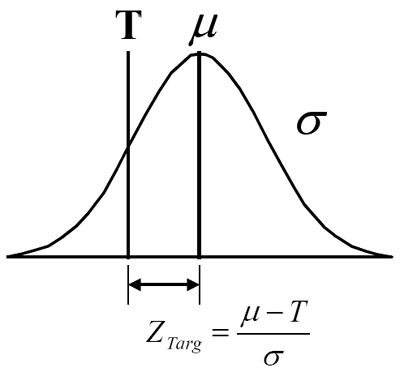
Figure 57. Illustration of measuring AAD in standard deviation units (ZTarg) from the mean.
If we also measure the specification limits to be used in calculating PWL in terms of standard deviation units from the target value, then once the PWL specification limits are set, we can develop a relationship between any given PWL value and its equivalent AAD value for the same normal population.
In the simulation studies that were conducted to compare PWL results with AAD results for the same normal population, the PWL specification limits were set at ±1.645 σ from the target value, which corresponds to 90 PWL for a population centered on the target. Since it is now possible to determine AAD and PWL values for the same offset from the target (ZTarg), an empirical relationship can be developed that for any normal population can convert any given PWL value to its corresponding AAD value, and vice versa. Equations 21 and 22 show this approximate empirical relationship in which all the terms have already been defined:
![]() (21)
(21)
![]() (22)
(22)
First, it should be noted that it is known that AAD = 0.7979σ if the population mean is centered at the target value. Therefore, since the AAD value for a population is approximately 0.798 times the population standard deviation, the only way that the AAD value could be zero is if the standard deviation was zero. Also, the smallest population AAD value is 0.798 times the population standard deviation. Therefore, if the population AAD value is measured in standard deviation units, then 0.798 is the smallest population AAD that is possible, thus, AAD ≥ 0.798 is a requirement.
Equations 21 and 22 allow the corresponding PWL value to be obtained for a given AAD value, and vice versa. For example, for a population with an AAD of 1.00, the offset of the population mean from the target value (ZTarg), measured in standard deviation units, can be calculated as 0.7403 by using equation 22. Since the specification limits are assumed to be set at ±1.645 σ, PWL can be determined from tables of areas under the standard normal curve using figure 58.
Tables 39 through 41 show the relationships between ZTarg, measured in standard deviation units, and the AAD and PWL values for a normal population, provided that the PWL specification limits are two-sided and are set at ±1.645 σ. The two-side specification limits are a requirement since AAD is always two-sided because it is measured as the deviation from a target value. With these tables, it is easy to identify the appropriate PWL and AAD values for a given normal population, provided that the specification limits are set at ±1.645 σ.
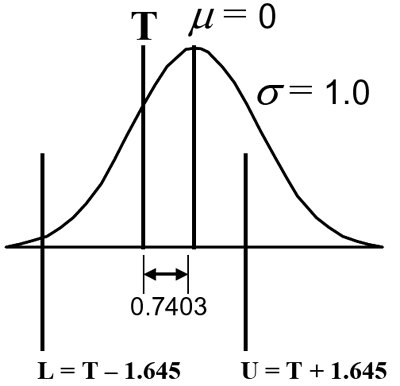
Figure 58. Example illustrating the PWL specification limits and
the offset in s units between the
population mean and the target.
Table 39. Relationship between ZTarg, AAD, and PWL for a normal population when the PWL specification limits are set at 1.645σ.
| ZTarg | PWL (Lower) | PWL (Upper) | PWL (Total) | AAD |
|---|---|---|---|---|
| 0.00 | 95.00 | 95.00 | 90.00 | 0.798 |
| 0.10 | 95.95 | 93.88 | 89.83 | 0.820 |
| 0.20 | 96.75 | 92.58 | 89.33 | 0.831 |
| 0.30 | 97.41 | 91.07 | 88.48 | 0.845 |
| 0.40 | 97.96 | 89.34 | 87.30 | 0.866 |
| 0.50 | 98.40 | 87.39 | 85.79 | 0.895 |
| 0.60 | 98.76 | 85.20 | 83.96 | 0.933 |
| 0.70 | 99.05 | 82.77 | 81.82 | 0.979 |
| 0.80 | 99.28 | 80.09 | 79.37 | 1.032 |
| 0.90 | 99.45 | 77.19 | 76.64 | 1.093 |
| 1.00 | 99.59 | 74.05 | 73.65 | 1.159 |
| 1.10 | 99.70 | 70.71 | 70.41 | 1.231 |
| 1.20 | 99.78 | 67.18 | 66.96 | 1.307 |
| 1.30 | 99.84 | 63.50 | 63.33 | 1.388 |
| 1.40 | 99.88 | 59.68 | 59.56 | 1.471 |
| 1.50 | 99.92 | 55.76 | 55.68 | 1.558 |
| 1.60 | 99.94 | 51.79 | 51.74 | 1.647 |
| 1.70 | 99.96 | 47.81 | 47.77 | 1.738 |
| 1.80 | 99.97 | 43.84 | 43.81 | 1.831 |
| 1.90 | 99.98 | 39.94 | 39.92 | 1.925 |
| 2.00 | 99.99 | 36.13 | 36.12 | 2.020 |
| 2.10 | 99.99 | 32.46 | 32.45 | 2.116 |
| 2.20 | 99.99 | 28.94 | 28.94 | 2.213 |
| 2.30 | 100.00 | 25.62 | 25.62 | 2.310 |
| 2.40 | 100.00 | 22.51 | 22.51 | 2.408 |
| 2.50 | 100.00 | 19.63 | 19.63 | 2.506 |
| 2.60 | 100.00 | 16.98 | 16.98 | 2.605 |
| 2.70 | 100.00 | 14.57 | 14.57 | 2.704 |
| 2.80 | 100.00 | 12.40 | 12.40 | 2.803 |
| 2.90 | 100.00 | 10.47 | 10.47 | 2.902 |
| 3.00 | 100.00 | 8.77 | 8.77 | 3.002 |
| 3.10 | 100.00 | 7.28 | 7.28 | 3.102 |
| 3.20 | 100.00 | 6.00 | 6.00 | 3.201 |
| 3.30 | 100.00 | 4.90 | 4.90 | 3.301 |
| 3.40 | 100.00 | 3.96 | 3.96 | 3.401 |
| 3.50 | 100.00 | 3.18 | 3.18 | 3.501 |
Table 40. Relationship between AAD, ZTarg, and PWL for a normal population when the PWL specification limits are set at 1.645σ.
| AAD | ZTarg | PWL (Lower) | PWL (Upper) | PWL (Total) |
|---|---|---|---|---|
| 0.798 | 0.0000 | 95.00 | 95.00 | 90.00 |
| 0.800 | 0.0476 | 95.47 | 94.49 | 89.96 |
| 0.850 | 0.3521 | 97.71 | 90.20 | 87.91 |
| 0.900 | 0.5137 | 98.46 | 87.10 | 85.56 |
| 0.950 | 0.6371 | 98.88 | 84.33 | 83.20 |
| 1.000 | 0.7403 | 99.15 | 81.72 | 80.86 |
| 1.100 | 0.9131 | 99.47 | 76.79 | 76.26 |
| 1.200 | 1.0603 | 99.66 | 72.06 | 71.72 |
| 1.300 | 1.1929 | 99.77 | 67.44 | 67.21 |
| 1.400 | 1.3164 | 99.85 | 62.88 | 62.72 |
| 1.500 | 1.4337 | 99.90 | 58.37 | 58.26 |
| 1.600 | 1.5469 | 99.93 | 53.91 | 53.84 |
| 1.700 | 1.6570 | 99.95 | 49.52 | 49.47 |
| 1.800 | 1.7649 | 99.97 | 45.23 | 45.20 |
| 1.900 | 1.8711 | 99.98 | 41.05 | 41.03 |
| 2.000 | 1.9761 | 99.99 | 37.03 | 37.01 |
| 2.250 | 2.2348 | 99.99 | 27.77 | 27.76 |
| 2.500 | 2.4900 | 100.00 | 19.90 | 19.90 |
| 2.750 | 2.7433 | 100.00 | 13.60 | 13.60 |
| 3.000 | 2.9954 | 100.00 | 8.84 | 8.84 |
| 3.250 | 3.2468 | 100.00 | 5.46 | 5.46 |
| 3.500 | 3.4978 | 100.00 | 3.20 | 3.20 |
| 3.750 | 3.7484 | 100.00 | 1.77 | 1.77 |
| 4.000 | 3.9989 | 100.00 | 0.93 | 0.93 |
| 4.250 | 4.2492 | 100.00 | 0.46 | 0.46 |
| 4.500 | 4.4994 | 100.00 | 0.22 | 0.22 |
Table 41. Relationship between PWL, AAD, and ZTarg for a normal population when the PWL specification limits are set at 1.645σ.
| PWL (Total) | AAD | ZTarg | PWL (Lower) | PWL (Upper) |
|---|---|---|---|---|
| 90.00 | 0.7980 | 0.0000 | 95.00 | 95.00 |
| 85.00 | 0.9119 | 0.5456 | 98.58 | 86.42 |
| 80.00 | 1.0186 | 0.7753 | 99.22 | 80.78 |
| 75.00 | 1.1277 | 0.9558 | 99.54 | 75.46 |
| 70.00 | 1.2380 | 1.1121 | 99.71 | 70.30 |
| 65.00 | 1.3492 | 1.2546 | 99.81 | 65.19 |
| 60.00 | 1.4610 | 1.3886 | 99.88 | 60.12 |
| 55.00 | 1.5737 | 1.5175 | 99.92 | 55.07 |
| 50.00 | 1.6878 | 1.6437 | 99.95 | 50.05 |
| 45.00 | 1.8047 | 1.7699 | 99.97 | 45.03 |
| 40.00 | 1.9253 | 1.8978 | 99.98 | 40.02 |
| 35.00 | 2.0518 | 2.0301 | 99.99 | 35.01 |
| 30.00 | 2.1863 | 2.1693 | 99.99 | 30.00 |
| 25.00 | 2.3326 | 2.3194 | 100.00 | 25.00 |
| 20.00 | 2.4967 | 2.4867 | 100.00 | 20.00 |
| 15.00 | 2.6889 | 2.6816 | 100.00 | 15.00 |
| 10.00 | 2.9314 | 2.9264 | 100.00 | 10.00 |
| 5.00 | 3.2930 | 3.2900 | 100.00 | 5.00 |
| 1.00 | 3.9740 | 3.9728 | 100.00 | 1.00 |
Using the information from tables 39 through 41, a computer simulation program was developed that generated the EP and the standard deviation of the individual lot payment factors for any value of either PWL or AAD and the corresponding payment equation. The program output also identifies both the PWL and AAD values for the population. This program makes it simple to compare PWL and AAD payment plans provided that equivalent payment equations are developed for AAD and PWL. Tables 39 through 41 allow the development of such equivalent AAD and PWL payment schedules.
As an example, suppose an agency was considering the use of PWL with the payment factor determined by equation 18. However, the agency would also like to evaluate a payment equation based on AAD that would provide for a given normal population the same EP as the PWL equation. This is not difficult to do and, indeed, was done in this project to compare PWL and AAD payment procedures for the same population.
First, equation 18 was used to determine the payment factor for a number of actual PWL values ranging from 90 to 10. Table 41 was then used to identify the AAD value that corresponded to each of the PWL values. This then allowed the payment factors to be associated with their respective AAD values. The results of this process are shown in table 42.
Table 42. AAD values equivalent to the corresponding PWL payment factors.
| Payment Factor | Corresponding PWL Value | Equivalent AAD Value |
|---|---|---|
| 100 | 90 | 0.798 |
| 95 | 80 | 1.019 |
| 90 | 70 | 1.238 |
| 85 | 60 | 1.461 |
| 80 | 50 | 1.688 |
| 75 | 40 | 1.925 |
| 70 | 30 | 2.186 |
| 65 | 20 | 2.497 |
| 60 | 10 | 2.931 |
The AAD program that was developed allows for the use of a compound payment equation that is made up of two straight lines with different equations. To illustrate this and to help match the EP curve of the PWL payment equation, it was decide to use two equations that met at AAD = 1.925. The program allows for an equation in the form:
![]() (23)
(23)
It is easy to solve for the A and B coefficients using the values in table 42. Doing so resulted in the following AAD payment plan to match the PWL payment equation:
![]() (24)
(24)
![]() (25)
(25)
One should note that equations 24 and 25 each provide a payment factor of 75 when AAD = 1.925, thus providing the desired continuity in the two payment equations.
Computer simulation was used to compare the performance of a PWL payment plan based on equation 18 with that of an AAD payment plan based on equations 24 and 25. The results of these simulations are shown in table 43 and figures 59 and 60. The plans have very similar EPs, with the AAD plan being slightly higher in the mean offset range of about 1.5 to 2.5. However, table 39 shows that this represents PWL values of about 55 and below. The PWL standard deviations increase to a peak at a mean offset of about 1.6 to 1.7, and are higher than those for AAD for the middle portion of the plot. The PWL peak corresponds to a PWL of 50, which was shown previously to be the point of maximum variability for PWL estimates.
Table 43. Results of the simulation of matched PWL and AAD payment equations for sample size = 5.
| Mean Offset | PWL Results | AAD Results | ||||
|---|---|---|---|---|---|---|
| PWL | Expected Payment | Standard Deviation | AAD | Expected Payment | Standard Deviation | |
| 0.000 | 90 | 100.26 | 5.40 | 0.798 | 99.76 | 5.05 |
| 0.775 | 80 | 95.05 | 7.22 | 1.019 | 94.96 | 7.03 |
| 1.112 | 70 | 89.74 | 8.61 | 1.238 | 89.99 | 7.76 |
| 1.389 | 60 | 85.41 | 9.26 | 1.461 | 85.03 | 8.39 |
| 1.644 | 50 | 80.15 | 9.52 | 1.688 | 80.71 | 8.21 |
| 1.898 | 40 | 74.48 | 9.41 | 1.925 | 76.55 | 8.00 |
| 2.169 | 30 | 69.76 | 8.91 | 2.186 | 71.78 | 7.35 |
| 2.487 | 20 | 65.02 | 7.79 | 2.497 | 66.57 | 6.99 |
| 2.926 | 10 | 60.11 | 5.51 | 2.931 | 60.14 | 6.65 |
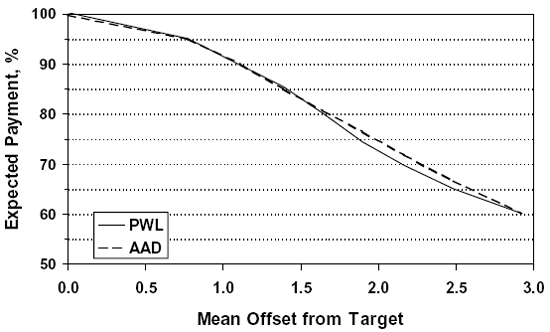
Figure 59. EP curves for matched PWL and AAD payment equations for sample size = 5.
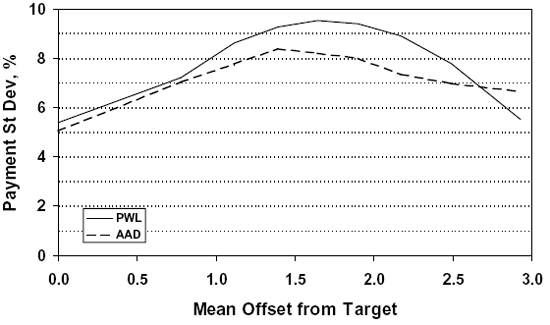
Figure 60. Standard deviations for individual payment factors for matched PWL and AAD payment equations for sample size = 5.
While there were some minor differences, the simulation study showed that when a single quality characteristic is used, it is possible to develop separate, but matched, PWL and AAD payment equations that provide similar EP curves and have reasonably close variability associated with the individual lot payment factors.
Since it is rare that only a single quality characteristic is used to determine the payment factor for a lot, it was also necessary to consider how the quality measures performed when multiple acceptance characteristics were used and to consider methods for combining these individual estimated quality measures into a combined, or composite, payment factor. While it was not within the scope of the original project, it was decided that, if multiple quality characteristics were to be investigated, it would also be necessary to consider potential correlations among these characteristics.
First it was necessary to develop computer routines for simulating correlated normal variables. These simulation routines were developed to simulate up to four correlated variables. The routines were then tested to verify that they were capable of generating samples with the intended level of correlation among the various variables.
Correlation is related to a pair of variables and the amount of correlation between the two variables is measured in terms of the correlation coefficient. Correlation coefficients can vary from +1.0 (as one variable increases, the other also increases with perfect correlation) to -1.0 (as one variable increases, the other decreases with perfect correlation). A correlation coefficient of 0.0 indicates that there is no correlation between the results of the two variables.
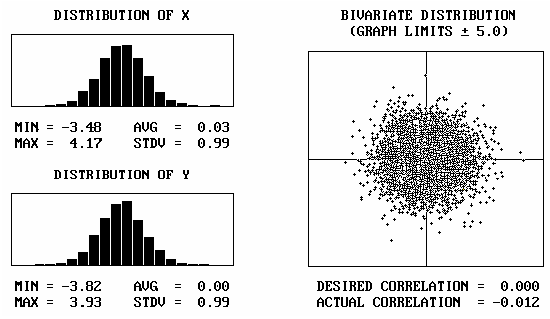
Figure 61 shows the output screens from the simulations of 5000 pairs of correlated normal variables, each with different selected correlation coefficients. The histograms on the left side of the plots show the two normal populations from which the correlated values were generated. The scatter plots on the right side of the figures show the data that were simulated. Figure 61(a) shows a situation where the two variables are not correlated. The resulting plot shows no pattern in the results when one variable is plotted against the corresponding second variable. In this simulation, the desired correlation coefficient was 0.000, while the correlation coefficient for the 5000 simulated pairs of values was -0.012, which is quite close to the desired value.
Figure 61(b) shows a similar plot for a desired correlation coefficient of +1.000. In this case, there is perfect correlation between the two variables. The increasing straight line at a 45-degree angle that is obtained when the two variables are plotted against one another shows this relationship. The correlation of the simulated value was also +1.000. A plot for a correlation coefficient of -1.000 would also be a straight line, but would decrease at a 45-degree angle. The remaining plots show comparisons of various levels of positive and negative correlation, and also show that the simulation routine does a good job of simulating the desired correlation.
Figure 61a. Illustration 1 of two normal variables with various values for the correlation coefficient.
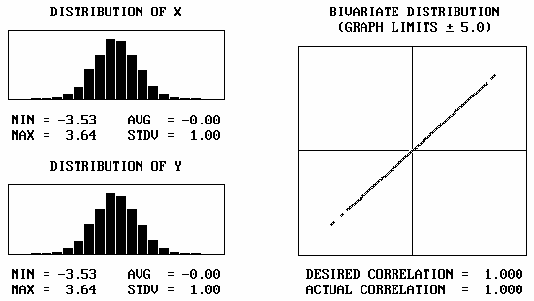
Figure 61b. Illustration 2 of two normal variables with various values for the correlation coefficient.
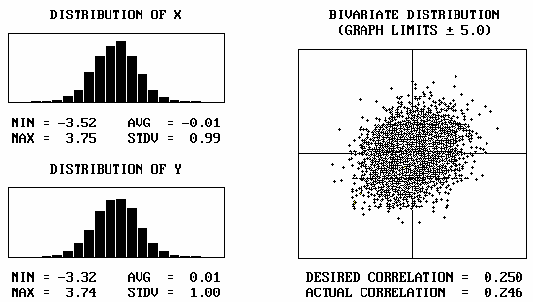
Figure 61c. Illustration 3 of two normal variables with various values for the correlation coefficient.
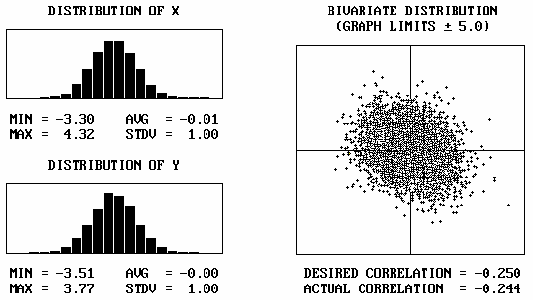
Figure 61d. Illustration 4 of two normal variables with various values for the correlation coefficient.
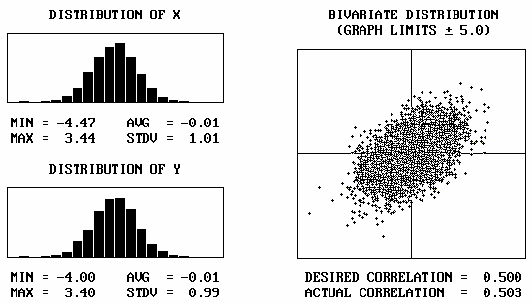
Figure 61e. Illustration 5 of two normal variables with various values for the correlation coefficient.
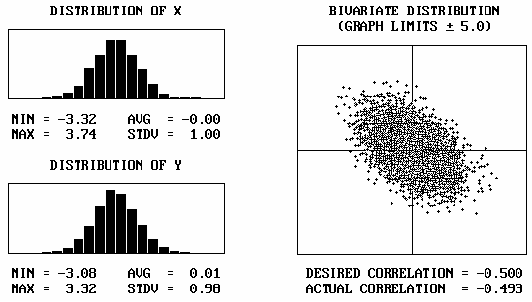
Figure 61f. Illustration 6 of two normal variables with various values for the correlation coefficient.
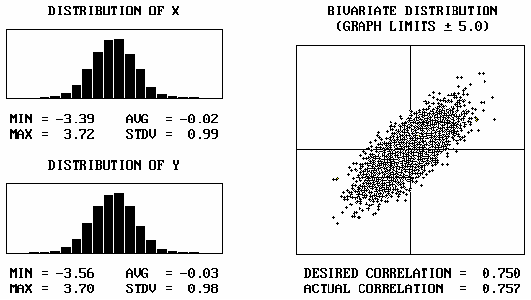
Figure 61g. Illustration 7 of two normal variables with various values for the correlation coefficient.
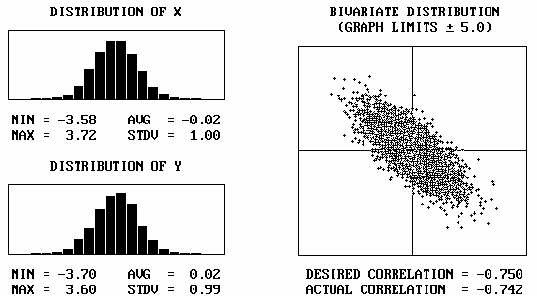
Figure 61h. Illustration 8 of two normal variables with various values for the correlation coefficient.
The simulation routine that was developed is capable of simulating up to four correlated normal variables. When more than two correlated variables are simulated, it is not possible to clearly show the correlation relationships as done in figure 61 for the two-variable case. However, tables 44 and 45 show the results of simulations for three and four correlated variables, respectively. While the results cannot easily be shown graphically, the tables show that the simulated data have correlation coefficients that compare closely with the desired values.
Table 44. Demonstration of the simulation of three correlated normal variables with selected values for correlation coefficients.
| Correlated Variables | Desired Correlation Coefficient | Simulated Correlation Coefficient |
|---|---|---|
| Example 1 | ||
| Variable 1-Variable 2 | +0.500 | +0.497 |
| Variable 1-Variable 3 | +0.250 | +0.259 |
| Variable 2-Variable 3 | +0.500 | +0.510 |
| Example 2 | ||
| Variable 1-Variable 2 | +0.500 | +0.500 |
| Variable 1-Variable 3 | -0.250 | -0.262 |
| Variable 2-Variable 3 | -0.500 | -0.509 |
| Example 3 | ||
| Variable 1-Variable 2 | -0.500 | -0.500 |
| Variable 1-Variable 3 | -0.500 | -0.496 |
| Variable 2-Variable 3 | -0.500 | -0.504 |
Table 45. Demonstration of the simulation of four correlated normal variables with selected values for correlation coefficients.
| Correlated Variables | Desired Correlation Coefficient | Simulated Correlation Coefficient |
|---|---|---|
| Example 1 | ||
| Variable 1-Variable 2 | +0.500 | +0.497 |
| Variable 1-Variable 3 | +0.250 | +0.269 |
| Variable 1-Variable 4 | +0.500 | +0.506 |
| Variable 2-Variable 3 | +0.500 | +0.500 |
| Variable 2-Variable 4 | +0.250 | +0.252 |
| Variable 1-Variable 4 | +0.500 | +0.510 |
| Example 2 | ||
| Variable 1-Variable 2 | -0.250 | -0.247 |
| Variable 1-Variable 3 | +0.500 | +0.494 |
| Variable 1-Variable 4 | -0.250 | -0.248 |
| Variable 2-Variable 3 | +0.500 | +0.513 |
| Variable 2-Variable 4 | +0.250 | +0.263 |
| Variable 1-Variable 4 | -0.500 | -0.478 |
Earlier in this chapter, the results from two simulation studies-one using PWL and equation 18 to determine payment and the other using AAD and equation 19 to determine payment-were compared. This comparison was expanded to address the case where two individual variables were considered when determining payment. While it is possible, and even likely, to have more than two variables involved in the acceptance and payment decision, it is not easy to picture the results when more than two variables are considered. Therefore, only the two-variable case was considered in this project. The results from two variables should be equally applicable to cases with three or four variables.
Two Populations of Equal Quality: The routines discussed above were used to compare the EP values and the amount of variability in the individual payment factors for both PWL and AAD when two correlated variables were involved. In the analyses for both PWL and AAD, the combined payment factor was taken as the weighted average of the two individual payment factors. This general payment relationship is shown in equation 26.
![]() (26)
(26)
where: W1 = weighting for variable 1
W2 = weighting for variable 2
PF1 = individual payment factor for variable 1
PF2 = individual payment factor for variable 2
A sample size = 5 was used in the analyses. Three different correlation coefficients between the two variables were considered: 0.0, -0.5, and +0.5. In each analysis, the two individual variables had the same actual population: 70 PWL or 1.238 AAD. Various weightings (1.00/0.00, 0.90/0.10, 0.75/0.25, 0.50/0.50, 0.25/0.75, 0.10/0.90, and 0.00/100.00) were used to determine the combined payment factor.
Since, in each case, the two individual populations were of equal quality (i.e., 70 PWL or 1.238 AAD), the same EP should be obtained regardless of the weightings used. For the PWL case, the EP for each individual variable should be 55 + (0.5 X 70) = 90. For the AAD case, the EP for each individual variable should be 105 - [24.75 X (1.238 - 0.798)] = 94.1.
The results from the analyses are presented in table 46 and figures 62 and 63 for PWL, and in table 47 and figures 64 and 65 for AAD. The results for the 1.00/0.00 and 0.00/1.00 weightings are equivalent to the one quality characteristic using variable 1 or variable 2, respectively.
From table 46 and figure 62, it is shown that the EP values do not change as either the correlation coefficients or the variable weights change. The EP values are all around the value of 90.0 calculated from the payment equation. Therefore, PWL provides an unbiased estimate for the combined payment factor regardless of the weights selected or the amount of correlation between the variables.
However, the same is not true with respect to the variability of the individual simulated combined payment factors, as indicated by the standard deviation values in table 46 and figure 63. There is a noticeable difference among the standard deviation values for the three different correlation coefficients, with the difference being greatest at the 0.50/0.50 weighting of the two variables. Also, within the values for each correlation coefficient, there is a similar trend of decreasing variability as the 0.50/0.50 weighting is approached.
Although they are both related to the same mathematical relationship for the variance of the sum of two random variables, two different phenomena are at work in these two trends. It can be shown mathematically that if a and b are constants and X and Y are random variables, then:
![]() (27)
(27)
Table 46. Results of PWL simulation analyses for two correlated normal variables.
| Weightings, Var1/Var2 |
Correlation Coefficient | |||||
|---|---|---|---|---|---|---|
| 0.00 | +0.50 | -0.50 | ||||
| Expected Pay | Std. Dev. | Expected Pay | Std. Dev. | Expected Pay | Std. Dev. | |
| 1.00/0.00 | 90.62 | 8.75 | 90.02 | 8.75 | 90.05 | 8.52 |
| 0.90/0.10 | 89.84 | 7.96 | 89.67 | 8.00 | 90.04 | 7.27 |
| 0.75/0.25 | 90.11 | 6.89 | 90.12 | 7.58 | 90.00 | 5.94 |
| 0.50/0.50 | 90.03 | 6.16 | 90.12 | 7.46 | 89.99 | 4.96 |
| 0.25/0.75 | 89.72 | 6.82 | 90.02 | 7.66 | 90.14 | 6.30 |
| 0.10/0.90 | 89.62 | 8.09 | 89.91 | 7.99 | 90.18 | 7.85 |
| 0.00/1.00 | 90.24 | 8.59 | 89.76 | 8.75 | 89.82 | 8.67 |
Table 47. Results of AAD simulation analyses for two correlated normal variables.
| Weightings, Var1/Var2 |
Correlation Coefficient | |||||
|---|---|---|---|---|---|---|
| 0.00 | +0.50 | -0.50 | ||||
| Expected Pay | Std. Dev. | Expected Pay | Std. Dev. | Expected Pay | Std. Dev. | |
| 1.00/0.00 | 93.92 | 8.44 | 93.60 | 8.53 | 93.61 | 8.51 |
| 0.90/0.10 | 93.84 | 8.14 | 93.78 | 8.45 | 93.58 | 7.25 |
| 0.75/0.25 | 93.31 | 6.96 | 93.69 | 7.81 | 93.76 | 6.23 |
| 0.50/0.50 | 94.12 | 6.13 | 93.53 | 7.52 | 94.01 | 5.06 |
| 0.25/0.75 | 93.84 | 7.14 | 93.84 | 7.62 | 94.30 | 6.03 |
| 0.10/0.90 | 93.32 | 8.04 | 93.63 | 8.17 | 93.36 | 7.51 |
| 0.00/1.00 | 93.23 | 8.81 | 93.70 | 8.53 | 93.30 | 8.47 |
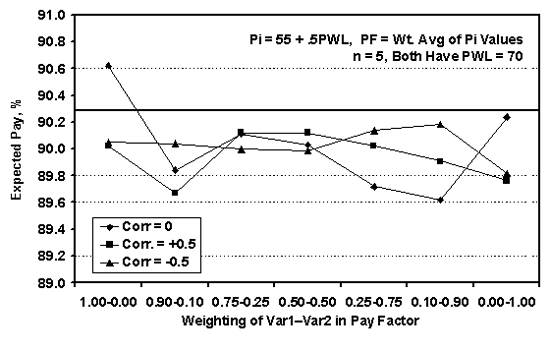
Figure 62. Expected combined weighted average payment factors for various weights and correlation coefficients based on PWL.
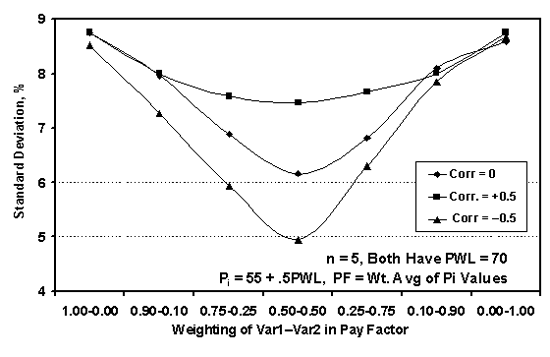
Figure 63. Standard deviations of weighted average payment factors for various weights and correlation coefficients based on PWL.
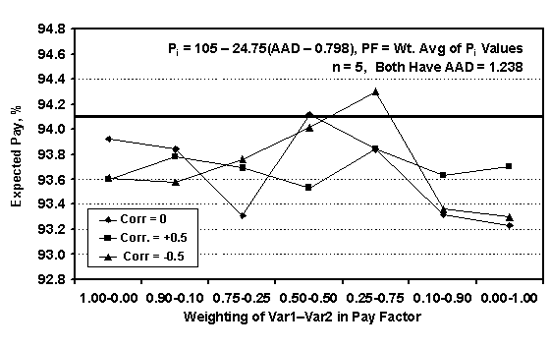
Figure 64. Expected combined weighted average payment factors for various weights and correlation coefficients based on AAD.
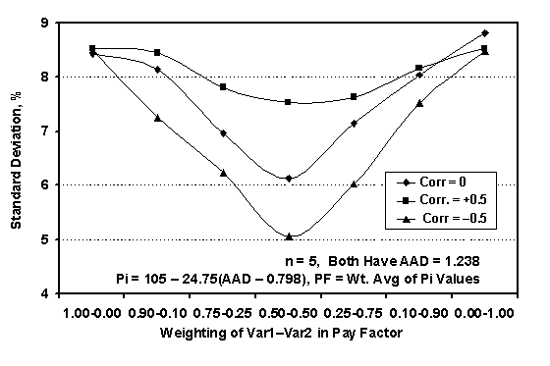
Figure 65. Standard deviations of weighted average payment factors for various weights and correlation coefficients based on AAD.
In equation 27, the last term is the covariance term and it is related to the correlation coefficient. The constants a and b can be related to the weightings (e.g., 0.50/0.50) that are multiplied by each of the random variables. Although equation 27 applies to the variability of the individual quality characteristic results, these results are used to determine PWL, which is linearly related to the payment factor by the payment equation. Therefore, equation 27 can be used to explain the standard deviation trends shown in figure 63.
In figure 63, for example, for a given set of weightings, such as 0.50/0.50, the standard deviation for +0.5 correlation is higher than for 0.0 correlation, which is higher than for -0.5 correlation. This follows directly from equation 27. For constant weightings, a and b in equation 27 remain the same for each correlation coefficient. Therefore, it is only the covariance term that changes the combined standard deviation value. For a correlation coefficient of 0.00, the covariance term in equation 27 also becomes 0.00. A positive correlation coefficient (and, therefore, a positive covariance term) results in a larger combined variability and, conversely, a negative correlation coefficient results in a smaller combined variability. Since the standard deviation also directly affects the AAD value, a similar standard deviation trend is shown for the AAD combined payment factors in table 47 and figure 65.
Equation 27 can also be used to explain the differences in standard deviation with respect to the weightings that are used. These weights are represented by the a and b constants in equation 27. For any given covariance value, the magnitudes of a and b will determine the differences in the combined standard deviations.
For example, take the case where the correlation coefficient is 0.00. In this event, the covariance term is eliminated from equation 27. Since the two variables have equal sample sizes, if measured in standard deviation units, they will also have equal variances for the purposes of calculating PWL and, therefore, payment. If we call this variance σ2, then for the case of a 0.50/0.50 weighting, equation 27 leads to:
![]() (28)
(28)
For example, figure 63 shows that the standard deviation for PWL, with a correlation coefficient of 0.00 and weighting of 1.00/0.00 or 0.00/1.00, is about 8.7. Based on the calculations above, the standard deviation for a 0.50/0.50 weighting should be about 0.707σ = 0.707 X 8.7 = 6.15, which is essentially the same value shown in table 46. Similar calculations verify the shapes shown in figures 63 and 65.
Therefore, for two populations with equal PWL values, the combined payment factor, based on the weighted average of the two individual payment factors, has the same mean payment as for the individual variables, but with smaller variability. This is an unexpected result of using a weighted average approach for combining individual payment factors into one combined payment factor.
To consider populations with additional PWL values, simulations were run for the case of populations with 90 PWL, 70 PWL, and 50 PWL. The simulations were run with weightings of 0.50/0.50 and with correlation coefficients between the two variables ranging from -1 to +1. For both the PWL case (figure 66) and the AAD case (figure 67), the horizontal lines show that the EP value is not sensitive to the correlation between the individual variables, at least when the weighted average is used to determine the composite payment.
However, figures 68 and 69 indicate that the variability of the payment estimates is indeed related to the correlation between the two individual variables. This same trend is evident for both PWL and AAD. This means that while the average payment stays the same, the variability about the average payment increases as the correlation goes from -1.0 to + 1.0 for the two lower quality populations (i.e., 70 PWL and 50 PWL, and 1.238 AAD and 1.688 AAD), while it decreases slightly as the correlation approaches 0.0 for the higher quality population (90 PWL and 0.798 AAD). The relationship is different for the higher quality population since the upper boundaries of either 100 PWL or 0.0 AAD will have a greater impact than for the lesser quality populations.
Two Populations of Different Quality: All of the two-variable analyses up to now have been for the case where the two populations have the same quality level (i.e., the same PWL or AAD). Tables 47 through 51 show the results of simulation analyses for cases where the two individual populations have different PWL or AAD values and 50/50 weighting of the two variables when determining the combined payment factor. Tables 48 and 49 show that while, as expected, the quality levels of the individual variables affect the EP values, the EP values do not appear to be impacted by a moderate degree of correlation (i.e., -0.5, 0.0, and +0.5). Tables 50 and 51, however, show that the variability of the payment values may increase slightly with either positive or negative correlation between the two individual variables. This trend is evident in each case, except when one of the variables has the lowest quality simulated (i.e., 50 PWL or 1.688 AAD).
The values in tables 48 through 51 are plotted in figures 70 through 73. As shown previously, the payment biases using PWL are small and are centered at the correct value, regardless of the quality levels of the two populations. This is not the case for the payment biases using AAD, which are larger than for PWL and are negative for higher quality levels and positive for lower quality levels. For both PWL and AAD, the standard deviation values are lower for higher quality populations and there is little difference associated with the correlation coefficients. As the level of quality becomes lower, the standard deviations become larger and a difference develops with respect to the correlation coefficients. This trend is true for both PWL and AAD.
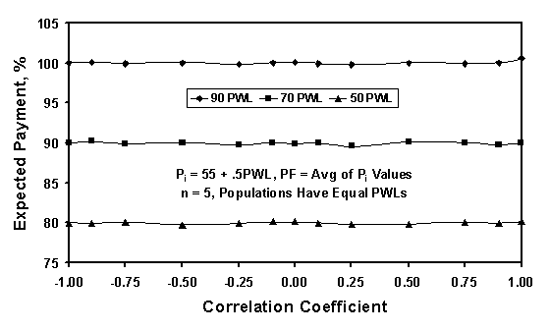
Figure 66. Expected average payment factors for two populations with various correlation coefficients based on PWL.
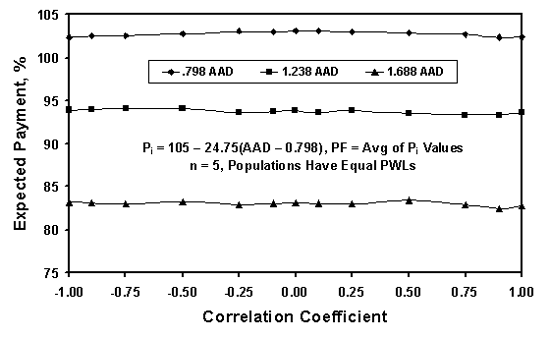
Figure 67. Expected average payment factors for two populations with various correlation coefficients based on AAD.
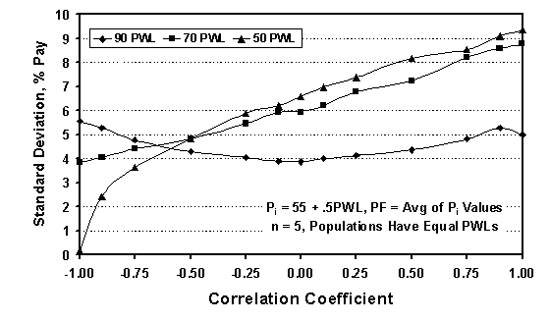
Figure 68. Standard deviations of individual payment factors for two populations with various correlation coefficients based on PWL.
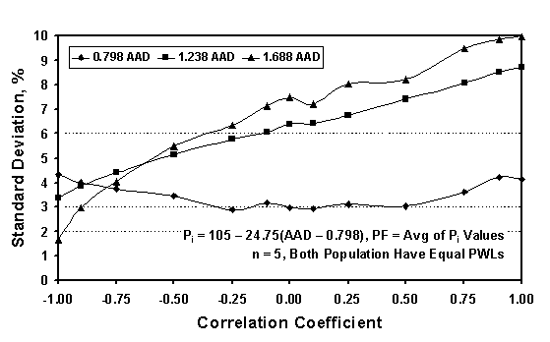
Figure 69. Standard deviations of individual payment factors for two populations with various correlation coefficients based on AAD.
Table 48. Bias in EP for two populations with equal PWL values and various correlation coefficients.
| PWL-1 | PWL-2 | Correct Pay | Correlation Coefficient | ||
|---|---|---|---|---|---|
| -0.50 | 0.00 | +0.50 | |||
| 90 | 80 | 97.50 | -0.38 | -0.30 | +0.07 |
| 90 | 70 | 95.00 | -0.06 | +0.22 | -0.07 |
| 90 | 60 | 92.50 | +0.08 | +0.16 | +0.19 |
| 90 | 50 | 90.00 | 0.00 | -0.17 | +0.02 |
| 80 | 70 | 92.50 | +0.21 | +0.14 | -0.08 |
| 80 | 60 | 90.00 | +0.05 | +0.11 | -0.04 |
| 80 | 50 | 87.50 | +0.13 | -0.09 | -0.13 |
| 70 | 60 | 87.50 | +0.32 | +0.14 | -0.20 |
| 70 | 50 | 85.00 | -0.05 | -0.01 | -0.04 |
| 60 | 50 | 82.50 | -0.07 | +0.16 | -0.06 |
Table 49. Bias in EP for two populations with equal AAD values and various correlation coefficients.
| AAD-1 | AAD-2 | Correct Pay | Correlation Coefficient | ||
|---|---|---|---|---|---|
| -0.50 | 0.00 | +0.50 | |||
| 0.798 | 1.019 | 102.25 | -1.11 | -1.13 | -1.35 |
| 0.798 | 1.238 | 99.55 | -0.63 | -0.54 | -0.41 |
| 0.798 | 1.461 | 96.80 | -0.33 | -0.26 | -0.01 |
| 0.798 | 1.688 | 94.00 | -0.34 | -0.34 | -0.44 |
| 1.019 | 1.238 | 96.80 | +0.96 | +0.71 | +0.92 |
| 1.019 | 1.461 | 94.05 | +1.41 | +1.13 | +1.60 |
| 1.019 | 1.688 | 91.25 | +1.51 | +1.10 | +1.47 |
| 1.238 | 1.461 | 91.35 | +1.18 | +1.24 | +1.05 |
| 1.238 | 1.688 | 88.55 | +1.53 | +1.49 | +0.74 |
| 1.461 | 1.688 | 85.80 | +1.02 | +1.32 | +1.37 |
Table 50. Standard deviations of individual payment factors for two populations with equal PWL values and various correlation coefficients.
| PWL-1 | PWL-2 | Correlation Coefficient | ||
|---|---|---|---|---|
| -0.50 | 0.00 | +0.50 | ||
| 90 | 80 | 5.05 | 4.77 | 4.95 |
| 90 | 70 | 5.41 | 4.99 | 5.23 |
| 90 | 60 | 5.61 | 5.34 | 5.49 |
| 90 | 50 | 5.33 | 5.60 | 5.43 |
| 80 | 70 | 4.76 | 5.76 | 6.95 |
| 80 | 60 | 4.99 | 6.15 | 7.06 |
| 80 | 50 | 5.12 | 6.12 | 7.09 |
| 70 | 60 | 5.25 | 6.21 | 7.57 |
| 70 | 50 | 4.99 | 6.56 | 7.58 |
| 60 | 50 | 4.94 | 6.44 | 8.39 |
Table 51. Standard deviations of individual payment factors for two populations with equal AAD values and various correlation coefficients.
| AAD-1 | AAD-2 | Correlation Coefficient | ||
|---|---|---|---|---|
| -0.50 | 0.00 | +0.50 | ||
| 0.798 | 1.019 | 4.38 | 3.97 | 4.58 |
| 0.798 | 1.238 | 5.39 | 4.88 | 5.39 |
| 0.798 | 1.461 | 5.86 | 5.63 | 5.72 |
| 0.798 | 1.688 | 6.03 | 6.09 | 6.16 |
| 1.019 | 1.238 | 5.52 | 5.37 | 5.92 |
| 1.019 | 1.461 | 5.96 | 6.05 | 6.54 |
| 1.019 | 1.688 | 6.29 | 6.25 | 7.00 |
| 1.238 | 1.461 | 5.71 | 6.79 | 7.65 |
| 1.238 | 1.688 | 5.90 | 6.80 | 7.97 |
| 1.461 | 1.688 | 5.94 | 6.88 | 8.44 |
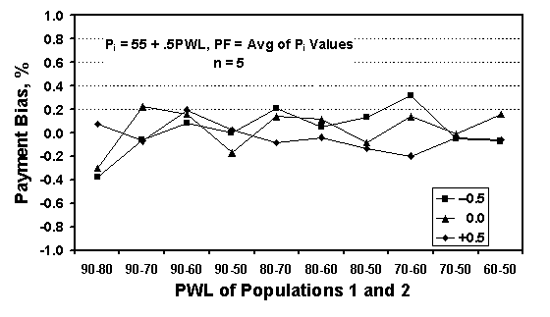
Figure 70. Bias for the average payment for two populations with various actual PWL values.
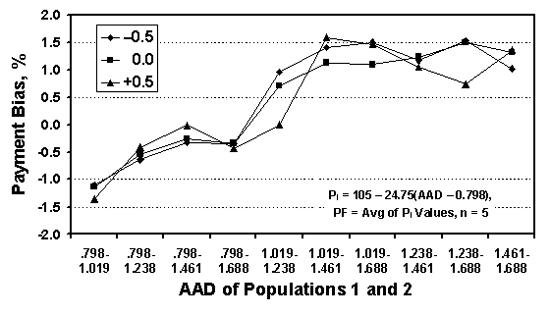
Figure 71. Bias for the average payment for two populations with various actual AAD values.
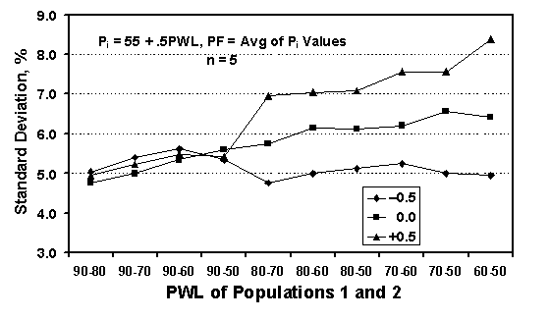
Figure 72. Standard deviation for the individual average payment values for two populations with various actual PWL values.
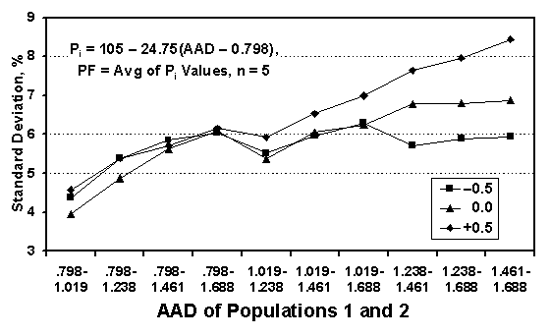
Figure 73. Standard deviation for the individual average payment values for two populations with various actual AAD values.
While the analyses indicated that, in general, the AAD quality measure performed about as well as the PWL quality measure, there were instances where the AAD measure had greater payment variability and exhibited some trends regarding payment bias. These issues, in themselves, would not be sufficient to eliminate AAD as a potential quality measure. However, there are some other drawbacks to AAD that make it a less appealing quality measure than PWL.
It is necessary to measure both center and spread when characterizing a population (lot) of material. Because of this, there are potential difficulties with the AAD quality measure. One drawback with AAD acceptance plans is that since lot variability is not really measured, a given lot AAD could come from a number of different populations. For example, the population could be centered at the target, but have a relatively large standard deviation (i.e., larger than the one that was assumed when developing the AAD acceptance limits or payment equation). Another population could have the same AAD by being centered off the target and having the same standard deviation that was assumed when developing the acceptance values. A third population could have the same AAD value by having a mean far from the target, but also by having a relatively small standard deviation. The fact that dissimilar populations can have the same AAD is shown by the distributions in figure 38 in chapter 6.
While some of these drawbacks may also apply to PWL (or PD) acceptance plans, such as the fact that a given PWL can represent many different populations, there are fewer drawbacks because both sample mean and standard deviation are measured in the PWL method. Also, since the PWL method can be used with both one-sided and two-sided acceptance properties, it is more versatile than the AAD method, which cannot be applied to one-sided limits.
Therefore, PWL (or its complement PD) was selected as the best quality measure for use in QA specifications. All remaining analyses were conducted only for the PWL (or PD) quality measure.
Now that the quality measure has been selected, its use needs to be further analyzed with respect to the risks associated with the small sample sizes that are typically used in highway materials and construction applications. Risks related to PWL and PD estimates, and their related payment factors, are discussed in chapter 9.