U.S. Department of Transportation
Federal Highway Administration
1200 New Jersey Avenue, SE
Washington, DC 20590
202-366-4000
Federal Highway Administration Research and Technology
Coordinating, Developing, and Delivering Highway Transportation Innovations
 |
||
 | report |  |
| This report is an archived publication and may contain dated technical, contact, and link information | ||
|
Publication Number: FHWA-HRT-11-026
Date: January 2011 |
Geosynthetic Reinforced Soil Integrated Bridge System Interim Implementation GuideAPPENDIX B. PERFORMANCE TEST PROCEDUREB.1 PERFORMANCE TEST OVERVIEWA performance test (or mini–pier experiment) is recommended to design a GRS abutment if the selected reinforced fill is outside the gradations given in chapter 3. A mini–pier experiment is a large element GRS load test to provide the designer with material strength properties of a particular GRS composite mass built with a unique combination of reinforcement, compacted fill, and facing elements. The procedure involves axially loading the GRS mass while measuring vertical settlement and lateral deformation to monitor performance. This information can then be used to aid in the design process to predict performance of a full–scale GRS composite mass. The performance test concept has been applied to smaller–scale models from small triaxial–sized samples to 2–ft cubed specimens in small–capacity test frames.( 24, 25 ) However, due to the size of the aggregates that are often used in GRS fills, larger–scale models must be used to adequately predict the performance of a full–scale GRS abutment. Several large–scale tests have also been conducted.( 11, 25, 26 ) The proposed performance test, outlined in this appendix, has been shown to accurately predict the actual settlement of in–service GRS abutments (see chapter 4).( 12, 27, 28 ) The reinforcement, fill (compaction effort), and facing materials in the performance test should be the same as what is planned for the GRS abutment. The spacing of the reinforcement is dictated by the abutment design, which is recommended to be 8 inches at most. The bearing reinforcement bed should extend through the top two courses of blocks. Since the specifics of the performance test will be dictated by the actual abutment design and materials, set dimensions and materials will vary between each mini–pier experiment. The base–to–height ratio should be 2:1 (with the base width measured inside the facing elements). It is advisable to have a contact area that is slightly less than the footprint of the GRS mass, inset 2–3 inches on all sides. Two examples are provide to guide the designer or user on how to construct and test a model.
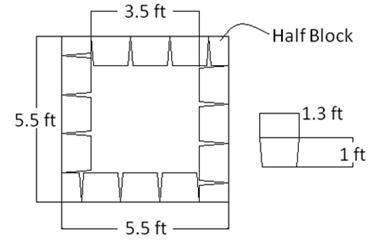
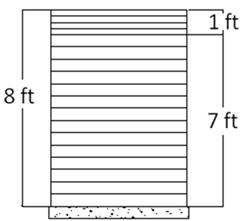
B.2 PERFORMANCE TEST EXAMPLE: VEGAS MINI–PIERThe following example is an actual performance test that was conducted, called the Vegas Mini–Pier Experiment. The reinforcement strength and spacing and the fill and facing elements are different from those outlined in the design of a GRS abutment presented in chapter 4. This example shows how a performance test can facilitate design with a unique combination of reinforcement, soil, and facing elements. In this test, the abutment was to be constructed with a reinforcement spacing of 6 inches and a bearing reinforcement bed of 3–inch spacing extended into the top two courses of blocks. The reinforcement was a woven PP geotextile with a wide width tensile strength of 2,400 lb/ft, per ASTM D4595. The gravel was classified as a GP–GM soil according to ASTM D2488 with a maximum diameter of 1 inch. The cohesion and friction angle of this material were 580 lb/ft2 and 40 degrees. Compaction of the fill for the mini–pier was performed with a hand tamper at the optimum moisture content. Considerable effort to compact each lift of soil was made, but soil density measurements were not taken during the construction process. Note that compaction testing (or a method specification for open–graded gravels) should be performed for each lift in a standard performance test. The facing elements were segmental retaining wall (SRW) blocks. The modular block was solid dry–cast concrete and had a split face. The height of the block was 6 inches and equal to the spacing of the reinforcement. The unit weight of each block was 82 lb. The blocks were frictionally connected to the GRS mass without the aid of pins or mechanical connection. To form the corners, the block was split, as shown in figure 86. The layout of the SRW blocks and the reinforcement schedule are shown in figure 86 and figure 87.
Figure 86. Illustration. Plan view of Vegas Mini–Pier Experiment.
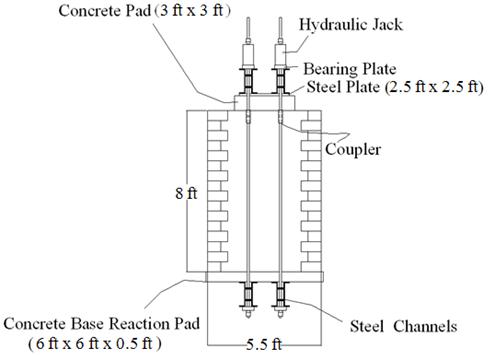
Figure 87. Illustration. Elevation view of Vegas Mini–Pier Experiment. The scaled GRS mass was built on a concrete base pad (see figure 88 ). The base pad was elevated on the cinderblock to make room for the two bolted channel beams. The load test setup is illustrated in figure 89 and figure 90. The top set of bolted channels was supported on the top concrete pad, which was centered on the GRS mass. The top pad was not supported on the SRW blocks (see figure 89 ). The upper and lower channel beams were coupled together with threaded bar. Four hollow–core hydraulic jacks were bolted to the top channel beams (see figure 91 ). All jacks were connected to a manifold and controlled with a servo–controlled hydraulic pump.
Figure 88. Photo. Vegas Mini–Pier Experiment reaction base.
Figure 89. Illustration. Side view of Vegas Mini–Pier Experiment.
Figure 90. Illustration. Face view of Vegas Mini–Pier Experiment.
Figure 91. Photo. Hollow–core hydraulic ram bolted to the top channel beams. During the load test, vertical stress was applied in increments of 5 psi. Load was measured with a hydraulic oil pressure gauge and a load cell. Vertical stress was calculated by dividing the sum of the force from each jack by the area of the GRS mass. The top area of the GRS mass was 3.5 ft by 3.5 ft. The area of the top pad was 3 ft by 3 ft, less than the area of the GRS mass (see figure 89 ). Each load increment was maintained between 5 to 7 min. Vertical and lateral deformations of the GRS mass were recorded during each load increment. Deformations were measured with dial gauges referenced off scaffolding next to the mini–pier. Vertical settlements were measured on the four corners of the top pad while lateral deformations were measured at five points along one wall face of the GRS mass. Ceramic tiles were glued to the concrete pad and SRW block to create a smooth surface for accurate measurement of deformation. The experiment was terminated at a vertical stress of 145 psi. The vertical strain at this stress was measured at 2.9 percent. At this point, the stroke on the dial gauges and linear variable differential transformers ran out, so the test was ended. The resulting stress–strain curve is shown in figure 92.
Figure 92. Graph. Vegas Mini–Pier stress–strain curve.
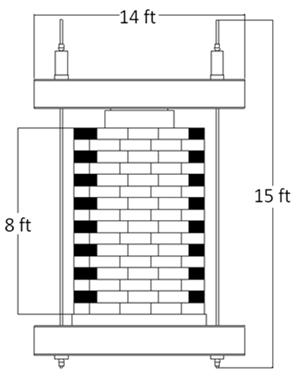
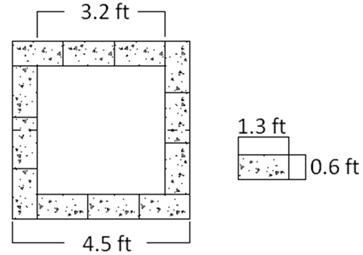
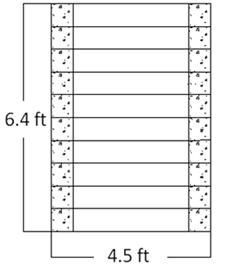
B.3 PERFORMANCE TEST EXAMPLE: DEFIANCE COUNTY PERFORMANCE TESTThe following example is an actual performance test that was conducted, called the Defiance County Performance Test. The reinforcement strength and spacing and the fill and facing elements were the same as those outlined in the design of a GRS abutment in chapter 4. The layout of the CMU blocks and the reinforcement schedule are shown in figure 93 and figure 94.
Figure 93. Illustration. Plan view of Defiance County experiment.
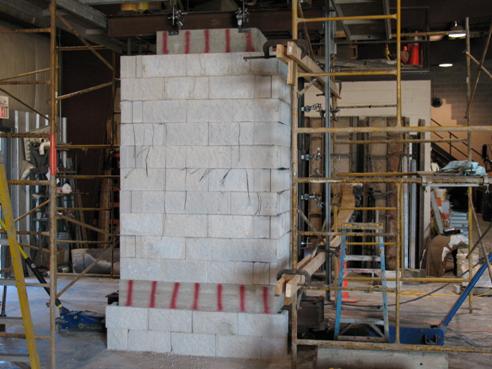
Figure 94. Illustration. Elevation view of Defiance County experiment. In this test, the abutment was constructed with a reinforcement spacing of 8 inches and a bearing reinforcement bed of 4–inch spacing extended in the top two courses of block. The reinforcement was a woven PP geotextile, with a wide width tensile strength of 4,800 lb/ft, per ASTM D4595. The gravel was classified as AASHTO No. 89 stone, according to ASTM D2488, with a maximum diameter of 0.5 inches. There was zero cohesion and a 48 degree friction angle (as determined using a large shear box test). Compaction of the fill was performed with a hand tamper. Considerable effort to compact each lift of fill was made, but soil density measurements were not taken during the construction process. The facing elements were CMU blocks. The modular block was solid dry–cast concrete and had a split face. The height of the block was 8 inches and was equal to the spacing of the reinforcement. The unit weight of each block was 42 lb. The blocks were connected to the GRS without the aid of pins or mechanical connection. The layout of the CMU blocks and the reinforcement schedule are shown in figure 93 and figure 94. The scaled GRS mass was built on a concrete base pad similar to that of the Vegas Mini–Pier Experiment (see figure 95 ). The red lines on the concrete base and top reaction pads in figure 95 show the principle direction of the rebar reinforcement to transfer the force from the channels to the pads. The base pad was elevated with cinderblocks to make room for the two bottom reaction channel beams. The top set of bolted channels was supported on the top concrete pad, which was centered on the GRS mass. The top pad was set inside the perimeter of the CMU block by 2.5 inches The upper and lower channel beams were coupled together with threaded bar, bearing plates, and nuts.
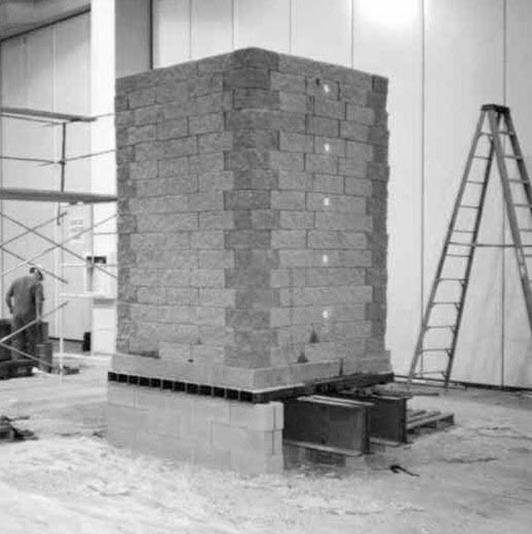
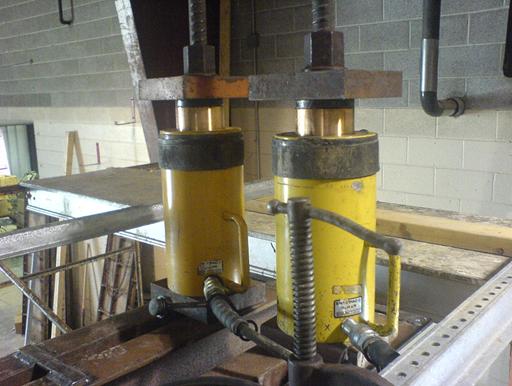
Figure 95. Photo. Defiance County experiment before testing. Load increments were applied to capture both the linear elastic and plastic portions of the stress–strain behavior of the composite mass (see figure 96 ). Load was measured with a hydraulic oil pressure gauge and load cell. Vertical stress was calculated by dividing the sum of the force from each jack by the area of the GRS mass. The top area of the GRS mass was 3.2 ft by 3.2 ft. The area of the top pad was 2.75 ft by 2.75 ft to create a uniform load distribution.
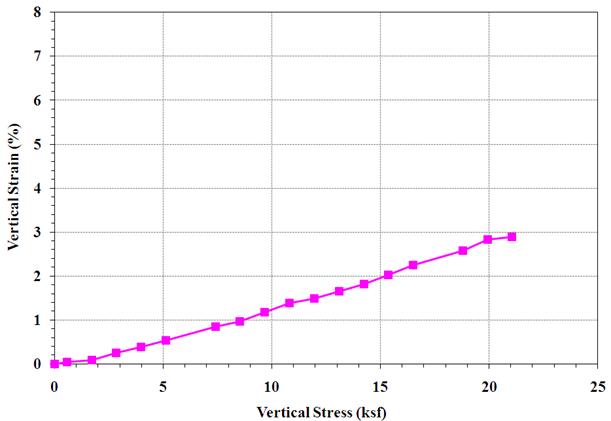
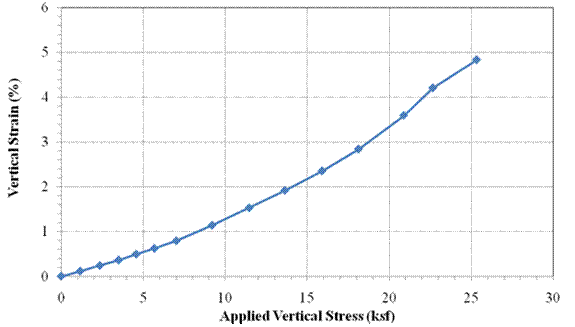
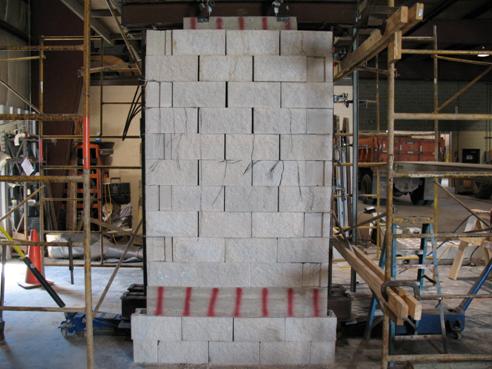
Figure 96. Graph. Defiance County stress–strain curve. Vertical and lateral deformations of the GRS mass were recorded during each load increment. Deformations were measured with dial gauges referenced off scaffolding next to the mini–pier (see figure 95 ). Vertical settlements were measured on the four corners of the top pad while lateral deformations were measured at five points along one wall face of the GRS mass. Ceramic tiles were glued to the concrete pad and CMU block to create a smooth surface for accurate measurement of deformation. The experiment was terminated at a vertical stress of 180 psi. The vertical strain at this stress was measured at 4.8 percent. After this extreme loading, the mini–pier remained standing with a symmetrical bulge in the upper third of the wall (see figure 97 ). Note the slightly displaced blocks in this area. The resulting stress–strain curve is shown in figure 96.
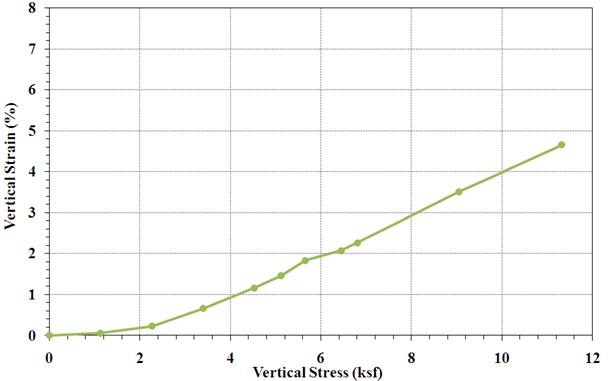
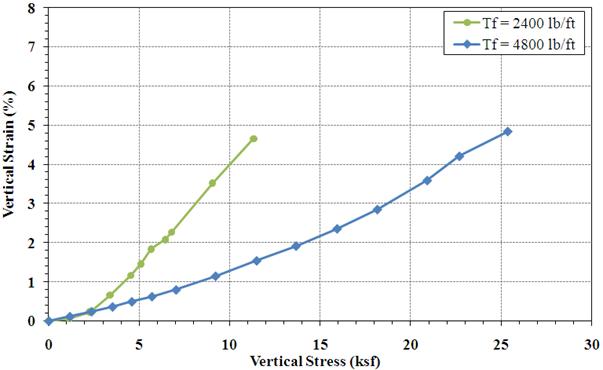
Figure 97. Photo. Defiance County experiment after testing. The Defiance County experiment was also conducted with a weaker fabric (2,400 lb/ft), using the same fill material and reinforcement spacing. The resulting stress–strain curve is shown in figure 98. Note that the strain upon completion of the test was 4.6 percent, about the same as the performance test with stronger fabric (4,800 lb/ft). The ultimate applied stress, however, is much different as a result of the decreased strength of the reinforcement that was used (see figure 99 ). At a working stress of 4 ksf, the strain using the weaker fabric is about 1.0 percent (see figure 98 ), well above the tolerable limit of 0.5 percent. Using the results of these tests, the stronger fabric (4,800 lb/ft) was chosen for the GRS–IBS application in Defiance County , OH.
Figure 98. Graph. Defiance County stress–strain curve (weaker fabric).
Figure 99. Graph. Defiance County experiment comparison.
|