U.S. Department of Transportation
Federal Highway Administration
1200 New Jersey Avenue, SE
Washington, DC 20590
202-366-4000
Federal Highway Administration Research and Technology
Coordinating, Developing, and Delivering Highway Transportation Innovations
| REPORT |
| This report is an archived publication and may contain dated technical, contact, and link information |
|
| Publication Number: FHWA-HRT-12-054 Date: December 2012 |
Publication Number: FHWA-HRT-12-054 Date: December 2012 |
Several different formulations may be used to relate the value of money and the annual cost of a project. Because project costs and benefits are incurred annually, life-cycle cost is conveniently expressed as annualized cost.(55) The computation of life-cycle cost is described in NYSDOT's Intelligent Transportation Systems Scoping Guidance.(56)
The value of design cost and construction cost (PDC) is shown in figure 61.
![]()
Figure 61. Equation. Value of design and construction cost.
The capital recovery factor (CRF) relates the interest rate (I) and system operational life (NL) to these capital costs, as shown in figure 62.

Figure 62. Equation. Capital recovery factor.
Tables for CRF are also provided in standard economics texts. Historical interest rates for several years are more likely to be appropriate than the use of the current interest rate.
The uniform annual equivalent investment cost (REI) is provided in figure 63 as follows:
![]()
Figure 63. Equation. Uniform annual equivalent investment cost.
Annualized life-cycle cost (LCC) is provided in figure 64 as follows:
![]()
Figure 64. Equation. Annualized life-cycle cost.
In figure 62, the system operational life (NL) may be considered to be the average life of a component weighted by the furnish and the installation cost of the component for the project. It is recommended that an estimate for NL be obtained by evaluating the weighted average life for 10 of the most costly components.
The benefit evaluation techniques discussed in this report generally provide system-wide performance values on an annual basis. The monetary value of project benefits is provided by the difference between the performance for the baseline period for the evaluation and the current operation period. The baseline period may be taken as the performance period prior to the introduction of the ITS or a major change in operation. Section 6.6 of this report discusses evaluation alternatives when prior evaluations have not been performed. Table 30 identifies the monetary performance components included in each of these evaluations.
Table 30. Performance component for benefit-cost analysis.
| Component | Expression | Reference for Key Parameters |
|---|---|---|
| Private vehicle occupant system delay | PVOSD = H1 x LPP | Figure 22 |
| Commercial vehicle occupant system delay | CVOSD = H2 x LPT | Figure 23 |
| Goods inventory delay | GID = H3x LPG | Figure 24 |
| Cost of crashes | CC = H4 x CRA | None |
| Cost of fuel | Figure 42 |
Representative values for coefficients H1 through H5 in table 30 are provided in table 31.
Table 31. Representative values for coefficients.
Coefficient |
Definition | Representative Value in 2010 | Reference for Value |
|---|---|---|---|
H1 |
Private vehicle occupant system delay ($ per vehicle occupant) | 17.02 | Average of references 37, 50, and 54 adjusted to 2010 |
H2 |
Commercial vehicle occupant system delay ($ per vehicle occupant) | 27.49 | Reference 37 adjusted to 2010 |
H3 |
Goods inventory delay ($ per ton hour) | 30.81 | Reference 56 adjusted to 2010 |
H4 |
Cost of crashes ($ per crash) | 45,585.00 | Average of references 37, 52, and 56 adjusted to 2010 |
H5 |
Cost of fuel ($ per gallon) | Average of past 3 years |
N/A |
N/A = Not applicable.
Crash costs are the cost of fatality, injury, and PDO crashes weighted by the frequency of the accident class.
Costs were adjusted to 2010 levels by using the relationship in figure 65 as follows:
![]()
Figure 65. Equation. Cost adjusted to 2010 levels.
The Consumer Price Index may be obtained from the Bureau of Labor Statistics Web site at ftp://ftp.bls.gov/pub/special.requests/cpi/cpiai.txt. The annual average value column was used in all cases for the representative data in table 31.
The annualized monetary performance for the project is provided by figure 66.
![]()
Figure 66. Equation. Monetary performance.
The annualized monetary benefit for the project is provided by figure 67.
![]()
Figure 67. Equation. Monetary benefit.
Where:
BA = Baseline year.
E = Year for which the evaluation is
performed.
MB = Monetary benefit.
MP = Monetary performance.
Note that the values for H1 through H5 for the evaluation year should also be used for the base year.
Comparisons of benefits and costs often provide the basis for initiating projects, operating projects, and modifying project equipment or operations.
The benefit-cost ratio provided in figure 68 is the most commonly used measure of the value of a project and is often used to assist in prioritizing resources among competing requirements for resources. While a benefit-cost ratio greater than 1.0 is required for viable projects, projects with higher benefit-cost ratios often provide decisionmakers with preferred rationales for project funding. Note that values for both MB and LCC are in evaluation-year dollars.
![]()
Figure 68. Equation. Benefit-cost ratio.
8.3.2 Other Benefit-Cost Relationships
Although benefit-cost is a commonly used measure, when design alternatives for a new project or a major addition to a current project are contemplated, they should be considered in the context of overall costs and benefits.
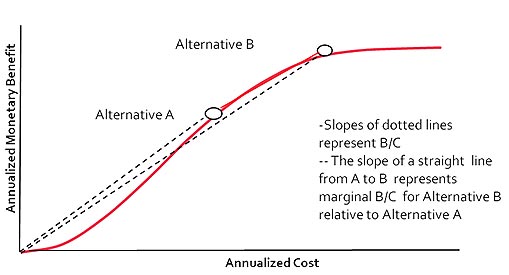
Figure 69 shows several possible system design or operation alternatives. The slopes of the dotted lines (when the axes scales are considered) are the benefit-cost ratios. Although alternative A has the higher benefit-cost, alternative B provides significantly greater benefits. The slope from alternative A to alternative B shows the marginal benefit-cost ratio of alternative B relative to alternative A. If this slope is significantly greater than 1.0, alternative B may be preferred, as it provides significantly greater benefits at an acceptable incremental cost.

Figure 69. Graph. Monetary benefits and costs for project alternatives.