
This section provides some detailed explanations of items necessary to complete the Feasibility Flowchart and Reasonableness Matrix.
Figure 2a. Feasibility Flowchart
Figure 2b. Reasonableness Matrix
| Item | Criteria | Input (English units) | Input (SI Units) |
|---|---|---|---|
| 1 | Enter length of proposed barrier | ft | m |
| 2 | Enter height of proposed barrier | ft | m |
| 3 | Multiply item 1 by item 2 | ft2 | m2 |
| 4 | Enter the average amount of time that a person stays at the site per visit | hours | hours |
| 5 | Enter the average number of people that use this site per day that will receive at least 5 dB(A) benefit from abatement at the site | people | people |
| 6 | Multiply item 4 by item 5 | person-hr | person-hr |
| 7 | Divide item 3 by item 6 | ft2/person-hr | m2/person-hr |
| 8 | Multiply $42,000 by item 7 | $/person-hr/ft2 | $/person-hr/m2 |
| 9 | Does item 8 exceed the "abatement cost factor" of: | ||
| 10 | If item 9 is no, abatement is reasonable | ||
| 11 | If item 9 is yes, abatement is not reasonable |
The term "Special Land Use" applies to those land uses that are not residential. This type of land use does not include dwelling residences or land use category C as defined by 23 CFR Part 772. Land use category D would only be evaluated if unusual land uses occur. Some examples of special land uses are shown below.
Receiver placement for special land use sites is similar to that of the residential analysis. Receivers should be placed at the closest location to the highway right of way (ROW) line where outdoor activity normally occurs to determine if the NAC is exceeded. In addition, receivers should be placed at locations away from the ROW line to determine the extent of impact and to consider sensitive receptors if the NAC are exceeded at the ROW line. The definition of a noise sensitive receiver is "any property where frequent exterior human use occurs and where a lowered noise level would be of benefit. In those situations where there are no exterior activities affected by the traffic noise, the interior of the building shall be used to identify a noise sensitive receiver."1.
In some cases, the decision to place receivers may be simple, as in the case of an amphitheater. In the case of a park, it may be more complex since people can use the park over a wide range of area. The reasonableness methodology must address this concern because it asks questions concerning sound levels at all site receivers. The following general guidance may be used to determine receiver placement and the number of receivers that receive 5 dB insertion loss (IL) with a barrier in place at special land use sites.
These are not noise sensitive areas.
This includes areas that people use for a significant period of time. This does not usually include transition areas from parking facilities to other facilities.
In some cases, this demarcation is obvious such as playgrounds at schools and pavilions or beaches at parks. The following examples illustrate the demarcation of frequent use areas at special land use sites.
Consider the school site shown in Figure 3.
Figure 3. Areas of Frequent Human Activity at a School
In the above example, both playground areas are deemed to have frequent human activity (see Figure 3) and so both of them are marked (marked with a dashed boundary) as areas where receivers can be placed. The next step is to place the receivers, first near the ROW line to determine if the NAC is approached or exceeded and if so, at greater distances from the roadway to determine the extent of exceedance. This is shown in Figure 4.
Figure 4. Receiver Placement at a School
It should be noted that the receivers in Figure 4 at the boundaries of the nearest frequent activity area and closest to the ROW line were evaluated first to determine if the NAC is exceeded. If indoor use was considered, receivers should be placed at the building and transmission loss considered. The analysis is conducted with these receivers to determine impact from the nearby road, the interior receiver sound levels are further abated by the building and the common value of 20 dB(A) attenuation is used in this case.
Receiver placement for the case of a public park is now discussed. The park example shown in Figure 5 indicates that we have chosen three areas that meet the criteria of frequent human activity. These areas include a pavilion area, beach and a large open area equipped with barbecue pits. Notice that in both examples, the school and the park, we have not designated parking lots as potential receiver areas. Now that we have designated the areas of the site where frequent activity exists, we can proceed to the next step of specifying the receiver locations.
Figure 5. Areas of Frequent Human Activity at a Park
The park example of Figure 5 has two roadways as noise sources and requires additional receivers as shown in the Figure. The receivers are again placed at the boundaries of the frequent activity areas near the ROW line to determine if the NAC is approached or exceeded. The other receiver locations are then only needed if an exceedance occurs to determine the extent of impact.
Figure 6 shows the receiver placement for the public park example of Figure 5.
Figure 6. Receiver Placement at a Park
We now discuss receiver placement for the case of a church. The church example shown in Figure 7 indicates that we have chosen one area that meets the criteria of frequent human activity.
Figure 7. Area of Frequent Human Activity at a Church
Figure 7 shows that the only area of frequent outside human activity is the playground area. This church site also contains a large parking lot which we do not consider for receiver placement since it is not a noise sensitive area.
The next step is to place receivers on the designated areas. Figure 8 depicts the receiver placement for this church site. Receivers are placed first near the ROW line to determine if the NAC is approached or exceeded and if so, at greater distances from the roadway to determine the extent of exceedance. Figure 8 shows two receivers at the boundary of the playground area closest to the ROW line and a receiver further back to evaluate extent of impact.
Figure 8. Receiver Placement at a Church
We have discussed receiver placement to determine the extent of noise impact on a site. Once impact (whether NAC levels are approached or exceeded) has been assessed and confirmed, abatement is proposed. At this point there is a further need to evaluate receivers that will benefit from proposed abatement. Benefited receiver determination is based on the amount of people that use areas protected by abatement. This topic is discussed in the next section.
The process of adding additional receivers placed at successive distances from the noise source to evaluate insertion loss is needed for determination of the "benefited receivers" mentioned in the Reasonableness Matrix item 5. A benefited receiver is a receiver that receives at least a 5 dB(A) noise level reduction with the proposed abatement in place. Receivers placed in a "grid" fashion is the most effective method but requires the most receiver placement. Using noise contours is also very effective. An example of receiver placement to establish the number of benefited receivers is shown in the Figure below.
Figure 9. Receiver Placement to Evaluate Barrier Insertion Loss
The grid of receivers shown in Figure 9 can provide an indication of the portion of the area of frequent human use that receives at least 5 dB(A) insertion loss from a proposed barrier. Let us assume that a noise impact assessment for this site predicted the insertion loss values noted in Figure 10.
Figure 10. Insertion Loss at Receiver Locations

The insertion losses shown in Figure 10 indicate that five of the nine receivers meet the 5 dB(A) insertion loss criteria. To relate this information back to the number of actual receivers in the park we need to know the average daily persons that use this field area. If exact numbers of people are known by location, these should be used. If there is no information on use areas, a default "Approximate Method" would be to assume equal usage throughout the area.
Assume usage of the site is evenly distributed. As such, that portion of the site receiving more than 5 dB(A) insertion loss is protected and that fraction of people receiving protection is equal to the fraction of land protected. With that assumption we can determine the number of benefited receivers to be:
Benefited Receivers = PLP * ADP (3)
where:
PLP = fraction of total land area protected [5 dB(A) IL or more]
ADP = average daily persons using the area
The fraction of land use is derived by evaluation of the receiver grid such as that shown in Figure 10. A more exact method of determining benefited receivers can be used if more information is known about the site.
The percentage of land protected, that is receiving 5 dB(A) or more of insertion loss, is determined from the receiver grid evaluation shown in Figure 10. A more exact number of benefited receivers can be determined if the amount of people that use the protected areas is known. The number of benefited receivers can then be determined by summing the number of people per day that use the protected areas of the special land use site.

This number of benefited receivers, whether by exact location or fraction of total land protected and average daily persons using the site, is then used for item 5 of the Reasonableness Matrix.
The following discussion provides additional information for each of the Feasibility Flowchart and Reasonableness Matrix items.
FEASIBILITY FLOWCHART ITEMS
Feasibility Item #1
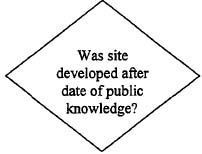
It is less reasonable to provide abatement for a site that was developed after public knowledge of the roadway construction. The developers were aware of the increased noise and chose to build at the site regardless.
Feasibility Item #2:
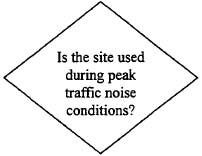
If the site is operated primarily during off peak traffic conditions it is not reasonable to predict sound levels based on peak traffic conditions. There are three possible ways to adjust for off peak traffic volumes and they depend on the amount of information known by the preparer.
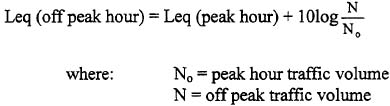
Method #1: Direct Calculation if Off Peak Volumes are known. The peak hour levels can be adjusted by use of the following formula if the off peak volumes are known:
Method #2: Adjustment Table if Off Peak Volumes not known. Table 4 contains a list of adjustment factors for peak traffic volume data using quick response techniques when the reduced traffic volume is not known.
Table 4. Traffic Volume Adjustment Factors for Weekdays2
| time | hr/peak hr | 10*log(hr/peak hr) dB(A) |
|---|---|---|
| 5-9 am | 0.55 | -2.6 |
| 9 am-2 p.m. | 0.64 | -1.9 |
| 2 p.m. - 8 p.m. | 1.00 | 0 - |
| 8 p.m. - -12 p.m. | 0.29 | -5.4 |
It should be noted that this correction should not be used for Interstate highways because of the high truck volumes and relatively constant noise levels.
Method #3: Default dB(A) Offset for Off Peak Use. Realizing that only peak traffic data may be available, a default correction can be applied by subtracting 1 dB(A) from predicted levels if the site is operated off peak during the week or 2 dB(A) from predicted levels if the site is operated primarily on the weekend. If a site is operated off peak during the week and also on weekends, subtract 1 dB(A) from predicted noise levels. It should be noted that this correction should not be used for Interstate highways because of the high truck volumes and relatively constant noise levels.
Feasibility Item #3:
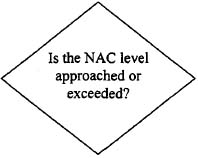
23CFR772.5(g) states that traffic noise impacts are those that approach or exceed the Noise Abatement Criteria for the site or when the predicted noise levels substantially exceed the existing noise levels and in these cases abatement must be considered. Feasibility Flowchart items #4 and #5 address this requirement. If the predicted noise levels at the site approach or exceed the NAC then the preparer proceeds to flowchart item #5, if not then the preparer must answer the substantial increase criteria question located in flowchart item #4.
Feasibility Item #4:
![Is there a substantial noise level increase [15 dB(A)]?](pg26img15.jpg)
This item completes the "or" statement of 23CFR772.5(g) that states that traffic noise impacts are those that approach or exceed the Noise Abatement Criteria for the site or when the predicted noise levels substantially exceed the existing noise levels. If the predicted sound levels for the site are greater than 15 dB(A) over the existing levels then the preparer continues the Feasibility analysis, otherwise the site is deemed not appropriate for abatement.
Feasibility Item #5:
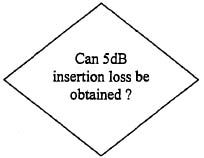
This item is included in Chapter 17 of the FDOT PD&E manual. In addition, 23CFR772.1 l(d) states that "when noise abatement measures are being considered, every reasonable effort shall be made to obtain substantial noise reductions." The PD&E manual interprets "substantial noise reduction" as an effort to reduce traffic noise impacts at benefited receptors by 10 decibels or more if possible, with a minimal acceptable level of reduction at no less than 5 decibels. If this 5 dB criteria cannot be met the analysis is finished because abatement is not feasible.
Feasibility Item #6:
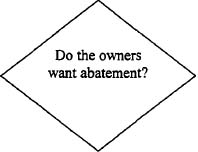
The owners of the property (i.e. church administrators or State Park officials) are those persons that most closely fit the title of owners of the property. If the abatement measure is unwanted there is no further analysis required. This flowchart item is meant to include all issues of owner opinion about abatement. If the owners are in favor of the abatement measure this flowchart item directs the preparer to proceed to the Reasonableness Matrix.
REASONABLENESS MATRIX ITEMS
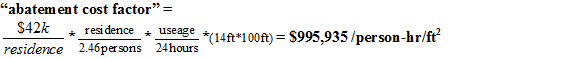
The Reasonableness Matrix asks the preparer to input site specific data into the worksheet and perform simple calculations that result in an "abatement cost factor" for the site that is compared to a criteria value. Abatement at the site is reasonable if the "abatement cost factor" is below $995,935 /person-hr/ft2 or $92,647 /person-hr/m2 otherwise it is deemed not reasonable. This abatement cost factor does not relate to the actual cost of constructing the barrier but is simply a number that normalizes the analysis, permitting comparisons.
Reasonableness Item #1:
| Item | Criteria | Input (English units) | Input (SI Units) |
|---|---|---|---|
| 1 | Enter length of proposed barrier | ft | m |
The user is instructed to enter the length of the proposed barrier in the space provided. The user can enter dimensions in either English or Metric units.
Reasonableness Item #2:
The user is instructed to enter the height of the proposed barrier in the space provided. The user can enter dimensions in either English or Metric units.
| Item | Criteria | Input (English units) | Input (SI Units) |
|---|---|---|---|
| 2 | Enter height of proposed barrier | ft | m |
Reasonableness Item #3:
| Item | Criteria | Input (English units) | Input (SI Units) |
|---|---|---|---|
| 3 | Multiply item 1 by item 2 | ft2 | m2 |
Multiply the input values from items 1 and 2 to determine the area of the proposed barrier.
Reasonableness Item #4:
| Item | Criteria | Input (English units) | Input (SI Units) |
|---|---|---|---|
| 4 | Enter the average amount of time that a person stays at the site per visit | hours | hours |
This item is the first of two items that determine the amount of use that a site receives. Enter the average time that a typical person would stay on site. The examples that follow give some estimates of average time that people may spend at certain sites.
Reasonableness Item #5:
| Item | Criteria | Input (English units) | Input(SI Units) |
|---|---|---|---|
| 5 | Enter the average number of people that use this site per day that will receive at least 5 dB(A) benefit from abatement at the site | people | people |
This item can be evaluated in two different ways. An exact number of "benefited" receivers can be determined if the user has detailed information about the locations of frequent human use and the number of people that typically use these areas. An approximate number of "benefited" receivers can be made if little information is known about the site and the population density of the site. This approximate method is discussed in detail in the section of this report entitled "Receiver Placement for Noise Impact Analysis" and is summarized below.
Approximate Method of Benefited Receiver Determination. Assume usage of the site is evenly distributed. As such, that portion of the site receiving more than 5 dB(A) insertion loss is protected and that fraction of people receiving protection is equal to percent of land protected. With that assumption we can determine the number of benefited receivers to be:
Benefited Receivers = PLP * ADP (3)
where:
PLP = fraction of total land area protected [5 dB(A) IL or more]
ADP = average daily persons using the area
The percent of land use is derived by evaluation of the receiver grid such as that shown in Figure 10. A more exact method is presented next.
More Exact Method of Benefited Receiver Determination. The percentage of land protected, that is receiving 5 dB(A) or more of insertion loss, is determined from the receiver grid evaluation shown in Figure 10. A more exact number of benefited receivers can be determined if the amount of people that use the protected areas is known. The number of benefited receivers can then be determined by summing the number of people per day that use the protected areas of the special land use site.
This number of benefited receivers, whether by exact location or fraction of total land protected and average daily persons using the site, is then used for item 5 of the Reasonableness Matrix.
Reasonableness Item #6:
| Item | Criteria | Input (English units) | Input (SI Units) |
|---|---|---|---|
| 6 | Multiply item 4 by item 5 | person-hr | person-hr |
Multiplying items 4 and 5 together produces the daily person hours of use that site receives.
Reasonableness Item #7:
Dividing item 3 by item 6 produces the barrier size per
| Item | Criteria | Input (English units) | Input (SI Units) |
|---|---|---|---|
| 7 | Divide item 3 by item 6 | ft2 /person-hr | m2 /person-hr |
hours of site usage value which will be used to compute the "abatement cost factor" for this site.
Reasonableness Item #8:
| Item | Criteria | Input English units) | Input (SI Units) |
|---|---|---|---|
| 8 | Multiply $42,000 by item 7 | $/person-hr/ft2 | $/person-hr/m2 |
Multiply item 7, which is either ft2/hr or m2/hr, by $42,000 and this produces the "abatement cost factor" for the site. All that is left now is to compare this value to the Reasonableness criteria value.
Reasonableness Item #9:
| Item | Criteria | Input (English units) | Input (SI Units) |
|---|---|---|---|
| 9 | Does item 8 exceed the "abatement cost factor" of: English units = $995,935 /person-hr/ft2? or SI units = $92,647 /person-hr/m2 ? |
This step compares the derived "abatement cost factor" for the site to the "criteria abatement cost factor" used to determine reasonableness. The user should enter a "yes" or "no" answer in the appropriate input column which depends on the system of units. Recall the equation for the criteria barrier "cost factor" and the derivation in English units:
Reasonableness Item #10 and #11:
| Item | Criteria | Input (English units) | Input (SI Units) |
|---|---|---|---|
| 10 | If item 9 is no, abatement is reasonable | ||
| 11 | If item 9 is yes, abatement is not reasonable |
These items determine if abatement is reasonable by the answer to item 9 which asked if the derived "abatement cost factor" was greater than the "criteria abatement cost factor".
Church Example
Consider a church site similar to that found in Figure 7. Peak traffic data for the roadway is 1000 vehicles per hour. The primary use of the church occurs at from 9 am - noon on Sunday. Application of the Traffic Volume Adjustment Factor for this site is as follows:
| Traffic Volume | = peak volume * adjustment factor= 1000 vehicles/hr * 0.32 - 320 vehicles per hour |
dB offset | = 10 * log(0.32) = -4.9 dB(A) |
This example could also have followed the Feasibility Flowchart and subtracted 2 dB(A) from the predicted receiver levels depending on data availability. The calculation shown above confirms that 2 dB(A) is a conservative value for weekend use.
A traffic volume of 320 vehicles per hour would now be used to predict existing noise levels if the preparer chose to use actual traffic volume instead of the dB offset. Future traffic volume would also be estimated in this manner.
Examples of the use of the "abatement cost factor" follow.
Park Example
Consider a park similar to the one described in Figure 5. We wish to determine the "abatement cost factor" to complete Reasonableness Matrix. The following data are known about the park and the proposed barrier and are used as input to the "abatement cost factor" Equation (2).
Input Parameters:
Notice that the number of benefited receivers differs from the number of people that visit the park. This value is determined from the noise impact analysis where a grid of receivers is used to determine the percentage of area receiving at least 5 dB(A) insertion loss from the proposed barrier. See the section on "Receiver Placement for Noise Impact Analysis" for more guidance.
Now we shall enter the required parameters in the Reasonableness Matrix shown in Figure 11.
Figure 11. Reasonableness Matrix for Park Example
| Item | Criteria | Input (English units) | Input (SI Units) |
|---|---|---|---|
| 1 | Enter length of proposed barrier | 600ft | m |
| 2 | Enter height of proposed barrier | 14ft | m |
| 3 | Multiply item 1 by item 2 | 8400ft2 | m2 |
| 4 | Enter the average amount of tune that a person stays at the site per visit | 2.0 hours | hours |
| 5 | Enter the average number of people that use this site per day that will receive at least 5 dB(A) benefit from abatement at the site | 179 people | people |
| 6 | Multiply item 4 by item 5 | 358 people-hr | people-hr |
| 7 | Divide item 3 by item 6 | 23.5 ft2/people-hr | m2/people-hr |
| 8 | Multiply $42,000 by item 7 | 987,000 $/people-hr/ft2 | $/people-hr/m2 |
| 9 | Does item 8 exceed the "abatement cost factor" of: English units = $995,935/person-hr/ft2? or SI units = $92,647/person-hr/m2? | NO | |
| 10 | If item 9 is no, abatement is reasonable |  | |
| 11 | If item 9 is yes, abatement is not reasonable |
The Reasonableness Matrix analysis indicates that abatement for this site is reasonable.
Church Example
Consider the church site of Figure 7. We wish to determine the "abatement cost factor" to complete the Reasonableness Matrix. The following data are known about the church and the proposed barrier and are used as input to the "abatement cost factor" equation.
Input Parameters:
Now we enter the required parameters in the Reasonableness Matrix shown below.
Figure 12. Reasonableness Matrix for Church Example
| Item | Criteria | Input (English units) | Input (SI Units) |
|---|---|---|---|
| 1 | Enter length of proposed barrier | 1000ft | m |
| 2 | Enter height of proposed barrier | 13ft | m |
| 3 | Multiply item 1 by item 2 | 13,000ft2 | m2 |
| 4 | Enter the average amount of tune that a person stays at the site per visit | 2.0 hours | hours |
| 5 | Enter the average number of people that use this site per day that will receive at least 5 dB(A) benefit from abatement at the site | 36 people | people |
| 6 | Multiply item 4 by item 5 | 72 people-hr | people-hr |
| 7 | Divide item 3 by item 6 | 181 ft2/people-hr | m2/people-hr |
| 8 | Multiply $42,000 by item 7 | 7,602,000 $/people-hr/ft2 | $/people-hr/m2 |
| 9 | Does item 8 exceed the "abatement cost factor" of: English units = $995,935/person-hr/ft2? or SI units = $92,647/person-hr/m2? | YES | |
| 10 | If item 9 is no, abatement is reasonable | ||
| 11 | If item 9 is yes, abatement is not reasonable | |
The Reasonableness Matrix analysis indicates that abatement for the church site is NOT reasonable.
School Example
Consider the school site shown in Figure 4. We wish to determine the "abatement cost factor" to complete the Reasonableness Matrix. The following data are known about the school and the proposed barrier and are used as input to the "abatement cost factor" equation.
Input Parameters:
Now we enter the required parameters in the Reasonableness Matrix shown below.
Figure 13. Reasonableness Matrix for School Example
| Item | Criteria | Input (English units) | Input(SI Units) |
|---|---|---|---|
| 1 | Enter length of proposed barrier | 1000ft | m |
| 2 | Enter height of proposed barrier | 13ft | m |
| 3 | Multiply item 1 by item 2 | 13,000ft2 | m2 |
| 4 | Enter the average amount of tune that a person stays at the site per visit | 1.0 hours | hours |
| 5 | Enter the average number of people that use this site per day that will receive at least 5 dB(A) benefit from abatement at the site | 43 people | people |
| 6 | Multiply item 4 by item 5 | 43 people-hr | people-hr |
| 7 | Divide item 3 by item 6 | 302 ft2/people-hr | m2/people-hr |
| 8 | Multiply $42,000 by item 7 | 12,684,000 $/people-hr/ft2 | $/people-hr/m2 |
| 9 | Does item 8 exceed the "abatement cost factor" of: English units = $995,935/person-hr/ft2? or SI units = $92,647/person-hr/m2? | YES | |
| 10 | If item 9 is no, abatement is reasonable | ||
| 11 | If item 9 is yes, abatement is not reasonable | |
The Reasonableness Matrix analysis indicates that abatement for the school site is NOT reasonable
1Florida Department of Transportation Project Development and Environment Manual, Part 2, Chapter 17.
2Supporting data for off peak traffic volume found in "An Analysis of Urban Area Travel by Time of Day", January 1972, FH-11-7519.

