Air Quality Contacts
For more information, please contact [Not Specified].
The research detailed in this document centers on the development of estimates of the cost-effectiveness of a range of representative project types funded under the Congestion Mitigation and Air Quality (CMAQ) Improvement Program. The estimates were generated to satisfy Title 23, Chapter 1, Section 149 of the United States Code, which mandates illustrative estimates of the cost-effectiveness of projects receiving CMAQ funding. The estimates were also generated for consistency with the Moving Ahead for Progress in the 21st Century Act (MAP-21, Public Law 112-141), which included changes in both project priorities and project eligibility under the CMAQ Program. Complete details on project eligibility within the CMAQ Program are described in CMAQ Guidance: November 2013 CMAQ Interim Program Guidance.
The central language of relevance to this study of MAP-21, 23 U.S.C. Sec. 149, (i), follows:
(2) COST EFFECTIVENESS.
(A) IN GENERAL. The Secretary, in consultation with the Administrator of the Environmental Protection Agency, shall evaluate projects on a periodic basis and develop a table or other similar medium that illustrates the cost effectiveness of a range of project types eligible for funding under this section as to how the projects mitigate congestion and improve air quality.
(B) CONTENTS. The table described in subparagraph (A) shall show measures of cost-effectiveness, such as dollars per ton of emissions reduced, and assess those measures over a variety of timeframes to capture impacts on the planning timeframes outlined in section 134.
(C) USE OF TABLE. States and metropolitan planning organizations shall consider the information in the table when selecting projects or developing performance plans under subsection (l).
The legislative language is somewhat vague in terms of specific requirements, but it is reasonable to expect that the cost-effectiveness tables should achieve the following objectives:
Key limitations of the analysis are listed below:
The most significant information developed within this research is the specification of separate cost-effectiveness estimates for each criteria pollutant and applicable precursor under the CMAQ program, including (listed in order of appearance in the summary tables at the end of this chapter):
Previous research focused on a smaller subset of pollutants (chiefly VOCs and NOx), and also tended to combine estimated emission impacts of projects into a composite measure (e.g., tons of VOC equivalents). This research focuses on individual estimates of cost-effectiveness by pollutant to avoid combining impacts on multiple pollutants. For example, a composite measure of cost-effectiveness for a project that has strong impacts on VOCs but minimal impacts on PM2.5 may indicate high cost-effectiveness in reducing pollutants overall, despite being weakly cost-effective in reducing PM2.5.
This research utilizes EPA s MOVES2010b (Motor Vehicle Emission Simulator 2010, Version B) model to identify emission impacts by criteria pollutant. In this research, estimates of project-level impacts (e.g., VMT impacts, travel speeds) were combined with unit (e.g., per-mile, per-hour) emission rates from MOVES2010b to yield estimated emission impacts in lieu of using either direct estimates from projects or older emission models like MOBILE6.2.
The analytical work in this study was substantially complete when a new version of MOVES (MOVES2014) was released. Related research was conducted to verify the empirical impacts of the use of MOVES2014 relative to MOVES2010b (e.g., changes in emission rates for a given type of analytical run), after which it was decided to continue with the use of MOVES2010b for this study, rather than replicate the range of completed analytical runs in MOVES2014. It would be appropriate to apply the most recent version of MOVES in any updates to this research, rather than continuing to use estimates from MOVES2010b.
The version of MOVES used in this report does not include the effects of the latest emissions standards for motor vehicles. In particular, MOVES2010b does not include Tier 3 standards that impact model year 2017 and later heavy-duty vehicles, heavy-duty greenhouse gas rules for model year 2014-2018 vehicles, and light-duty greenhouse gas rules for model year 2017-2025 vehicles. As a result, some emissions from the vehicle fleet and the cost-effectiveness of reducing those emissions, especially for projects that have long lifetimes, may be biased upwards.
The Use of MOVES2010b section in Chapter Two outlines the approach taken to incorporate emission data from MOVES2010b within the development of the pollutant-specific cost-effectiveness impacts presented in this document.
The analytical process in this research is based on a range of assumptions that were adopted either out of necessity or for consistency with transportation and environmental policy. Central assumptions for the analysis are listed below:
These assumptions are detailed in the Use of MOVES2010b section in Chapter Two.
The range of analytical scenarios is intended to cover neither the full range of potential outcomes within a project type, nor the full range of potential projects. The analysis centers on a snapshot of data, which limits the scope of inference that can be drawn. Difficulties in identifying representative project examples for some project types limited the range of potential projects included in the analysis, and the range of project types was further constrained through the relative maturity of some project types (i.e., some project types that have been included in previous analyses are no longer funded commonly within CMAQ). Hence, the range of project types included in the analysis is targeted at representing an informative view of the relative performance of predominant (and potentially predominant) project types across the range of pollutants in the study, rather than serving as a census of all projects eligible for CMAQ funding.
The November 2013 CMAQ Interim Program Guidance identifies the eligibility of 17 types of projects under Map-21. Following consultation with stakeholders and a review of relevant content in MAP-21, the range of project types represented in the summary of CMAQ funding was supplemented with additional project types in the analysis, including:
The selection of project types in the analysis was conducted following a review of CMAQ funded projects and consultation with USDOT, EPA and state-level stakeholders. A summary of CMAQ funded projects is useful in gaining an understanding of the prevalence of various project types. According to the CMAQ Public Access System, in 2013 (the most recent fiscal year for which data was available at the time of the analysis), 2023 projects received CMAQ funding; additional funding was applied to joint Surface Transportation Program (STP) and CMAQ projects with different eligibility criteria (around 14 percent of the total). Around 40 percent of the CMAQ projects receiving funding involved traffic flow improvements; bicycle and pedestrian projects represented the next largest group, at 19 percent, followed by transit projects, at nine percent.
In terms of shares of overall CMAQ obligations in FY2013, traffic flow improvements and transit projects received the largest, and approximately equal, shares, at 36 percent and 33 percent respectively. The remaining project types received similar shares of total CMAQ funding, including around four percent for traffic control measures and travel demand management projects, around five percent for shared ride projects, and around seven percent for pedestrian and bicycle projects.
This information provides a meaningful background to help gauge the relative prominence of project types within CMAQ. In particular, traffic flow improvements and transit projects are focal project types when comparing CMAQ project approvals and funding shares. While the analysis in this study is not restricted to a distribution of projects consistent with the funding summary above, the information underscores areas of key activity within the CMAQ program. This is valuable in terms of ensuring both meaningful coverage of projects within the analysis, and effective interpretation of analytical results by including a focus on the relative cost-effectiveness of high-profile project types.
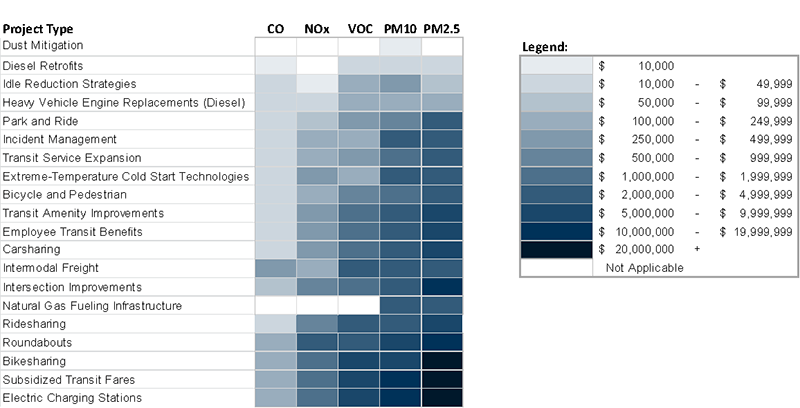
This section presents a summary of findings from the cost-effectiveness analysis. Cost-effectiveness estimates for individual pollutants are then presented in the following section: SUMMARY COST-EFFECTIVENESS ESTIMATES. Figure 1 below offers a comparison of the median cost-effectiveness estimates for each project type and pollutant in the analysis:
Figure 1. Median Cost-Effectiveness Estimates
| Project Type | CO | NOx | VOC | PM10 | PM2.5 |
|---|---|---|---|---|---|
| Dust Mitigation | N/A | N/A | N/A | 1 | N/A |
| Diesel Retrofits | 1 | N/A | 2 | 2 | 2 |
| Idle Reduction Strategies | 2 | 1 | 4 | 5 | 3 |
| Heavy Vehicle Engine Replacements (Diesel) | 2 | 2 | 4 | 4 | 4 |
| Park and Ride | 2 | 3 | 5 | 6 | 8 |
| Incident Management | 2 | 4 | 4 | 8 | 8 |
| Transit Service Expansion | 2 | 4 | 5 | 7 | 8 |
| Extreme-Temperature Cold Start Technologies | 2 | 5 | 4 | 8 | 8 |
| Bicycle and Pedestrian | 2 | 4 | 6 | 7 | 8 |
| Transit Amenity Improvements | 2 | 5 | 7 | 8 | 9 |
| Employee Transit Benefits | 2 | 5 | 7 | 8 | 9 |
| Carsharing | 2 | 5 | 7 | 8 | 9 |
| Intermodal Freight | 5 | 4 | 8 | 8 | 8 |
| Intersection Improvements | 3 | 6 | 7 | 8 | 10 |
| Natural Gas Fueling Infrastructure | N/A | N/A | N/A | 8 | 8 |
| Ridesharing | 2 | 6 | 8 | 8 | 9 |
| Roundabouts | 4 | 8 | 8 | 9 | 10 |
| Bikesharing | 4 | 7 | 9 | 9 | 11 |
| Subsidized Transit Fares | 4 | 7 | 9 | 10 | 11 |
| Electric Charging Stations | 4 | 7 | 9 | 10 | 11 |
| 1 | $10,000 | or Less | |
|---|---|---|---|
| 2 | $10,000 | - | $49,999 |
| 3 | $50,000 | - | $99,999 |
| 4 | $100,000 | - | $249,999 |
| 5 | $250,000 | - | $499,999 |
| 6 | $500,000 | - | $999,999 |
| 7 | $1,000,000 | - | $1,999,999 |
| 8 | $2,000,000 | - | $4,999,999 |
| 9 | $5,000,000 | - | $9,999,999 |
| 10 | $10,000,000 | - | $19,999,999 |
| 11 | $20,000,000 | + | |
| N/A | Not Applicable | ||
(Dollars per Ton of Pollutant Reduced).
The analysis yielded a broad range of cost-effectiveness estimates, represented in terms of dollars per ton of pollutant reduced. The most critical findings relate to project types that indicate particularly strong or weak cost-effectiveness, for either individual pollutants or across the range of pollutants.
Table 1 summarizes the best-performing project types by pollutant, based upon the distributions of cost-effectiveness measures evaluated at the median:
| Project Type | Pollutants with Most Cost-Effective Reduction |
|---|---|
| Idle Reduction Strategies | All pollutants |
| Heavy-Duty Vehicle Engine Replacements | NOx, VOCs, PM10, PM2.5 |
| Diesel Retrofits (DOCs, DPFs) | CO, PM10, PM2.5 and VOCs |
| Transit Service Expansion | NOx, VOCs, CO |
| Park and Ride | NOx, VOCs, CO |
| Extreme-Temperature Cold Start | CO and VOCs |
| Incident Management | CO and VOCs |
| Intermodal Freight | NOx |
| Dust Mitigation | PM10 |
The relative performance of project types can be observed by comparing shading in Figure 1 above (lighter shades indicate stronger cost-effectiveness). The analysis indicated that idle reduction projects can be as cost-effective as diesel retrofits for CO, PM2.5 and PM10 emission reduction. Idle reduction also demonstrated strong cost-effectiveness for reducing NOx and VOC emissions.
Diesel retrofits demonstrated strong cost-effectiveness for CO, PM2.5 and PM10. That is, diesel retrofits were estimated to be highly cost-effective at reducing each pollutant that retrofits are capable of affecting, as per EPA s verified technologies list. Heavy-duty vehicle diesel engine replacements demonstrated strong cost-effectiveness for all pollutants in the study with the exception of CO, which indicated moderate cost-effectiveness.
Transit service expansion and park and ride projects appeared to provide strong cost-effectiveness in reducing CO, NOx and VOC emissions. In addition, transit service expansion demonstrated moderate cost-effectiveness with respect to PM2.5 and PM10, while park and ride projects demonstrated moderate cost-effectiveness with respect to PM10.
Extreme-temperature cold start technologies are limited in applicability (i.e., to areas with unusually cold winter weather), but revealed strong cost-effectiveness with respect to CO and VOCs. Furthermore, these projects appeared competitive with respect to cost-effective mitigation of NOx, PM2.5 and PM10.
Similarly, incident management projects demonstrated strong cost-effectiveness for VOCs and CO. Incident management projects were near the middle of the range of project types for other pollutants.
Intermodal freight projects revealed strong cost-effectiveness with respect to NOx. Dust mitigation projects were clearly the most cost-effective alternative for reducing PM10, which is the only pollutant that these projects are expected to affect. This relationship held for both street sweeping and dirt road paving projects, the two types of dust mitigation projects evaluated in the analysis. Similar to extreme-temperature cold start technologies, there may be limitations in the circumstances toward which dust mitigation projects apply.
Conversely, several project types demonstrated overall weak cost-effectiveness across the pollutants in the study. These project types include:
These project types are note presented in table format as in Table 1, because these project types were estimated to have the weakest cost-effectiveness for all project types. Roundabouts did not demonstrate strong cost-effectiveness for any of the pollutants in the study. Consequently, roundabouts generally performed less effectively than other intersection improvements.
Bikesharing did not demonstrate strong cost-effectiveness for any pollutant in the study. This was driven chiefly by a relatively small impact on VMT compared to the costs of implementing bikesharing projects. That is, while bikesharing projects are capable of leading to mode shift from light-duty vehicle to bicycle, the types of trips likely to be influenced involve relatively short distances or low frequencies of use.
Electric vehicle charging infrastructure tended to be one of the least cost-effective project types in the study for all pollutants in the study. It is worth noting that this could change if electric vehicle use increases in future years.
Subsidized transit fares are also among the least cost-effective projects. This result is limited by the available estimates of marginal operating costs per passenger mile to assign to these projects; transit services with the capability of assigning low marginal costs to passengers receiving subsidized fares (e.g., services with high demand) may be able to achieve stronger cost-effectiveness in emission reduction associated with light-duty vehicle travel.
The remaining project types demonstrated competitive cost-effectiveness (i.e., near or above the middle of the pack) for at least some pollutants in the study. Carsharing demonstrated competitive (i.e., relative to the entire range of project types) cost-effectiveness with respect to NOx mitigation. Carsharing was less cost-effective in reducing CO and VOC emissions, and weakly cost-effective with respect to PM2.5 and PM10.
Transit amenity improvements demonstrated competitive cost-effectiveness with respect to NOx and VOC mitigation. These projects appeared to be less cost-effective in reducing CO and PM10 emissions, and were weakly cost-effective with respect to PM2.5.
Intersection improvements demonstrated competitive cost-effectiveness with respect to CO and VOC mitigation. These projects appeared to be less cost-effective in reducing NOx, PM2.5 and PM10 emissions.
Bicycle and pedestrian facilities demonstrated cost-effectiveness at or above the middle of the range of project types for all pollutants. Employee transit benefits demonstrated cost-effectiveness near the middle of the range of project types for all pollutants, but below bicycle and pedestrian facilities for all pollutants.
Ridesharing projects generally demonstrated cost-effectiveness at or below the middle of the range of project types for all pollutants. The strongest cost-effectiveness demonstrated by ridesharing projects relative to other project types was for PM2.5.
Lastly, natural gas fueling infrastructure demonstrated moderate cost-effectiveness with respect to PM2.5 and PM10 mitigation. These projects did not reveal measurable mitigation of CO or NOx. The estimated CO emission rates for natural gas vehicles are uniformly higher than corresponding CO emission rates for corresponding diesel vehicles, resulting in no beneficial CO impacts for projects involving the use of natural gas vehicles.
Similarly, the estimated NOx emission rates for new and late-model (i.e., model year 2010 or more recent) natural gas vehicles are higher than the corresponding emission rates for new and late-model diesel vehicles. Hence, the only natural gas fueling infrastructure projects that would result in reduced NOx emissions would be projects that specifically encouraged the switch from pre-2010 diesel vehicles to pre-2010 natural gas vehicles, which is not likely to be a representative project structure. Projects encouraging the switch from used diesel vehicles to new vehicles (diesel or natural gas) are likely to be more representative; in such cases, the switch to new diesel vehicles would reduce NOx emissions, but the switch to natural gas vehicles would increase NOx emissions either outright or relative to an available diesel alternative.
Data limitations did not allow for an analysis of the cost-effectiveness of natural gas fueling infrastructure projects with respect to VOCs. Specifically, MOVES2010b does not include calculations of VOC emission rates for natural gas vehicles, making it infeasible to identify the impacts of natural gas fueling infrastructure projects on VOC emissions.
The cost-effectiveness estimates in this section are presented in separate tables for each pollutant or the applicable precursors. Cost-effectiveness is defined in this study as the cost per short ton of pollutant reduced. This specification enables a simple scaled value that can be compared both within project type (and across project size), and across pollutants (and either within or across project types).
Full project costs are specified within the calculation of cost-effectiveness, rather than the subset of project costs covered by CMAQ funds within the projects analyzed. This approach was selected to generate a meaningful comparison of cost-effectiveness across project types, independent of the particular funding opportunities and constraints present in any given setting. It is important to note that some project costs may not include full lifetime project costs, if ongoing maintenance or operating costs are not included in the reported or estimated project cost. The results are presented in descending order of cost-effectiveness (i.e., in increasing order of dollars per ton of pollutant reduced).
The values in the tables center on the median estimates for each project type within the analysis. The primary advantages of using the median rather than the mean or best-case scenarios are that: (1) the median is not distorted by poorly-performing outliers; (2) the median offers an intuitive marker of a cost with equally as many high-cost effective as low-cost effective values for the same project type; (3) the median (among reasonable project proposals) is likely to be more representative within project types than an absolute best-case scenario; and (4) the median (among reasonable project proposals) is likely to be more comparable across project types than an absolute best-case scenario.
For comparison purposes, best-case (i.e., lowest cost per ton reduced) estimates are also presented for each project type. These estimates present insight into the range of outcomes that could be achieved for each project type, but are not likely to be representative of general cost-effectiveness.
This section is intended to serve as a quick reference within and across pollutants. Chapter Two offers detailed information about all project type analyses in the study, along with supplementary analytical results.
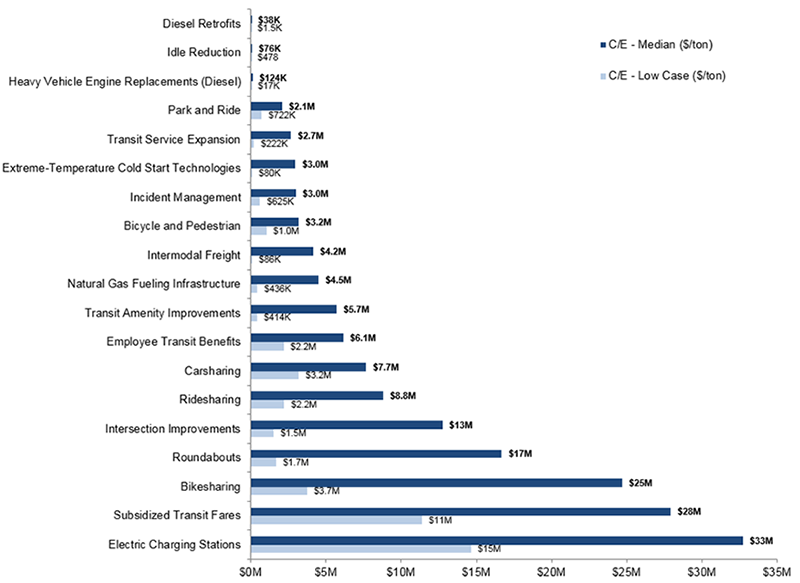
Emission control practices most cost-effective at controlling PM2.5 are diesel engine technology related projects. Diesel engine replacements and retrofits both address the inefficiencies of highly polluting older diesel vehicles while idle reduction curtails hoteling , in which heavy-duty diesel engines idle for extended periods. Median costs of these practices are all under $125,000 per ton of PM2.5 reduced.
The rest of the project types examined for this pollutant exhibited variable cost effectiveness efficiencies, ranging in cost from $2.1M to $33M for each ton of PM2.5 reduced. Park and ride facilities, transit service expansions, cold start technologies, incident management and bicycle-pedestrian projects all provided the next most cost effective performance in reducing PM2.5 emissions with median costs ranging from $2.1M to $3.0M per ton reduced. Other than the cold start technologies, the rest of the project types in this group address transportation mode selection and reduced VMT in order to achieve emission reductions.
Other project types exhibiting relatively high cost efficiencies in reducing fine particulate emissions were intermodal freight, natural gas refueling, improved transit amenities and employee transit benefits. These project types were split in their means to reduce PM2.5 emissions with intermodal and transit related projects altering vehicle selection, traveler behavior and modal choice, thus reducing VMT and resulting PM2.5 emissions. Natural gas refueling projects encourage the use of alternative fuel vehicles and thereby minimize particulate vehicle emissions. These projects achieved a median cost effectiveness of between $4.5M and $6.1M per ton of emissions reduced.
Additional project types performed less efficiently in their ability to reduce fine particulate emissions either due to their high cost of implementation, such as roadway construction type projects, or their relatively low impact on VMT reduction. Electric charging stations were the least cost effective at reducing PM2.5 emissions, but this is likely due to the relatively small number of electric vehicles currently operating in the fleet and the vehicles they replace are mostly gasoline vehicles with low PM2.5 emissions. We assume that as the number of electric vehicles increases that this type of project will become more cost effective in its ability to reduce PM2.5 emissions in the future.
Figure 2. Median Cost-Effectiveness Estimates (Cost per Ton Reduced) of PM2.5 Emission Reductions.
| Project Type | C/E - Low Case ($/ton) | C/E - Median ($/ton) |
|---|---|---|
| Electric Charging Stations | $15M | $33M |
| Subsidized Transit Fares | $11M | $28M |
| Bikesharing | $3.7M | $25M |
| Roundabouts | $1.7M | $17M |
| Intersection Improvements | $1.5M | $13M |
| Ridesharing | $2.2M | $8.8M |
| Carsharing | $3.2M | $7.7M |
| Employee Transit Benefits | $2.2M | $6.1M |
| Transit Amenity Improvements | $414K | $5.7M |
| Natural Gas Fueling Infrastructure | $436K | $4.5M |
| Intermodal Freight | $86K | $4.2M |
| Bicycle and Pedestrian | $1.0M | $3.2M |
| Incident Management | $625K | $3.0M |
| Extreme-Temperature Cold Start Technologies | $80K | $3.0M |
| Transit Service Expansion | $222K | $2.7M |
| Park and Ride | $722K | $2.1M |
| Heavy Vehicle Engine Replacements (Diesel) | $17K | $124K |
| Idle Reduction | $478 | $76K |
| Diesel Retrofits | $2K | $38K |
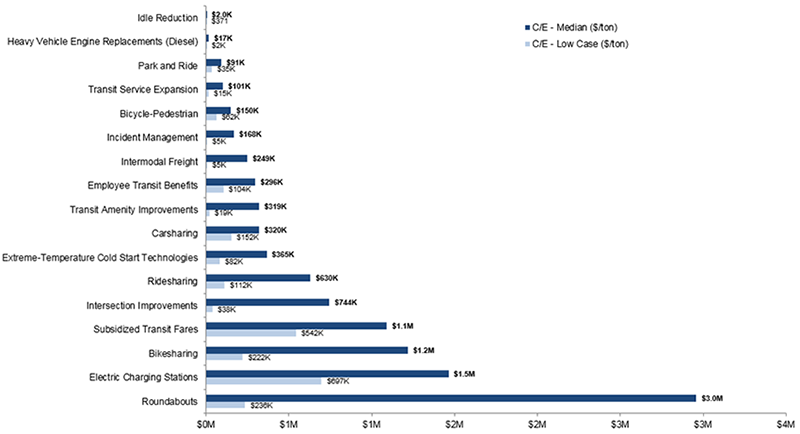
Emission control practices most cost-effective at controlling NOx are diesel engine technology related projects. Idle reduction strategies curtail hoteling, while heavy-duty vehicle diesel engine replacements address the inefficiencies of highly polluting older diesel vehicles. Median costs of these practices are all under $20,000 per ton of NOx reduced.
Park and ride, transit service expansion, bicycle-pedestrian and incident management projects also exhibited high cost-effectiveness in reducing NOx emissions. With the exception of incident management, these projects reduce NOx emissions by encouraging modal shift, thus reducing VMT in order to achieve emission reductions. Incident management projects reduce NOx emissions by reducing vehicle delay during periods of high congestion, in turn reducing per-mile NOx emissions. These projects achieved a median cost effectiveness of between $91,000 and $168,000 per ton of emissions reduced.
Intermodal freight, employee transit benefits, transit amenity improvements, carsharing, extreme-temperature cold start technologies and ridesharing all provided the next most cost effective performance in reducing NOx emissions, with median costs ranging from $249,000 to $367,000 per ton reduced. Other than the cold start technologies, the rest of the project types in this group address transportation mode selection and reduced VMT in order to achieve emission reductions.
Project types exhibiting relatively low cost efficiencies in reducing NOx emissions were intersection improvements, subsidized transit fares, bikesharing, electric vehicle charging stations and roundabouts. Intersection improvements and roundabouts reduce NOx emissions by reducing vehicle delay and associated per-mile emission rates. Subsidized transit fares, bikesharing and electric vehicle charging encourage shifts either between modes or types of private vehicle, reducing VMT in the case of modal shift and reducing per-mile emission rates in the case of electric vehicles. These projects achieved a median cost effectiveness of between $744,000 and $3M per ton of emissions reduced.
Diesel retrofits are not included in the analysis of NOx, because the diesel retrofit technologies analyzed in this report (diesel oxidation catalysts (DOCs) and diesel particulate filters (DPFs)) do not impact NOx emissions. Natural gas fueling infrastructure projects are also not included in the analysis of NOx, because these projects would be expected to stimulate increases in NOx emissions. This relationship arises because new and late-model natural gas vehicles have higher NOx emission rates than corresponding new and late-model diesel vehicles.
| Project Type | C/E - Low Case ($/ton) | C/E - Median ($/ton) |
|---|---|---|
| Roundabouts | $236K | $3.0M |
| Electric Charging Stations | $697K | $1.5M |
| Bikesharing | $222K | $1.2M |
| Subsidized Transit Fares | $542K | $1.1M |
| Intersection Improvements | $38K | $744K |
| Ridesharing | $112K | $630K |
| Extreme-Temperature Cold Start Technologies | $82K | $365K |
| Carsharing | $152K | $320K |
| Transit Amenity Improvements | $19K | $319K |
| Employee Transit Benefits | $104K | $296K |
| Intermodal Freight | $5K | $249K |
| Incident Management | $5K | $168K |
| Bicycle-Pedestrian | $62K | $150K |
| Transit Service Expansion | $15K | $101K |
| Park and Ride | $35K | $91K |
| Heavy Vehicle Engine Replacements (Diesel) | $2K | $17K |
| Idle Reduction | $371 | $2.0K |
Figure 3. Median Cost-Effectiveness Estimates (Cost per Ton Reduced) of NOx Emission Reductions.
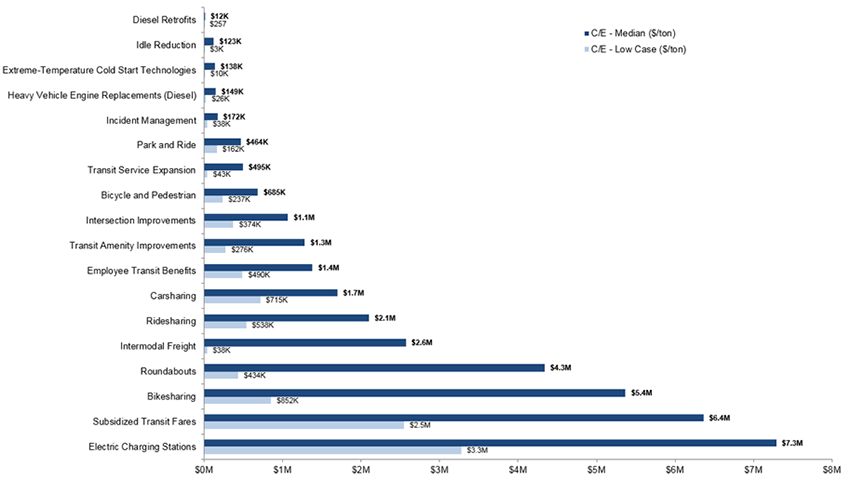
Emission control practices most cost-effective at controlling VOC are diesel engine technology related projects, extreme-temperature cold start technologies and incident management projects. Diesel retrofits and heavy-duty vehicle diesel engine replacements address the inefficiencies of highly polluting older diesel vehicles. Idle reduction strategies curtail hoteling. Extreme-temperature cold start technologies address the inefficiencies of starting vehicles under unusually low levels of ambient temperature. Incident management projects reduce VOC emissions by reducing vehicle delay during periods of high congestion, in turn reducing associated per-mile VOC emission rates. Median costs of these practices are all under $175,000 per ton of VOC reduced.
Park and ride, transit service expansion, and bicycle-pedestrian projects also exhibited high cost-effectiveness in reducing VOC emissions. These projects reduce VOC emissions by encouraging modal shift, thus reducing VMT in order to achieve emission reductions. These projects achieved a median cost effectiveness of between $464,000 and $685,000 per ton of emissions reduced.
Intersection improvements, transit amenity improvements, employee transit benefits and carsharing all provided the next most cost effective performance in reducing VOC emissions, with median costs ranging from $1.1M to $1.7M per ton reduced. Intersection improvements reduce VOC emissions by reducing vehicle delay and associated per-mile VOC emission rates. The rest of the project types in this group address transportation mode selection and reduce VMT in order to achieve emission reductions.
Project types exhibiting relatively low cost efficiencies in reducing VOC emissions were ridesharing, intermodal freight, roundabouts, bikesharing, subsidized transit fares and electric vehicle charging stations. Ridesharing, intermodal freight, bikesharing, subsidized transit fares and electric vehicle charging stations encourage shifts either between modes or types of private vehicle, reducing VMT in the case of modal shift and reducing per-mile emission rates in the case of electric vehicles. Roundabouts reduce VOC emissions by reducing vehicle delay and associated per-mile emission rates. These projects achieved a median cost effectiveness of between $2.1M and $7.3M per ton of emissions reduced.
The analysis was unable to identify impacts of natural gas fueling infrastructure projects on VOC emissions, because MOVES2010b does not calculate emission rates for natural gas vehicles.
| Project Type | C/E - Low Case ($/ton) | C/E - Median ($/ton) |
|---|---|---|
| Electric Charging Stations | $3.3M | $7.3M |
| Subsidized Transit Fares | $2.5M | $6.4M |
| Bikesharing | $852K | $5.4M |
| Roundabouts | $434K | $4.3M |
| Intermodal Freight | $38K | $2.6M |
| Ridesharing | $538K | $2.1M |
| Carsharing | $715K | $1.7M |
| Employee Transit Benefits | $490K | $1.4M |
| Transit Amenity Improvements | $276K | $1.3M |
| Intersection Improvements | $374K | $1.1M |
| Bicycle and Pedestrian | $237K | $685K |
| Transit Service Expansion | $43K | $495K |
| Park and Ride | $162K | $464K |
| Incident Management | $38K | $172K |
| Heavy Vehicle Engine Replacements (Diesel) | $26K | $149K |
| Extreme-Temperature Cold Start Technologies | $10K | $138K |
| Idle Reduction | $3K | $123K |
| Diesel Retrofits | $257 | $12K |
Figure 4. Median Cost-Effectiveness Estimates (Cost per Ton Reduced) of VOC Emission Reductions.
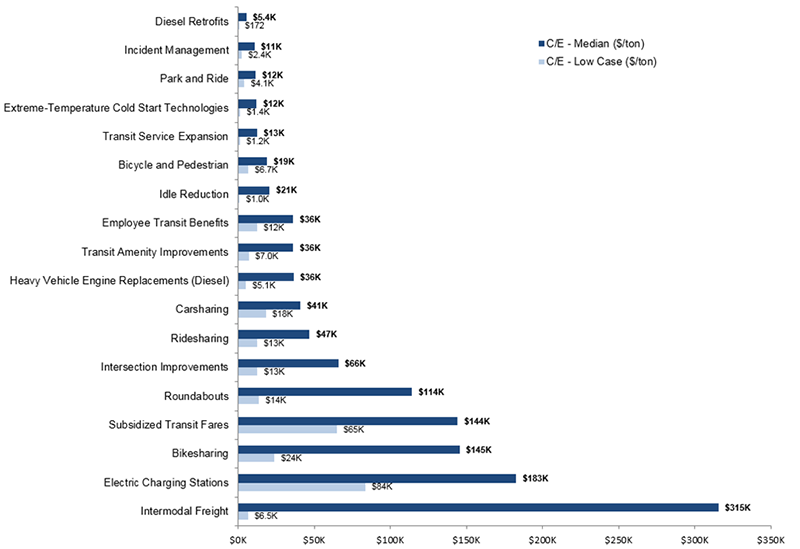
Emission control practices most cost-effective at controlling CO are diesel retrofits. Diesel retrofits address highly-polluting older diesel vehicles. Median costs of these practices are around $5,400 per ton of CO reduced. This result was identified based upon EPA estimates of the effectiveness of diesel retrofit technologies in reducing CO emissions, including EPA s Verified Technology List and Diesel Emissions Quantifier.
A broad group of projects also exhibited strong cost-effectiveness in reducing CO emissions. Incident management, park and ride, extreme-temperature cold start technologies, transit service expansion, heavy-duty vehicle diesel engine replacements, bicycle and pedestrian and idle reduction projects all had median costs between $11,000 and $21,000 per ton of CO reduced. These projects entail distinct mechanisms for reducing CO emissions. Incident management projects reduce vehicle delay during periods of high congestion, in turn reducing per-mile CO emission rates. Park and ride, transit service expansion and bicycle and pedestrian projects reduce CO emissions by encouraging modal shift, thus reducing VMT in order to achieve emission reductions. Extreme-temperature cold start technologies reduce CO emission rates during vehicle starts in cases of unusually low ambient heat. Heavy-duty vehicle diesel engine replacements address the inefficiencies of highly polluting older diesel vehicles, while idle reduction curtails heavy-duty diesel engine idling, one of the most polluting phases of diesel engine operation.
The next most cost-effective projects in reducing CO emissions include employee transit benefits, transit amenity improvements, carsharing, ridesharing and intersection improvements. With the exception of roundabouts, these projects center on modal shift and associated reductions in VMT. Intersection improvements reduce CO emissions by reducing vehicle delay and associated per-mile emission rates. The projects all exhibited median cost-effectiveness of between $36,000 and $66,000 per ton of CO reduced.
Project types exhibiting low cost efficiencies in reducing CO emissions were roundabouts, subsidized transit fares, bikesharing, electric vehicle charging stations and intermodal freight. Roundabouts reduce CO emissions by reducing vehicle delay and associated per-mile emission rates. Subsidized transit fares, bikesharing, electric vehicle charging and intermodal freight encourage shifts either between modes or types of vehicle (i.e., from gasoline- or diesel-powered vehicle to electric vehicle, or from truck to barge or rail), reducing VMT in the case of modal shift and reducing per-mile emission rates in the case of electric vehicles. These projects achieved a median cost effectiveness of between $114,000 and $315,000 per ton of CO emissions reduced.
| Project Type | C/E - Low Case ($/ton) | C/E - Median ($/ton) |
|---|---|---|
| Intermodal Freight | $6.5K | $315K |
| Electric Charging Stations | $84K | $183K |
| Bikesharing | $24K | $145K |
| Subsidized Transit Fares | $65K | $144K |
| Roundabouts | $14K | $114K |
| Intersection Improvements | $13K | $66K |
| Ridesharing | $13K | $47K |
| Carsharing | $18K | $41K |
| Heavy Vehicle Engine Replacements (Diesel) | $5.1K | $36K |
| Transit Amenity Improvements | $7.0K | $36K |
| Employee Transit Benefits | $12K | $36K |
| Idle Reduction | $1.0K | $21K |
| Bicycle and Pedestrian | $6.7K | $19K |
| Transit Service Expansion | $1.2K | $13K |
| Extreme-Temperature Cold Start Technologies | $1.4K | $12K |
| Park and Ride | $4.1K | $12K |
| Incident Management | $2.4K | $11K |
| Diesel Retrofits | $172 | $5.4K |
Figure 5. Median Cost-Effectiveness Estimates (Cost per Ton Reduced) of CO Emission Reductions.
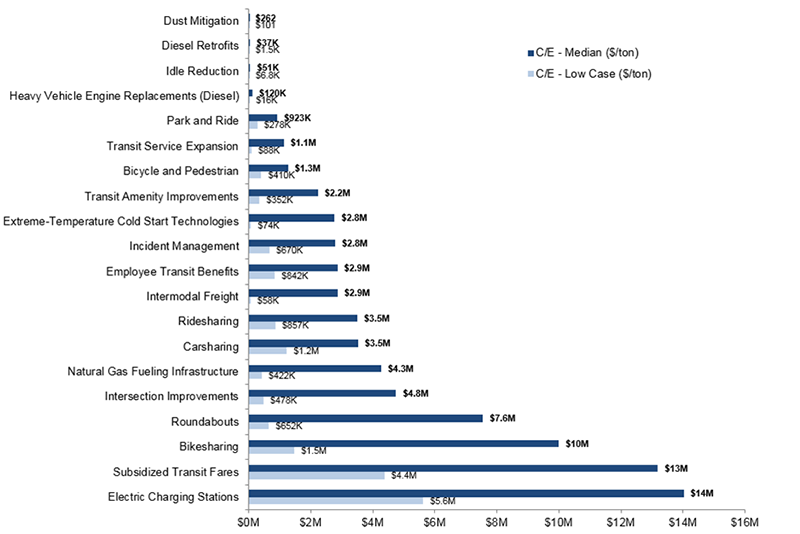
Emission control practices most cost-effective at controlling PM10 are dust mitigation projects, with an estimated median cost-effectiveness of under $300 per ton for PM10 emission reduction. Within the range of dust mitigation projects, street sweeping projects were the most cost-effective, followed by paving projects.
Diesel engine technology related projects are also very effective at reducing PM10. Diesel engine replacements and retrofits both address the inefficiencies of highly polluting older diesel vehicles. Median costs of these practices are under $125,000 per ton of PM10 reduced.
The rest of the project types examined for this pollutant exhibited variable cost effectiveness efficiencies, ranging in cost from $448,000 to $14M for each ton of PM10 reduced. Idle reduction strategies curtail heavy-duty diesel engine idling, one of the most polluting phases of diesel engine operation. Park and ride facilities, transit service expansions, and bicycle-pedestrian projects all provided the next most cost effective performance in reducing PM10 emissions with median costs ranging from $448,000 to $1.3M per ton of PM10 reduced. Each of these projects addresses transportation mode selection and reduces VMT in order to achieve emission reductions.
Other project types exhibiting relatively high cost efficiencies in reducing particulate emissions were: transit amenity improvements, extreme-temperature cold-start technologies, incident management, employee transit benefits, and intermodal freight, ranging in cost from $2.2M to $2.9M per ton of PM10 reduced. These project types were split in their means to reduce PM10 emissions with intermodal and transit related projects altering vehicle selection and traveler behavior modal choice, thus reducing VMT or emissions intensity and resulting PM10 emissions.
The next-most-effective group of projects in reducing PM10 emissions includes carsharing, ridesharing, natural gas fueling infrastructure and intersection improvements, ranging in cost from $3.5M to $4.8M per ton of PM10 reduced. Carsharing and ridesharing projects reduce VMT in order to achieve emission reductions. Natural gas refueling projects encourage the use of alternative fuel vehicles and thereby minimize particulate vehicle emissions.
Additional project types performed less efficiently in their ability to reduce particulate emissions either due to their high cost of implementation, such as roadway construction type projects, or their relatively low impact on VMT reduction. The median cost-effectiveness for intersection improvements, roundabouts, bikesharing, subsidized transit fares and electric vehicle charging stations was between $4.8M and $15M. Electric charging stations were the least cost effective at reducing PM10 emissions, but this is likely due to the relatively small number of electric vehicles currently operating in the fleet. We assume that as the number of electric vehicles increases that this type of project will become more cost effective in its ability to reduce PM10 emissions in the future.
| Project Type | C/E - Low Case ($/ton) | C/E - Median ($/ton) |
|---|---|---|
| Electric Charging Stations | $5.6M | $14M |
| Subsidized Transit Fares | $4.4M | $13M |
| Bikesharing | $1.5M | $10M |
| Roundabouts | $652K | $7.6M |
| Intersection Improvements | $478K | $4.8M |
| Natural Gas Fueling Infrastructure | $422K | $4.3M |
| Carsharing | $1.2M | $3.5M |
| Ridesharing | $857K | $3.5M |
| Intermodal Freight | $58K | $2.9M |
| Employee Transit Benefits | $842K | $2.9M |
| Incident Management | $670K | $2.8M |
| Extreme-Temperature Cold Start Technologies | $74K | $2.8M |
| Transit Amenity Improvements | $352K | $2.2M |
| Bicycle and Pedestrian | $410K | $1.3M |
| Transit Service Expansion | $88K | $1.1M |
| Park and Ride | $278K | $923K |
| Heavy Vehicle Engine Replacements (Diesel) | $16K | $120K |
| Idle Reduction | $6.8K | $51K |
| Diesel Retrofits | $1.5K | $37K |
| Dust Mitigation | $101 | $262 |
Figure 6 Chart. Median Cost-Effectiveness Estimates (Cost per Ton Reduced) of PM10 Emission Reductions.
Along with the analysis of emission impacts, this research also included an analysis of congestion impacts associated with the range of project types. Most project types had measurable impacts limited to emission reductions, and hence had no estimated congestion impacts. Three project types had measurable impacts on congestion: intersection improvements (e.g., left turn lanes, signalization improvements), roundabouts and incident management. The common factor across these project types is a focus on reducing delay.
Other project types most notably intermodal freight projects and large-scale transit projects may have significant congestion impacts in addition to emission reductions. However, the available project data did not specify congestion impacts. Hence, no congestion impact was estimated for these projects in the analysis. Future research could be designed to generate estimates of congestion impacts, through means such as travel demand models incorporating freight flows and broad modal shift from light-duty vehicle to transit.
Congestion impacts were estimated as reductions in vehicle-hours of delay generated by projects. For projects involving time at idle, congestion impacts were estimated as reductions in vehicle-hours at idle (e.g., time queuing to turn left, time queuing to pass through an intersection). For projects involving general improvements in throughput (e.g., signal coordination), congestion impacts were estimated as reductions in vehicle-hours spent passing through an affected corridor.
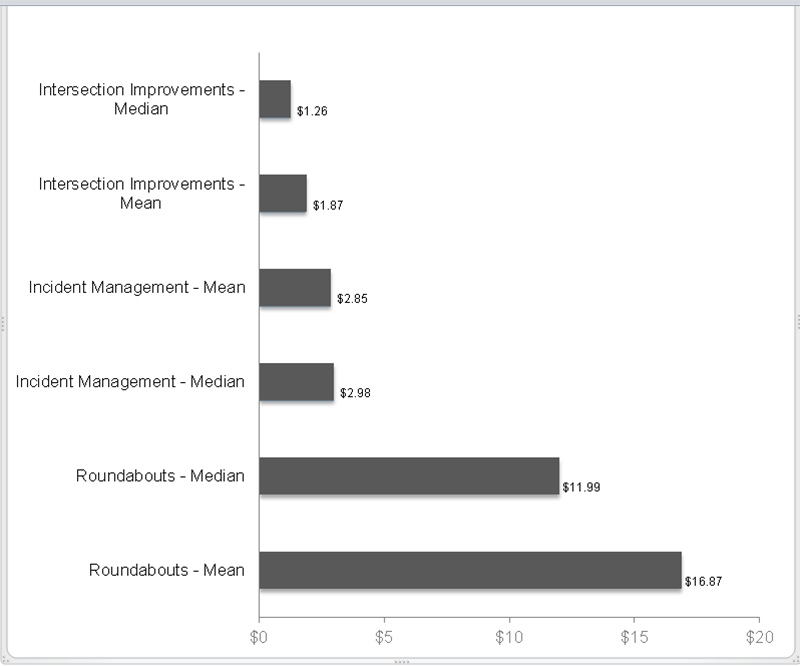
Cost-effectiveness in reducing congestion was estimated as project cost divided by project lifetime reductions in vehicle-hours of delay (i.e., dollars per each reduced vehicle-hours of delay). The median and mean congestion impacts for intersection improvements, roundabouts and incident management are presented in Figure 7:
| Intersection Improvements - Median | $1.26 |
|---|---|
| Intersection Improvements - Mean | $1.87 |
| Incident Management - Mean | $2.85 |
| Incident Management - Median | $2.98 |
| Roundabouts - Median | $11.99 |
| Roundabouts - Mean | $16.87 |
Figure 7. Median and Mean Cost-Effectiveness Estimates (Cost per Vehicle-Hour of Delay Reduced) of Congestion Reductions.
The median estimated costs per reduced vehicle-hour of delay for the three project types are all near (depending upon vehicle occupancy) or below the value of travel time savings specified in April 2015 USDOT guidance on the value of time (around $12.50 to $25 per hour, varying by trip purpose). Hence, each project type would be cost-beneficial (i.e., would generate a societal benefit of congestion reduction in excess of project costs) when focusing solely on congestion benefits. This benefit would be independent of benefits associated with emission reductions, and hence may be important to consider when comparing competing project alternatives.
Intersection improvements demonstrated the strongest cost-effectiveness in reducing delay, with median and mean costs below two dollars per reduced vehicle-hour of delay. Incident management projects were also strongly cost-effective in reducing delay, with median and mean costs below three dollars per reduced vehicle-hour of delay; for locations with significant levels of non-recurring congestion (e.g., areas prone to major bottlenecks due to accidents, areas with periodic special events causing major delay), incident management projects may be particularly cost-effective in reducing congestion. Roundabout projects, while yielding costs of reductions in vehicle-hours of delay below the USDOT-specified value of travel time savings, were estimated to be much less cost-effective than other intersection improvements and incident management projects in reducing congestion.