*Note: These chapters not avaialble online.
In 2002, the Sierra Club legally challenged the U.S. Department of Transportation (DOT) Federal Highway Administration (FHWA) and the Nevada Department of Transportation's (NDOT) National Environmental Policy Act (NEPA) environmental document related to the proposed widening of U.S. 95 in Las Vegas, Nevada, including the assessment of impacts of mobile source air toxics (MSATs) from the proposed project. FHWA entered into a Settlement Agreement with Nevada DOT and the Sierra Club, wherein the FHWA agreed to undertake a research effort to characterize the impact and behavior of particulate matter with aerodynamic diameter less than 2.5 microns (PM2.5) and MSATs near highways.1 The FHWA Administrator contacted all 50 States requesting that the States participate in this research study. Two States, Nevada and Michigan, volunteered to support a monitoring site while a number of other States provided funding for the project.
The FHWA and U.S. Environmental Protection Agency (U.S. EPA) determined that it would be in the best interest of both organizations to implement this project in a collaborative manner, allowing a more effective utilization of staffing and resources. One of the first steps of the project implementation was the selection of a suitable ambient air monitoring site in or around Las Vegas, Nevada.
The objective of the study conducted under this protocol was:
This report focuses on carbon monoxide (CO), nitrogen oxide (NO), nitrogen dioxide (NO2), oxides of nitrogen (NOX), black carbon (BC), particulate matter < 10 microns (PM10), PM2.5, PM Coarse, and MSAT (1-3, butadiene, benzene, acrolein, formaldehyde, acetaldehyde) measurements.
FHWA's "detailed monitoring protocol" outlined a uniform approach to conduct this study, as well as future related studies, for evaluating mobile source contributions to air toxic compounds and PM2.5 and their dispersion patterns2. This protocol was peer reviewed by other federal agencies (EPA and DOE), State environmental and transportation agencies, the Sierra Club, and academic institutions. A more detailed examination of the monitoring protocol indicates that for each city, continuous monitoring and integrated sample collection was required at four monitoring sites located at distances ranging from roadside to 300 meters (m). In addition, wind speed and wind direction was required at each site. Moreover, monitoring for the complete suite of meteorological parameters was required at the monitoring station positioned 50 to 150 m from the roadway (100 m downwind).
The site selection process consisted of a series of seven steps (1) determine site selection criteria2; (2) develop list of candidate sites and supporting information; (3) apply site selection filter ("coarse" and "fine"), (4) site visit; (5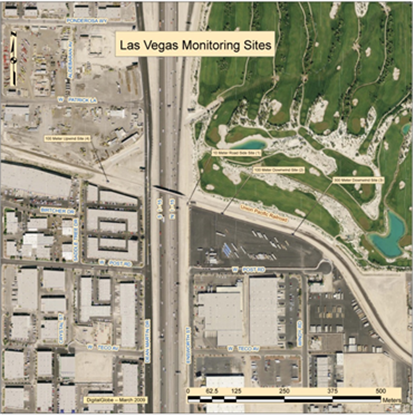 ) select candidate site(s) via team discussion; (6) obtain site access permission(s); and (7) implement site logistics. This process resulted in the selection of a location along I-15, just south of the "Las Vegas Strip".3
Of the almost two dozen sites evaluated, the I-15 site was considered the "optimal" site of all the monitoring sites considered3. This site had the most advantages and fewest disadvantages of all the monitoring sites considered in meeting the project objectives.
Figure 1. Map of Las Vegas Monitoring Sites.
This site had high AADT (206,000 AADT for 2006), no noise walls, meteorological and traffic data availability, manageable site logistics including right-of-way (ROW) access, and favorable wind direction3. Of the disadvantages, this site had a modest "cut" at that location, but only for a short distance. The roadway passed under a railroad bridge (Figure 1) and returned to at/near grade conditions. In addition, McCarran International Airport, a source of vehicle and aircraft emissions, was nearby, with runways approximately 1 km due east, and ground equipment and terminals approximately 5 km northeast of the site. However, the predominant winds at this location generally maintain the monitoring site upwind of the airport activities.
The analytical methods implemented during this study followed EPA standard methods and Federal Reference Methods for performing ambient air measurements when applicable. The following table summarizes the measurements taken at each monitoring site.
Table 1. Summary of Measurements Conducted at Each Monitoring Site.
Measurements |
20 Meter Roadside |
100 Meter Downwind |
300 Meter Downwind |
100 Meter Upwind |
|---|---|---|---|---|
TO-11A Cartridge sampling |
X |
X |
X |
X |
TO-15 Canister sampling |
X |
X |
X |
X |
Continuous gas monitoring (CO, NOx ) |
X |
X |
X |
X |
Continuous black carbon monitoring (Aethalometer) |
X |
X |
X |
X |
Continuous fine particle (TEOM) |
X |
X |
X |
X |
Integrated PM2.5 (FRM) |
X |
X |
X |
X |
Wind speed/wind direction |
X |
X |
X |
X |
Meteorological monitoring (temp, RH, etc.) |
X |
|||
Sound Meter |
X |
X |
||
Video Camera |
X |
X |
X |
|
Cut Section Monitoring (3-CO & 3-Aethalometers) |
X |
Enhancements to the study protocol included 3-additional CO monitors and 3-additional aethalometers to more fully characterize the freeway "cut-section", and sound meter and video camera to monitor train and plane activity from the railroad and nearby airport, respectively. The video was also used to validate traffic count information received from NDOT.
Most analyzers deployed for this study performed well with the exception of the TEOMs. Further details on these difficulties can be found in the main report. An instrument upgrade was performed in the field by technical staff from ThermoScientific in late November 2009 and early December 2009. These upgrades improved instrument performance and stability. Due to issues with instrument performance and stability during most of the study, the data for this instrument is problematic. Results are presented in this report although it is very difficult to draw conclusions from the current analyses.
Figure 2 provides a conceptual flow diagram of the data management process utilized in this study. This report includes process details, data analysis, and validation procedures as well as the Quality Assurance Project Plan (QAPP) that was developed for this study.
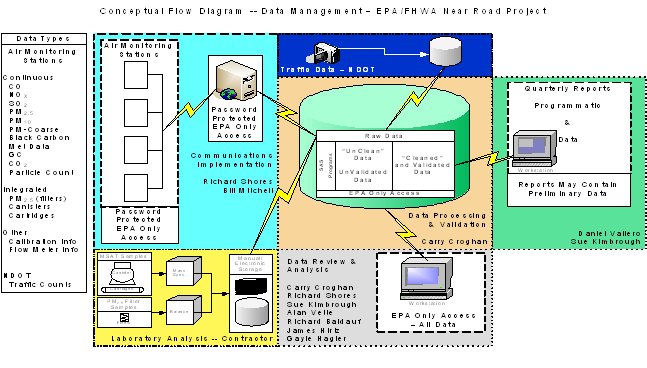
Figure 2. Flow Diagram - Data Management
More detailed information is included the report and appendices regarding data management, analysis, and validation.
Part V: Results and Discussion
During this study gigabytes of data were collected-including data from continuous monitors such as the CO, NOX, BC and TEOM (PM10, PM2.5, PM Coarse) analyzers,; integrated sample data; traffic data and video data. Results (i.e., data and graphs) presented herein were selected based on the original objectives of the study: "…to determine MSAT concentrations and variations in concentrations as a function of distance from the highway, and to establish relationships between MSAT concentrations as related to highway traffic flows including traffic count, vehicle types, and speed; and meteorological conditions such as wind speed and wind direction; and other pollutants primarily emitted from motor vehicles such as CO, NO, NO2, NOX and BC."2
Traffic Activity. Traffic data indicated a tri-modal distribution as opposed to a more typical urban bi-modal distribution with morning and evening rush hour events (Figure 3). Several factors may have led to this atypical result. Since Las Vegas is a recreation destination, many travelers do not adhere to typical urban driving activities of morning and evening commutes. Many businesses in Las Vegas cater to these visitors; thus employee commutes may also not be standard. In addition, I-15 carries both inter- and intra- state traffic and is a North American Free Trade (NAFTA) corridor that attracts traffic throughout the day. These trends were consistent across all months of the study.
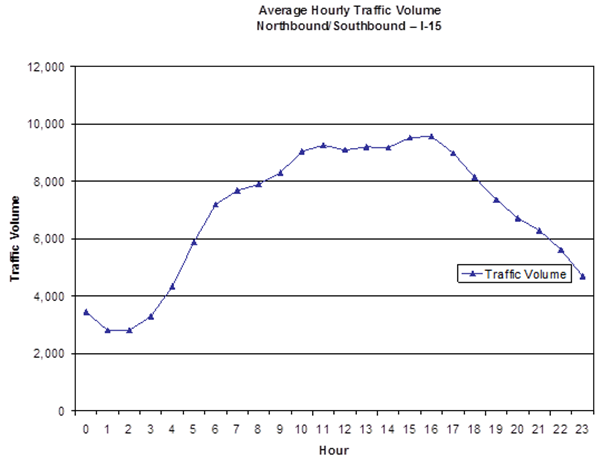
Figure 3. Average Hourly Traffic Volume at I-15 Site from Dec. 2008 through Dec. 2009.
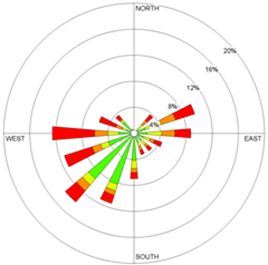
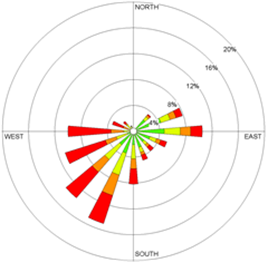
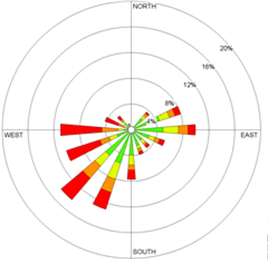
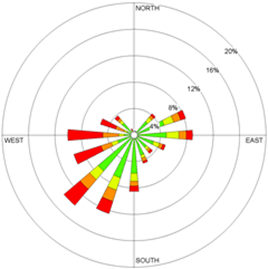
Meteorology. Figure 4 shows wind rose data collected at the closest station to I-15, approximately 20 m to the east of the highway. During the study, winds were predominately from the southwest quadrant, indicating that the monitoring transect typically contained one upwind station 100 m west of I-15 and three downwind stations east of the highway. Figure 4 shows an occasionally strong easterly wind during the time period from midnight until approximately 3 p.m. During this time, the station to the west of I-15 experienced impacts from the highway.
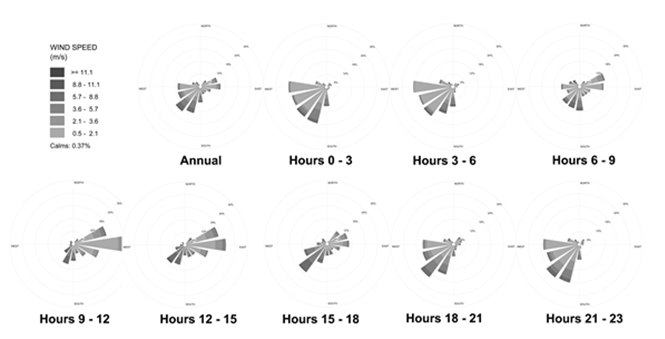
Figure 4. Wind Roses from the station 300 m east of I-15 from Dec. 2008 to Dec. 2009 separated by time of day.
Air Quality - Continuous Analyzers.
Figure 5 shows the average NO2 concentration measured at each of the four monitoring stations during the entire study period, as well as similar average concentrations of related pollutants NO and NOx. Note that the data in Figure 5 represents all wind directions and wind speeds. Figure 5 shows that concentrations on average for all of these pollutants were higher closest to the highway, although the NO and NOx gradients were steeper than NO2. Since NO is the primarily emitted pollutant from motor vehicles and accounts for the majority of NOx emissions, steeper gradients for these pollutants were expected. While some studies have shown a bi-modal NO2 gradient away from the road, with a peak near the road and another peak further from the road, these results indicated that long-term average concentrations were approximately 20 percent higher closest to the highway. Figure 6 shows NO2 concentrations as a function of wind direction and wind speed. This figure shows peak concentrations of around 75 ppb, and high concentrations occurred during hourly average winds from multiple directions. Given that, on average, the highest concentrations occurred at the station closest to the highway, these results likely suggest a number of factors. Since NO2 primarily occurs from secondary formation, there may be a significant background concentration of this pollutant. Elevated concentrations at the near-road station were influenced by direct transport from the highway due to prevailing winds from the west, increased time for the transformation of NO to NO2 during parallel winds, and potentially upwind meandering of traffic-related pollutants even when winds occurred from the east.4 Emissions from Las Vegas Boulevard and operations at nearby McCarran International Airport may have contributed to the elevated background NO2 concentrations during wind events from the east.
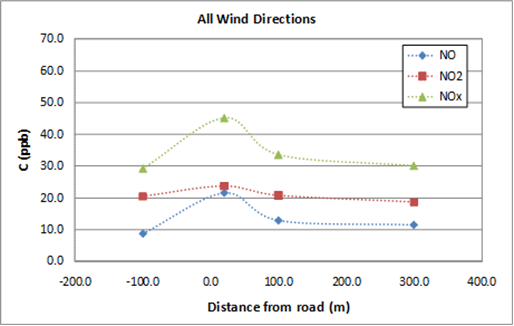
Figure 5. Average concentrations of NO, NO2 and NOx measured at all four monitoring stations indicating long-term trends in concentration gradients for each pollutant.
Figure 5 note: The lines connecting the points are provided as a visual aid to the reader and do not imply statistically significant differences in concentrations.
|
Concentration (ppb)
|
|
100 Meter Upwind |
20 Meter Roadside |
|
|
|
|
100 Meter Downwind |
300 Meter Downwind |
|
Figure 6. Pollution Rose for NO2 for all stations, all wind directions. |
||
Note that higher average NO, NO2 and NOX concentrations and generally steeper gradients were observed during conditions when the winds are from the roadway as opposed to all wind directions (Figure 7). This was also observed in CO concentration plots, Figure 8 and Figure 9.
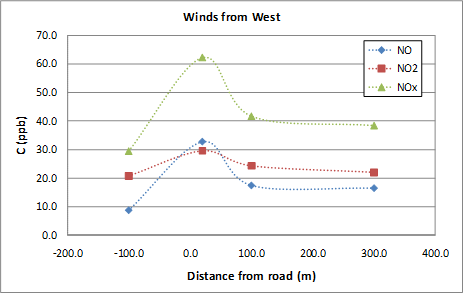
Figure 7 Average concentrations of NO, NO2, and NOx measured at all four monitoring stations indicating long-term trends in concentration gradients for each pollutant-winds from west.
Figure 7 note: The lines connecting the points are provided as a visual aid to the reader and do not imply statistically significant differences in concentrations.
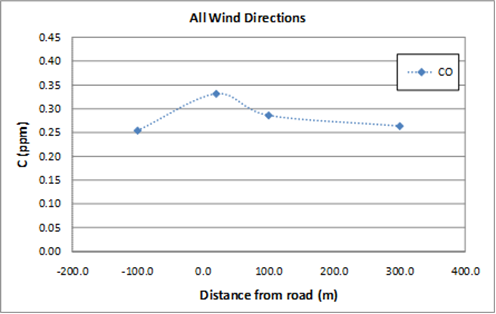
Figure 8 Average CO concentrations - winds from all wind directions.
Figure 8 note: The lines connecting the points are provided as a visual aid to the reader and do not imply statistically significant differences in concentrations.
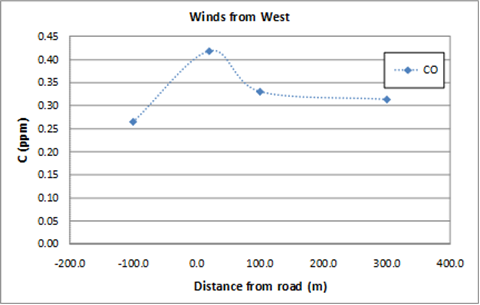
Figure 9. Average CO Concentrations -- winds from west.
Figure 9 note: The lines connecting the points are provided as a visual aid to the reader and do not imply statistically significant differences in concentrations.
Air Quality - Integrated Samples -- VOC
Table 2 shows the number of observations, mean and 95% confidence intervals for the VOC data (TO-15 method). As shown in Table 2, Station 2 exhibits higher values for two of the pollutants (benzene). This may be due to influences from other nearby sources such as Las Vegas Blvd., McCarran International Airport, nearby truck parking lot as shown in Figures 48 and 49 in the main body of the report.
Table 2. VOC -- averages for all wind directions (12/15/2008-12/15/2009)
Site name |
Distance from Road |
N (Obs.) |
Mean (ppb) |
95% CI (ppb) |
|---|---|---|---|---|
1,3-Butadiene |
||||
Station 4 |
100 Meter Upwind |
251 |
0.05 |
0.04-0.05 |
Station 1 |
20 Meter Roadside |
276 |
0.06 |
0.05-0.07 |
Station 2 |
100 Meter Downwind |
246 |
0.06 |
0.05-0.07 |
Station 3 |
300 Meter Downwind |
246 |
0.03 |
0.03-0.04 |
Benzene |
||||
Station 4 |
100 Meter Upwind |
251 |
0.20 |
0.18-0.22 |
Station 1 |
20 Meter Roadside |
276 |
0.22 |
0.20-0.24 |
Station 2 |
100 Meter Downwind |
246 |
0.32 |
0.29-0.35 |
Station 3 |
300 Meter Downwind |
246 |
0.16 |
0.15-0.18 |
NOTE: Data are for valid samples only.
Data Caveats- Integrated Samples -- VOC
A more complete discussion of data caveats may be found in the main body of the report. The VOC data were not background corrected. This was deemed unnecessary as the field blank values were either zero or below the method detection limit. It should be noted that acrolein values for the TO-15 method (canister) are problematic. Prior to June 18, 2009 the GC/MS system was not optimized for acrolein analysis. In addition, there is low confidence with all acrolein values due to potential contamination of Summa passivated canisters associated with the "growth" of acrolein inside cleaned canisters. Acrolein concentrations inside cleaned canisters containing zero humidified air have been shown to increase over time due to causes that are unknown at this time. For these reasons, acrolein data are not reported for the TO-15 method (Table 2).
Air Quality - Integrated Samples -- Carbonyl
Table 3 shows the number of observations, mean and 95 percent confidence intervals for the carbonyl data (TO-11a method). Acetaldehyde measurements at Station 1 were approximately 10 percent higher than at Station 4. Acetaldehyde measured at Station 1 versus Station 2 was virtually the same. Formaldehyde measurements at Station 1 were approximately 18 percent higher and 10 percent higher than at Station 2 and 4, respectively. Acrolein measurements at Station 1 were approximately 14 percent higher than at Station 2. Acrolein measured at Station 1 versus Station 4 was virtually the same. Box-whisker plots (Figures 50 - 55) show all three pollutants for all wind conditions and downwind conditions.
Table 3. Carbonyl -- averages for all wind directions (12/20/2008-12/16/2009)
Site name |
Distance from Road |
N (Obs.) |
Mean (ppb) |
95% CI (ppb) |
|---|---|---|---|---|
Acetaldehyde |
||||
Station 4 |
100 Meter Upwind |
279 |
1.02 |
0.94-1.11 |
Station 1 |
20 Meter Roadside |
308 |
1.12 |
1.02-1.22 |
Station 2 |
100 Meter Downwind |
225 |
1.11 |
1.00-1.21 |
Station 3 |
300 Meter Downwind |
--- |
--- |
--- |
Formaldehyde |
||||
Station 4 |
100 Meter Upwind |
279 |
2.91 |
2.73-3.10 |
Station 1 |
20 Meter Roadside |
308 |
3.18 |
2.97-3.39 |
Station 2 |
100 Meter Downwind |
225 |
2.62 |
2.45-2.79 |
Station 3 |
300 Meter Downwind |
--- |
--- |
--- |
Acrolein |
||||
Station 4 |
100 Meter Upwind |
279 |
0.27 |
0.26-0.29 |
Station 1 |
20 Meter Roadside |
308 |
0.27 |
0.25-0.28 |
Station 2 |
100 Meter Downwind |
225 |
0.27 |
0.25-0.29 |
Station 3 |
300 Meter Downwind |
--- |
--- |
--- |
NOTE: Data are for valid samples only.
Data Caveats- Integrated Samples -- Carbonyl
As shown in Table 3, the study did not provide any usable data for Station 3. The instrument at Station 3 had problems throughout the life of the study. Thus, all carbonyl data collected at Station 3 is considered invalid. Background corrections were not performed on the formaldehyde data. This was deemed unnecessary as the field blank values were either zero or below the method detection limit. Background corrections were performed on the acetaldehyde and acrolein data. A more complete discussion of the background corrections performed on the acetaldehyde and acrolein data may be found in the main body of this report.
Air Quality - Integrated Samples - PM2.5
A summary of PM2.5 averages and confidence intervals are shown in Table 4. Figure 10 shows box-whisker plots PM2.5 integrated filter samples. As shown in Table 4 and Figure 10, the 20 m site (Station 1) has an observed higher mean PM2.5 concentration than the other sites. Station 1 is approximately 19 percent, 11 percent, and 9 percent higher than Station 2, 3, and 4 respectively.
Table 4. PM2.5 Filters -- averages for all wind directions (12/20/2008-12/15/2009)
Site name |
Distance from Road |
N (Obs.) |
Mean (µg/m3) |
95% CI (µg/m3) |
|---|---|---|---|---|
Station 4 |
100 Meter Upwind |
30 |
9.20 |
7.63-10.79 |
Station 1 |
20 Meter Roadside |
29 |
10.03 |
8.56-11.50 |
Station 2 |
100 Meter Downwind |
30 |
8.42 |
6.99-9.85 |
Station 3 |
300 Meter Downwind |
29 |
9.05 |
7.51-10.58 |
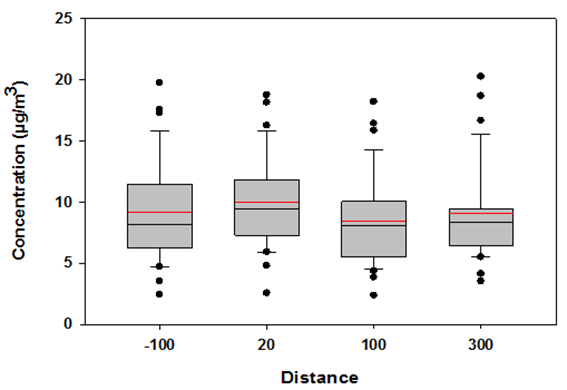
Figure 10 Box-Whisker Plot for PM2.5 for all stations, all sample times, all wind directions.
This report provides a summary of a field study conducted in Las Vegas, NV from mid-December 2008 thru mid-December 2009. The objective of this research study has been to determine MSAT concentrations and variations in concentrations as a function of distance from the highway and to establish relationships between MSAT concentrations as related to highway traffic flows including traffic count, vehicle types and speeds, meteorological conditions, such as wind speed and wind direction, and other pollutants primarily emitted from motor vehicles such as CO, NO, NO2, NOX, BC, PM10, PM2.5, PM Coarse, and MSATs. More detailed statistical and analytical results may be found in the main body of this report. These detailed results support the following preliminary conclusions:
Preliminary results of this study provide indications that highway vehicle emissions impact near-road air quality. Known highway vehicle pollutants such as CO, NO, NO2, NOX and BC have elevated concentrations in a near-road environment and decrease as one moves away from the road. Additional analysis of the data is needed to more accurately quantify the effect of wind speed as well as other near-road effects.
Costs, timeliness, and other operational factors are just some of the site implementation variables that are difficult to control. These implementation variables include site access and permissions, electrical connectivity, security, communications, site operators, and equipment. Costs may be estimated but there may be factors beyond one's control that influence the outcome of the costs. An example of this was that in order to obtain electrical services for the Las Vegas study site, electrical conduit needed to be installed underground. This underground installation encountered a caliche geological formation, which is hardened sedimentary rock prevalent in the Las Vegas area. This necessitated the use of jackhammers to install the underground conduit; a much more expensive operation than the use of the typical backhoe. An additional example was the performance of an analytical instrument utilized in the study. This instrument had both design and manufacturing issues that only became apparent after the instruments had been deployed. The remedy for this situation was that the manufacturer performed an "in the field upgrade." Projects of this nature present myriad challenges both from a programmatic and technical perspective.
Access to sites owned by private citizens can be challenging. Adjacent property owners may understand the necessity of improving the state-of-the-science, benefiting the community at-large and have a desire to be a "good" citizen, but existing lease and financial issues are a deterrent to participation. In addition, liability, insurance compensation, hassle factor(s), and other real and perceived issues present obstacles to site access.
Electrical and communications companies have numerous requirements for obtaining their services. This process requires interactions with utility companies as well as local (i.e., county or city) inspections departments.
Study Design. This study focused on a single location (freeway) in one city. Additional locations will be needed to fully assess air pollutant concentration gradients from different roadway types; different traffic patterns; geographic locations; meteorological conditions, and other factors.
Methods. The analytical methods implemented during this study followed EPA standard methods and Federal Reference Methods for performing ambient air measurements. Refinements to methods can and do occur over the course of time due to improved technologies and measurement techniques, however the most current technologies and techniques were implemented for this study
Data. Uncertainties in the data may be considered in two parts: overall data integrity, individual measurements. Electronic data streaming was utilized whenever possible to lessen the chance of human error (i.e., transcription error) and ensure overall data integrity. When hardcopy data sheets, notes, and chain-of-custody forms were utilized, an EPA staff member reviewed the hardcopy and verified the data. Quality assurance of the data (i.e., individual measurements) is an on-going process and often occurs during more specific data analysis. Given that this project generated gigabytes of data, thorough quality assurance of the data is an on-going activity.
The FHWA and EPA collaborated on a research effort to characterize the impact and behavior of particulate matter with aerodynamic diameter less than 2.5 microns (PM2.5), MSATs near highways and other pollutants primarily emitted from motor vehicles such as CO, NO, NO2, NOX and BC. This study was conducted from mid-December 2008 thru mid-December 2009. The preliminary results of this study have been summarized in this Executive Summary and are described in more detail in the following sections of this report. Additional data analysis will be required over the coming months to adequately assess the significance and implications of the results of this study.