
Also available as Adobe PDF (5 MB)

Notice
This document is disseminated under the sponsorship of the U.S. Department of Transportation (USDOT) in the interest of information exchange. The U.S. Government assumes no liability for the use of the information contained in this document.
The U.S. Government does not endorse products or manufacturers. Trademarks or manufacturers' names appear in this report only because they are considered essential to the objective of the document.
Quality Assurance Statement
The Federal Highway Administration (FHWA) provides high-quality information to serve Government, industry, and the public in a manner that promotes public understanding. Standards and policies are used to ensure and maximize the quality, objectivity, utility, and integrity of its information. FHWA periodically reviews quality issues and adjusts its programs and processes to ensure continuous quality improvement.
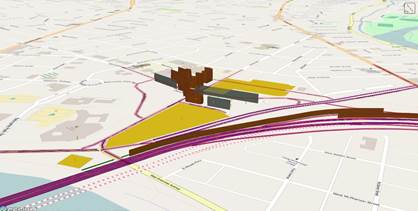
Cover image source: FHWA Traffic Noise Model (TNM) 3.0
| 1. Report No. FHWA-HEP-18-068 |
2. Government Accession No. | 3. Recipient's Catalog No. | |||
|---|---|---|---|---|---|
| 4. Title and Subtitle Techniques for Reviewing TNM Model Runs and Associated Noise Modeling Reports |
5. Report Date December 15, 2017 |
||||
| 6. Performing Organization Code | |||||
| 7. Author(s) RSG |
8. Performing Organization Report No. | ||||
| 9. Performing Organization Name And Address RSG 55 Railroad Row White River Junction VT 05001 |
10. Work Unit No. (TRAIS) | ||||
| 11. Contract or Grant No. | |||||
| 12. Sponsoring Agency Name and Address U.S. Department of Transportation 1200 New Jersey Ave. SE Washington, D.C. |
13. Type of Report and Period Covered | ||||
| 14. Sponsoring Agency Code | |||||
| 15. Supplementary Notes Other authors: Bowlby & Associates, Inc.; ATS Consulting; Environmental Acoustics; Illingworth & Rodkin |
|||||
| 16. Abstract This guide provided a Tier 1 approach that provides basic details and checklists for reviewers performing accelerated reviews and includes information on how to review noise models developed using TNM 3.0 in Section 2. Section 3 of this guide provides a Tier 1 approach that provided in-depth advanced scenario details and checklists useful for detailed reviews of complex projects and reviews specific project scenarios using the National Cooperative Highway Research Program (NCHRP) Report 791, Supplemental Guidance on the Application of FHWA's Traffic Noise Model (TNM). It also identifies challenges in TNM 3.0 analysis (Section 4). Appendix A includes a checklist tool for review of noise models. The reviewer should also use the FHWA's review guide, Techniques for Reviewing Noise Analyses and Associated Noise Reports, to review the associated noise study report to ensure that the TNM modeling results are reported accurately. |
|||||
| 17. Key Words Noise modeling analyses; Highway traffic noise model; TNM modeling results; TNM 3.0; checklist tool |
18. Distribution Statement | ||||
| 19. Security Classif. (of this report) Unclassified |
20. Security Classif. (of this page) Unclassified |
21. No. of Pages 58 |
22. Price | ||
| Form DOT F 1700.7 (8-72) | Reproduction of completed page authorized | ||||
Every state highway agency (SHA) must develop a noise policy to comply with the requirements of the Federal Highway Administration (FHWA) noise regulation, Procedures for Abatement of Highway Traffic and Construction Noise, 23 CFR 772 [1]. SHAs must conduct noise studies for federal highway projects in accordance with the FHWA noise regulation and the SHA noise policy.
SHAs have flexibility in developing their noise policies and documenting the results of the noise studies. This guide provides technical guidance and is a tool for SHA practitioners to support and promote comprehensive and efficient reviews of highway traffic noise studies. This guide provides guidance for reviewing noise models developed with FHWA's Traffic Noise Model (TNM) version 3.0 (TNM 3.0). Some SHAs already provide guidance for TNM models review. This guide serves as a supplemental resource but is not intended to replace SHA guidance.
The National Environmental Policy Act of 1969 (NEPA) established a national policy on the environment and created the Council on Environmental Quality (CEQ). The purpose of NEPA is to minimize or eliminate damage to the environment caused by actions funded or taken by the federal government. NEPA provides broad authority and responsibility for evaluating and mitigating adverse environmental effects including those resulting from highway traffic noise.
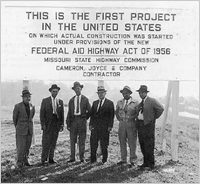
The Federal Aid Highway Act of 1970 (FAHA 1970) mandated that FHWA develop noise standards for identifying noise impacts and evaluating noise mitigation for federal projects. FAHA 1970 also stipulated that FHWA cannot approve plans and specifications for federal projects unless the project includes adequate noise abatement measures to comply with the standards.
FHWA developed noise regulations or standards in response to the requirements set forth in FAHA 1970. The purposes of the FHWA noise regulation are to:
FHWA has updated the regulations as summarized below:
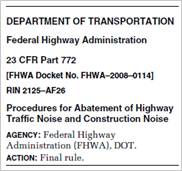
Each update supersedes and replaces the previous one.
On June 12, 1995, FHWA issued a memorandum requiring states to adopt written statewide noise policies. These written state policies must be approved by FHWA and demonstrate "substantial compliance" with the FHWA noise regulation. On July 13, 2010, FHWA amended 23 CFR 772 that required states to develop noise policies consistent with the regulation and that are applied uniformly and consistently statewide. SHAs have flexibility in developing their noise policies and documenting the results of noise studies.
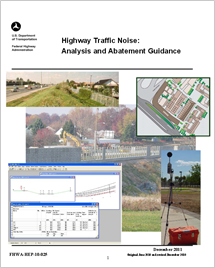
FHWA concurrently published the document, Highway Traffic Noise Analysis and Abatement: Policy and Guidance (FHWA's guidance), to aid states in developing their policies. FHWA updated this guidance most recently in December 2011 [2] to ensure consistency with the July 13, 2010 FHWA noise regulation.
FHWA has developed answers to many Frequently Asked Questions (FAQs) and also developed a series of "Highway Traffic Noise Resources" to assist SHAs in implementing the FHWA noise regulation.
The FHWA noise regulation requires noise studies for Type I projects including roadway widenings to provide additional through travel lanes, the construction of a highway on new location, the physical alteration of an existing highway that significantly changes either the horizontal or vertical alignment or increases capacity. Projects that involve the addition of a new or substantial alteration of a weigh station, rest stop, ride-share lot or toll plaza are also Type I Projects.
The SHA must conduct detailed noise analyses for Type I projects as well as for Type II projects, which involve the construction of noise barriers when there is no associated highway project. Projects that are not Type I or Type II are Type III. Type III projects include projects that typically do not add capacity and are not expected to cause noise impacts including maintenance, roadway safety, bridge repair, intersection improvement, and bicycle and pedestrian projects. Noise analyses are not required for Type III projects regardless of the type of environmental document.
Highway traffic noise levels are expressed in terms of the hourly, A-weighted equivalent sound level in decibels (dBA). A sound level represents the level of the rapid air pressure fluctuations caused by sources, such as traffic, that are heard as noise. A decibel is a unit that relates the sound pressure of a noise to the faintest sound the young human ear can hear. The A--weighting refers to the amplification or attenuation of the different frequencies of the sound (subjectively, the pitch) to correspond to the way the human ear "hears" these frequencies. Generally, when the sound level exceeds the mid-60 dBA range, outdoor conversation in normal tones at a distance of three feet (0.9 meters) becomes difficult. A 9-10 dB increase in sound level is typically judged to be twice as loud as the original sound, while a 9-10 dB reduction is half as loud. Doubling the number of sources (i.e., vehicles) increases the hourly equivalent sound level (Leq) by approximately 3 dB, which is usually the smallest change that people can detect without specifically listening for the change. Figure 1-1 shows some common indoor and outdoor sound levels.
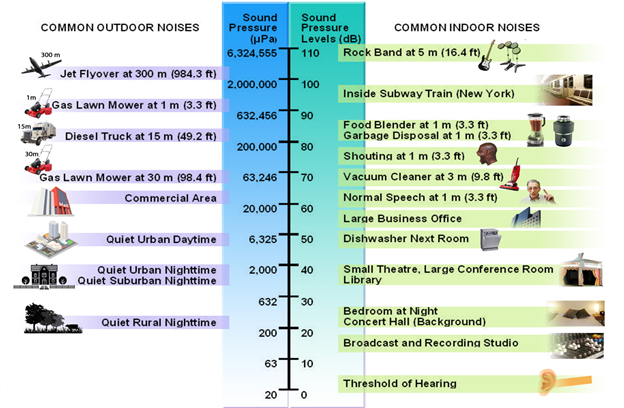
Source: FHWA
Because most environmental noise fluctuates from moment to moment, it is standard practice to condense data into a single level called the equivalent sound level (Leq). The Leq is a steady sound level that would contain the same amount of sound energy as the actual time-varying sound evaluated over the same time period. The Leq averages the louder and quieter moments, but gives much more weight to the louder moments in the averaging. For traffic noise studies, Leq is typically evaluated over the worst one-hour period and is defined as Leq (1h).
The term insertion loss (IL) is generally used to describe the reduction in Leq (1h) at a location after a noise barrier is constructed. For example, if the Leq (1h) at a residence before a barrier is constructed is 75 dBA and the Leq (1h) after a barrier constructed is 65 dBA, then the insertion loss would be 10 dB.
Noise studies may use the terms "receptor" and "receiver" that are similar but distinct. Receptors represent noise-sensitive locations, such as a backyard or an outdoor seating area at a restaurant. Receivers are discreet TNM modeling points that represent receptors. A TNM receiver can represent a single receptor or a group of receptors, such as using one TNM receiver to represent a group of residences with similar sound levels.
Noise impact is determined by comparing predicted future noise levels with the project: (1) to a set of Noise Abatement Criteria (NAC) for a land use activity category, and (2) to existing noise levels.
The FHWA noise regulation states that traffic noise impacts require consideration of abatement when worst-hour noise levels approach or exceed the NAC listed in Table 1-1 or substantially increase existing noise levels. FHWA requires that each SHA define "approach" and "substantial increase." Most SHAs define approach as one dB below the NAC. FHWA permits SHAs to define "substantial increase" between 5 and 15 dB.
The FHWA established the NAC based on interference of speech communication. The NAC are a compromise between noise levels that are desirable and those that are achievable and are not design goals. SHAs should focus noise abatement efforts on achieving the noise reduction design goal; not reducing noise levels below the NAC.
Section 2 of this guide provided a Tier 1 approach that provides basic details and checklists for reviewers performing accelerated reviews and includes information on how to review noise models developed using TNM 3.0. Section 3 of this guide provides a Tier 1 approach that provided in-depth advanced scenario details and checklists useful for detailed reviews of complex projects and reviews specific project scenarios using the National Cooperative Highway Research Program (NCHRP) Report 791, Supplemental Guidance on the Application of FHWA's Traffic Noise Model (TNM). Section 4 identifies challenges in TNM 3.0 analysis (Section 4). Appendix A includes a checklist tool for review of noise models.
TNM 3.0 differs from its predecessor, TNM 2.5, in the way it names models. TNM 2.5 used the term "run" to define a specific model while TNM 3.0 uses the term "project". Therefore, all references in this guide to "project" are for the TNM model and not the Type I project for which the noise study is being conducted.
Sections 2 and 3 are in a statement and response format. The reviewer can move through each section of a guide to evaluate the completeness and accuracy of a submitted noise model. The reviewer can use the associated TNM 3.0 noise modeling review checklist in Appendix A to determine if it provides all required information. A reviewer can complete a checklist for each report noting items that are complete and add notes on items that are missing, incorrect, or need attention.
The blue boxes in the right margin throughout the guide provide additional review tips, many of which reference the FHWA Frequently Asked Questions (FAQs) available on FHWA's Noise Program website.
The TNM 3.0 review questions tie directly to the review checklist in Appendix A. The reviewer can complete a checklist for each noise model noting items that are modeled correctly and adding notes on items that are missing, incorrect or need attention.
The reviewer should also use the FHWA's review guide, Techniques for Reviewing Noise Analyses and Associated Noise Reports, to review the associated noise study report to ensure that the TNM modeling results are reported accurately.
FHWA also updated the Noise Measurement Handbook and developed a Noise Measurement Field Guide. SHAs may opt to use these documents to supplement their noise measurement procedures. All referenced FHWA documents are available on FHWA's Noise Program website.
| Activity Category | LAeq(h) | Evaluation Location | Activity Description |
|---|---|---|---|
| A | 57 | Exterior | Lands on which serenity and quiet are of extraordinary significance and serve an important public need and where the preservation of those qualities is essential if the area is to continue to serve its intended purpose. |
| B(1) | 67 | Exterior | Residential. |
| C(1) | 67 | Exterior | Active sport areas, amphitheaters, auditoriums, campgrounds, cemeteries, day care centers, hospitals, libraries, medical facilities, parks, picnic areas, places of worship, playgrounds, public meeting rooms, public or nonprofit institutional structure, radio stations, recording studios, recreation areas, Section 4(f) sites, schools, television studios, trails, and trail crossings. |
| D | 52 | Interior | Auditoriums, day care centers, hospitals, libraries, medical facilities, places of worship, public meeting rooms, public or nonprofit institutional structure, radio studios, recording studios, schools, and television studios. |
| E(1) | 72 | Exterior | Hotels, motels, offices, restaurants/bars, and other developed lands, properties or activities not included in A-D, or F. |
| F | --- | --- | Agriculture, airports, bus yards, emergency services, industrial, logging, maintenance facilities, manufacturing, mining, rail yards, retail facilities, shipyards, utilities (water resources, water treatment, electrical), and warehousing. |
| G | --- | --- | Undeveloped lands that are not permitted. |
[1] Includes undeveloped lands permitted for this activity category. Source: 23 CFR 772, July 2010.
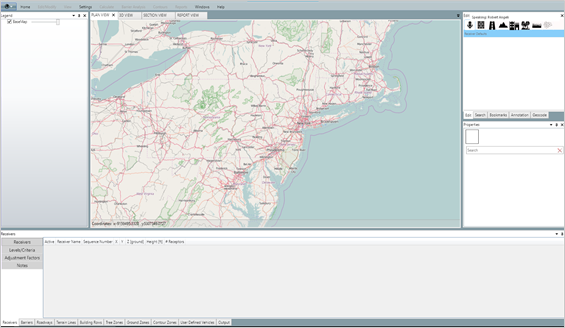
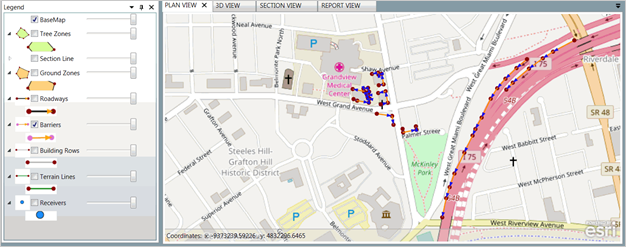
FHWA updated the acoustical algorithms in TNM 3.0 to support more accurate noise analyses. TNM 3.0 uses a Graphical User Interface (GUI) that incorporates geographic information systems (GIS) capability. When complete, the TNM 3.0 will provide FHWA stakeholders with a modern noise analysis tool that interacts with common highway design software.
TNM 3.0 also has updated acoustical algorithms (including the ability to process reflections off of single barriers, as well as L10/L50 capabilities), and interoperability via a TNM plug-in to Esri's ArcGIS®, AutoDesk's AutoCAD®, and Bentley's MicroStation®. These enhancements provide more flexibility and accuracy during data entry and better visual representations during data analysis for highway traffic noise studies.
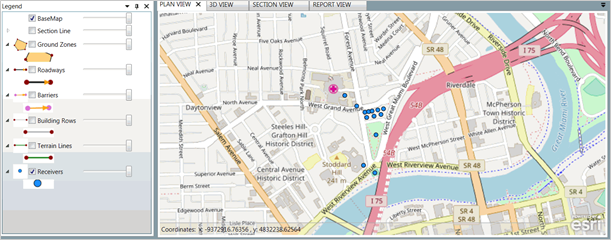
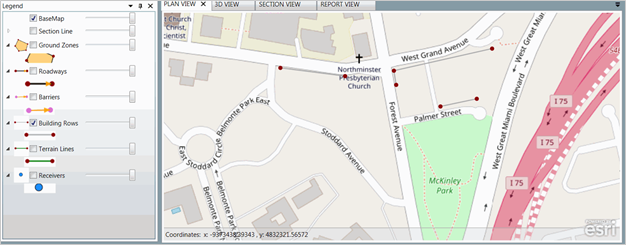
Figure 2-1 shows the graphical user interface of the TNM 3.0. The new layout allows the user to select from a variety of base-maps as background for the model. The GUI layout is explained in detail in Section 2.2.
Check completeness of basic setup information.
Confirmation of project projection settings with TNM analyst is helpful to ensure consistent units in the evaluation process.
Check that the basic setup information includes the organization, the agency and contract number, the project units, the project projection, the TNM project name (i.e. Existing, Future No-Build and Build, etc.) and a brief project description including analyst name.
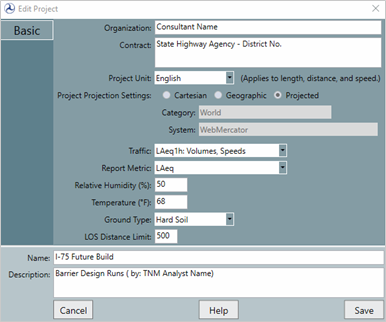
TNM 3.0 includes the ability to calculate the new metrics L10 and L50, in addition to the existing metrics of Leq and Ldn.
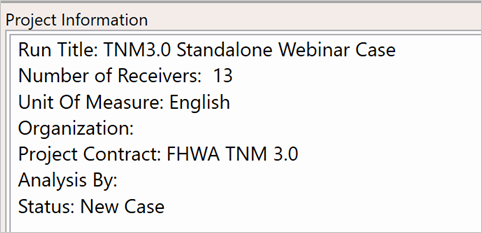
Project information can also be viewed by clicking the "Project Information" in the Object Details Pane.
Legend Pane: Objects layers can be turned off by unchecking the object later to only show the object reviewed.
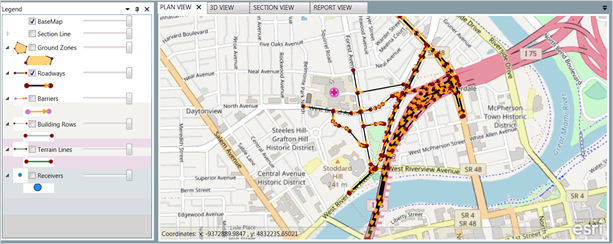
The screenshots shown below and for the rest of the document are meant as an example and are not intended to recommend the project extents to model in actual projects. The TNM project layout shows the Legend Pane, the View Pane, the Edit Pane and the Object Details Pane (Figure 2-4).
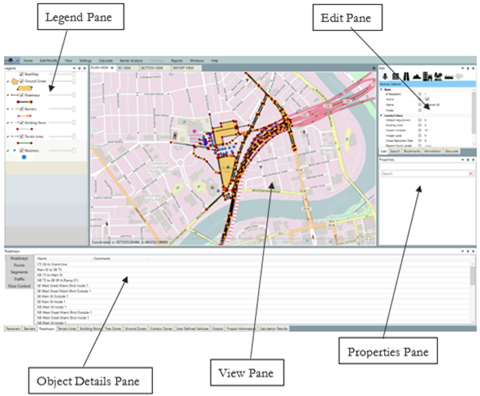
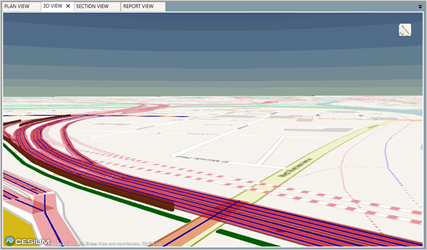
Check the various project objects using several views, which will be elaborated on in the following sections, as well as a measuring tool that can be used to measures distances between the different objects. The TNM project views are:
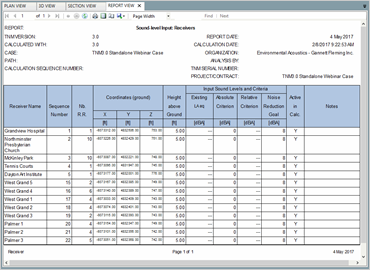
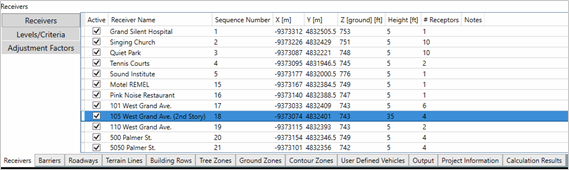
A Standard model calculates noise levels at area(s) of frequent human use with receivers placed in representative locations where frequent human use occurs. The reviewer can enable the receiver layer (Figure 2-8), review the plan view, and check receiver data in the Object Details Pane or receivers report (Figure 2-9). The reviewer can save and export the report to Excel, Word and PDF to check coordinates and other object details.
Check that all receivers of interest are active.
Confirm that model identifies receivers' names.
It is helpful to name receivers using street addresses or property names for non-residential properties. Receiver names could also be tied to the stationing for the project. Overall the analyst should use a consistent naming system for all receivers. Some SHAs have guidance on naming receivers.
In some cases a single receiver represents activity areas. A check of that grouping may be needed to ensure an accurate accounting of all impacts and benefits.
Check receptor number accuracy for each receiver.
Check that each receiver represents the correct number of receptors. In some cases, one TNM receiver can represent multiple receptors. However, the receptors should be expected to experience similar sound levels for both existing and future conditions and have comparable noise reductions if a barrier was constructed.
Check accuracy of receiver elevations and heights and accuracy of height above ground for modeled upper-floor receivers.
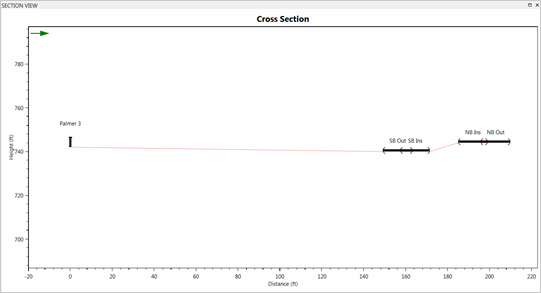
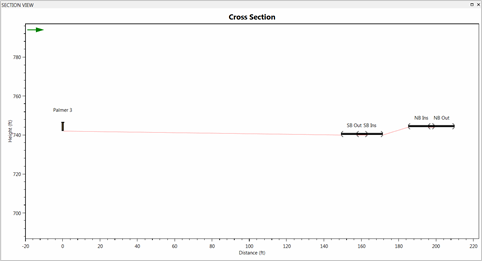
Check that receiver height is set by default to 5 feet above ground or 5 feet above the floor level for upper floors of multi-story buildings as shown in the "Height" Column in Figure 2-10. Check elevations by opening section (Figure 2-11) and 3D views and checking heights in the receiver Object Details Pane or receivers report.
A preliminary TNM analysis can identify a conservative distance within which impacts would be expected for a project. The analysis then includes all uses within that distance to ensure identification of all impacts.
Check that enough modeled receivers are present to account for impacts and benefits.
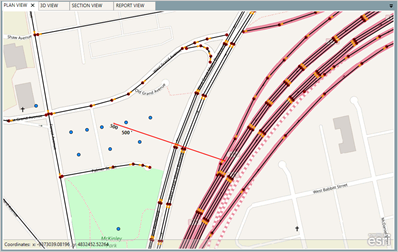
Check that the analysis identifies all impacts and the modeling extends an adequate distance from the road. The distance needed to identify all impacts will vary from project to project. The impact distance for arterial widening projects may only be a couple of hundred feet while the impact distance for a new alignment project may be well beyond 500 feet. Similarly, the modeling should extend an adequate distance to ensure all benefits are identified if a barrier is evaluated. This distance varies by locations and may depend on the specific requirements of the noise barrier design process. The reviewer can use the measurement tool to determine the distance from the receivers to the nearest lane.
SHAs have some flexibility in defining substantial increase, although FHWA requires the minimum value to be between 5 and 15 dB.
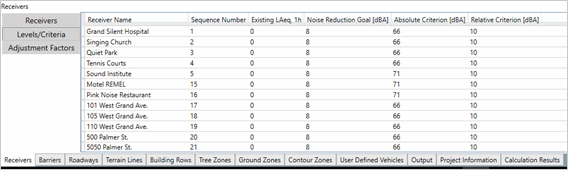
Check that the NAC are correct for modeled receivers, the Noise Reduction Design Goal are set per the SHA noise policy, and the threshold for Substantial Increase is set per the SHA noise policy.
Check the "Levels/Criteria" data in the receiver Object Details Pane or receivers report to ensure that the values for all State-specific criteria are properly identified. These criteria include the values for:
FHWA recommends modeling each lane separately.
The TNM project should include modeled roadways for existing and proposed lanes. One TNM roadway may represent multiple lanes. However, FHWA recommends modeling each lane separately for more accurate results (FHWA FAQ). NCHRP Report 791 provides additional details on input of TNM roadways.
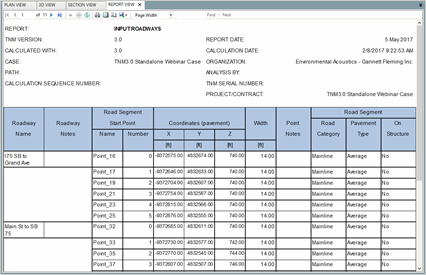
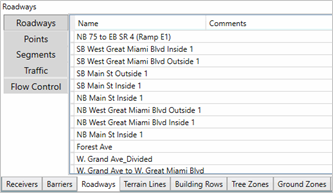
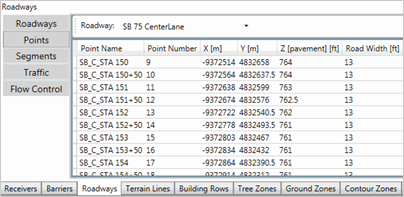
The reviewer can enable the roadway layer (Figure 2-14), review the plan view, and check roadway data in the Object Details Pane or roadways report (Figure 2-15). The reviewer can save and export the roadway report to Excel, Word and PDF to check coordinates and other object details.
Verify assignment of roadway names.
Verify that roadways have unique names that also indicate direction of travel (i.e. Main Street Eastbound) (Figure 2-16).
Check linkage of roadway point names to stationing.
It is recommended to tie the names of roadway points to the project stationing to provide a link to the project design plans (Figure 2-17). It is recommended that the direction and lane are added to the name of roadway points.
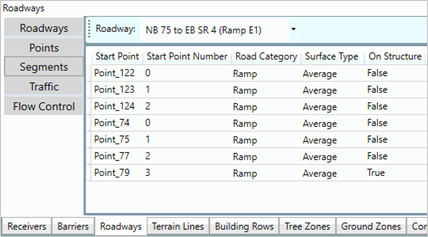
Verify modeled roadway categories and pavement types.
TNM 3.0 includes three categories of roads: mainline, ramp and shoulder. Check the assignments in the roadway Object Details Pane or the roadways report.
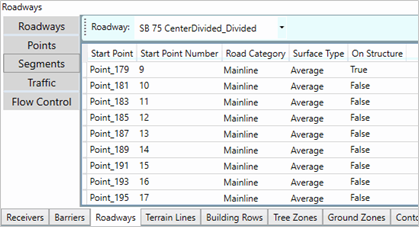
FHWA must approve a pavement type other than "Average" for modeling future conditions.
Check the roadways report for road category and pavement type. TNM currently allows the user to select from four pavement types: Dense-graded asphalt concrete (DGAC), open-graded asphalt concrete (OGAC), Portland cement concrete (PCC), and an average pavement type. An average pavement is a pavement type consisting of Reference Energy Mean Emission Levels (REMEL) data measured on DGAC and PCC pavements combined. Use "average" pavement in nearly all situations. FHWA allows the use of other pavement types for TNM validation purposes only.
If the roadway is super-elevated, use separate, slightly overlapping roadways with changing elevations to approximate the cross-slope. (FHWA FAQ)
Check modeling of roadway shoulders.
FHWA recommends modeling shoulders as roadways with no traffic (FHWA FAQ) when roads are super-elevated and to ensure that the intervening ground is modeled as pavement and that the edge of the roadway is modeled accurately. The NCHRP 791 report also recommended modeling shoulders as separate roadways. Increasing the width of the near roadway is also acceptable and does not require modeling additional roadway.
HOV and Truck restricted lanes should be reviewed to ensure trucks are not assigned to these lanes.
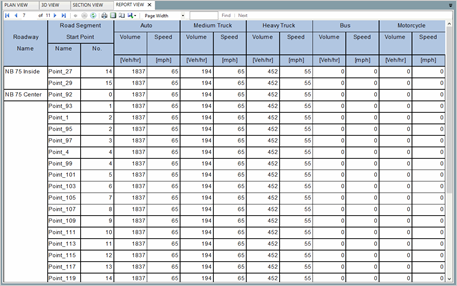
Check assignment of traffic volumes and speeds to all applicable roadway segments.
Check the roadways Object Details Pane (Figure 2-20) or roadways report (Figure 2-21) to ensure traffic and speeds are assigned correctly. Confirm that traffic volumes and speeds are added for each vehicle category and vehicle speed is assigned for each category.
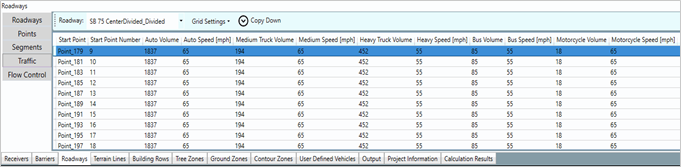
Check speeds do not exceed 75 mph when modeling heavy trucks on roadways with grades greater than 1.5%.
Traffic control devices are not shown in the plan or 3D views.
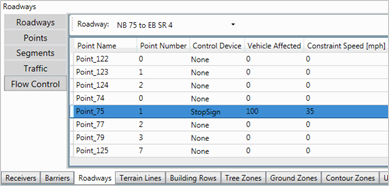
Check that traffic control devices are accurately modeled.
Check roadways Object Details Pane or roadways report to determine if roadway traffic flow control devices (i.e. stop sign, traffic signal, Toll Barrier and On Ramp) are entered correctly. In addition, verify that traffic flow control devices are checked for percent of vehicles affected (for example a stop sign affects 100% of vehicles, but a stoplight may only affect 30% of all vehicles) and constrained speed from decelerating and accelerating. TNM 3.0 allows the analyst to add a traffic control at any point on the road and there is no need to break the road into two roadways and place the traffic control device at the beginning of the second roadway as was previously done with TNM 2.5.
TNM does not model true deceleration, however it can be achieved by breaking a roadway into multiple segments with decreasing speeds.
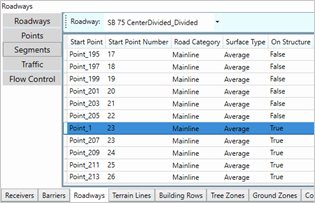
Check that roadways on structure are modeled correctly.
Check that roadways are on structure in the Object Details Pane or roadways report. Structures can be solid, such as a fill embankment, or hollow underneath, such as a bridge. Improper modeling of these roadways can affect the noise propagation paths and alter the noise impact and abatement results.
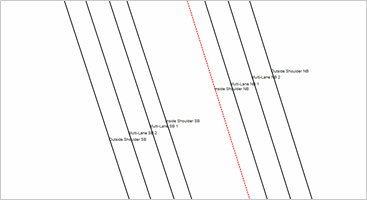
Check that multi-lane highways are modeled correctly.
Check that multi-lane highway widths are correct and that inside and outside shoulders are modeled. Confirm that traffic is not assigned to the shoulders.
Check that roadway elevations are added correctly
FHWA recommends matching horizontal curves within plus or minus 6 feet and vertical curves within plus or minus 1 foot. Check elevations by opening section and 3D views and checking elevations in the roadways Object Details Pane or roadway report.

Multiple small buildings, such as a row of houses, act as multiple small barriers with gaps in between. The TNM Building Row input simulates a row of houses as a single long barrier, not with gaps, but with a low transmission loss uniformly along the row, reducing sound levels at receivers behind it.
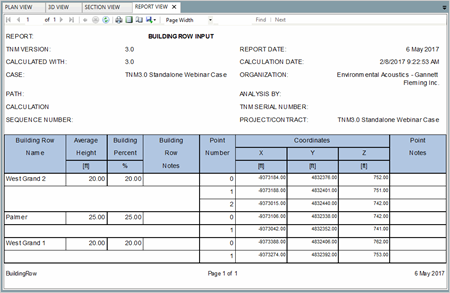
The reviewer can enable the building rows layer (Figure 2-26), review the plan view, and check building rows data in the Object Details Pane or building rows report (Figure 2-27).
Building rows should only be used when the gaps along a building row is less than 80 percent. If your building percentage is greater than this, input a noise barrier instead of a building row. Furthermore, TNM does not account for the actual location of gaps along a building row. For this reason, if you wish more precise results, you must input each individual building structure as a separate TNM barrier.
Confirm that buildings rows are modeled in manner consistent with FHWA guidance.
Confirm that the modeled building rows are shown in the building rows layer. Verify that they are placed in appropriate areas and in the correct locations if the SHA has guidance on it (at the front face of existing receptors, through the center of existing receptors, or at the back face of existing receptors). Typically building rows are placed at the front face of existing receptors.
Check that buildings row names are assigned.
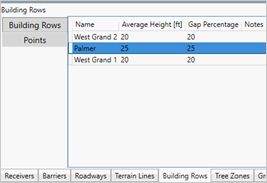
Check that building rows have unique names that indicate location (i.e. street name). Figure 2-28 shows the building rows input data.
Check that building row elevations are correct.
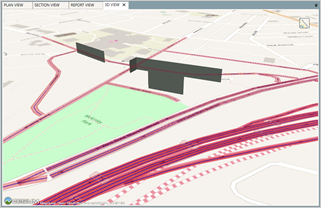
Check the elevations by opening section and 3D views (Figure 2-29) and checking elevations in the building rows Object Details Pane or building rows report.
Input a noise barrier instead of a building row, when building percentage greater than 80 percent.
Check that building row heights and building percentages are correctly modeled.
Check the entered data in the building rows Object Details Pane or building rows report. Verify that building rows have assigned heights as shown in Figure 2-29.
TNM treats a building row like a barrier with a uniform transmission loss (the model allows percentages between 20 and 80) and does not account for the effect of individual gaps.
NCHRP 791 report evaluated TNM sensitivity to building row height, percentage and orientation. The report also addressed the effects of modeling individual buildings as fixed height barriers instead of using building rows.
Modeling individual residences as fixed-height barriers yielded lower levels than modeling building rows. The building barrier approach provided better agreement with measured sound levels than building row approach due to the sensitivity to actual gaps in the building row.
Check that building row elevations are correct.
Check 3D view and building rows Object Details Pane to ensure that building rows are modeled correctly.
Terrain lines should generally be modeled parallel to the primary roadway and no closer than 4 feet apart.
TNM terrain lines define where the terrain is located, horizontally and vertically. A terrain line reduces sound levels when it breaks the line-of-sight between a roadway and a receiver. Terrain lines below the line-of-sight generally reduce ground attenuation and increase sound levels. Terrain lines may represent elevation contours, but can also represent the bottom and top of slopes and drainage channels among other surface topography.
TNM terrain lines define where the terrain is located horizontally and vertically. The TNM User's Guide states that typical terrain lines might include:
The reviewer can enable the terrain line layer (Figure 2-30), review the plan view, and check terrain line data in the Object Details Pane or terrain lines report (Figure 2-31).

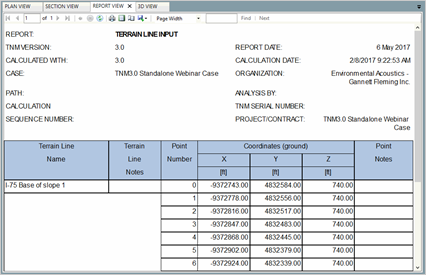
Verify that the model includes significant terrain features.
Review the plan view to see any modeled terrain lines and check the associated input data in the terrain lines Object Details Pane or terrain lines report. Modeled terrain should try to match the actual terrain where it varies by more than 5 feet vertically and 4 feet horizontally as noted above. Models that include terrain that is different from what exists in the field will produce erroneous results. Terrain lines can, and sometimes should, be used in conjunction with ground zones - for example a lake ground zone, surrounded by a terrain line to show the ground elevation denoting the shoreline area.
Because TNM cuts sections from receivers to roadways when calculating sound levels, terrain lines should generally be modeled parallel to the primary roadway. NCHRP 791 evaluated terrain lines and recommended that terrain lines also be used to model the ground beneath structure roadways. NCHRP Report 791 provides additional details on input of TNM terrain lines.
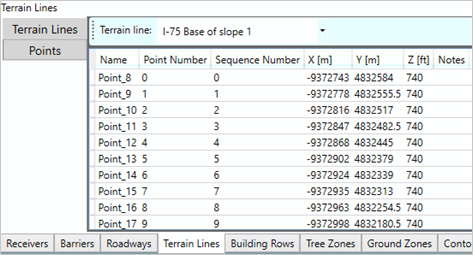
Verify that terrain lines names are assigned.
Verify that terrain lines have unique names that provide some indication of location (i.e. ditch, top of cut) (Figure 2-32).
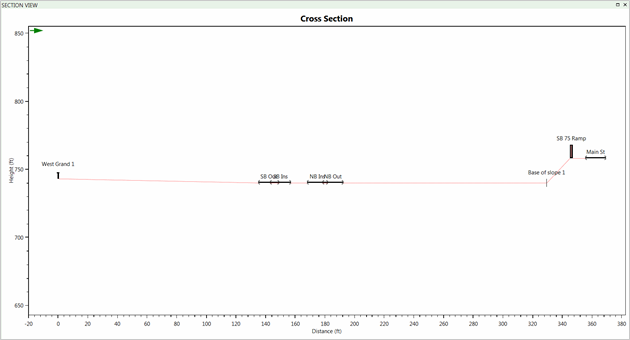
Check that terrain lines elevations are correct.
Check section view (Figure 2-33) and terrain lines Object Details Pane to ensure that terrain lines are modeled correctly and reflect real world conditions as they are, and as they are expected to be.
Avoid overlapping or matching edges with the adjacent roadways when adding a ground zone median.
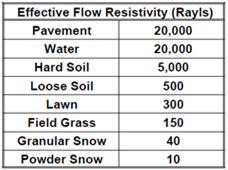
The properties of the intervening ground affect sound levels. Some previous models assumed that sound propagating over a "hard" surface, such as pavement, decreases at 3 dB per doubling of distance while sound propagating over a "soft" surface, such as lawn, decreases at 4.5 dB per doubling of distance. Sound propagation is more complicated and changes with distance and surface characteristics. TNM includes the eight different ground types shown in Figure 2-34.
The minimum recommended median width is 10 feet.
The NCHRP 791 report includes an expanded list of ground types, which can be used as the basis for "custom" ground zones within TNM. This may be especially important for model validation.
The reviewer can enable the ground zone layer (Figure 2-35), review the plan view, and check ground zone data in the Object Details Pane or ground zones report (Figure 2-36).
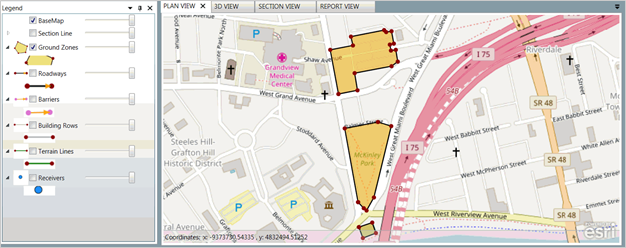
Use ground zones only where the ground differs from the default ground type.
Check that model includes significant ground zones.
Check that the model includes ground zones to represent existing and/or proposed areas that are different from the default ground type for the model. The default ground type is typically set to "Hard Soil."
NCHRP 791 concluded that ground zones are not needed for small areas and that the ground zones need to comprise 20% of the distance between the road and the receiver to change sound levels my one dB or more.
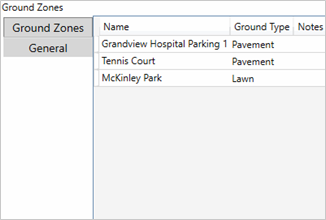
Check that ground zone names and types are correctly assigned.
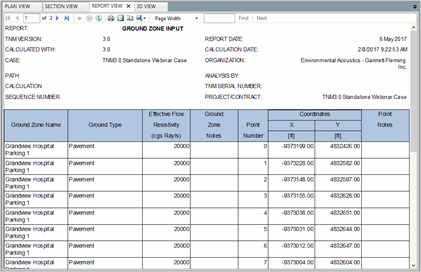
Check that ground zone input data in the ground zones Object Details Pane (Figure 2-37) or ground zones report.
A ground zone is required to define the type of ground inside tree zones.
A model may include tree zones that meet FHWA's policy which states that trees must be "sufficiently dense to completely block the view along the propagation path. This requires dense undergrowth as well as dense tree-top foliage. Do not include a TNM tree zone unless its vegetation is sufficiently dense."
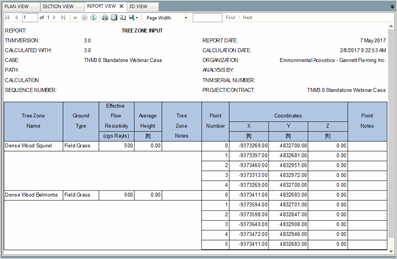
The reviewer can enable the tree zone layer (Figure 2-38), review the plan view, and check tree zone data in the Object Details Pane or tree zones report (Figure 2-39). The reviewer should check if another ground type other than the default is required. A ground zone is required to define the type of ground inside tree zones. For example, if you are using a tree zone, surround the tree zone with a ground zone of Loose Soil to account for the ground effects of that tree zone.
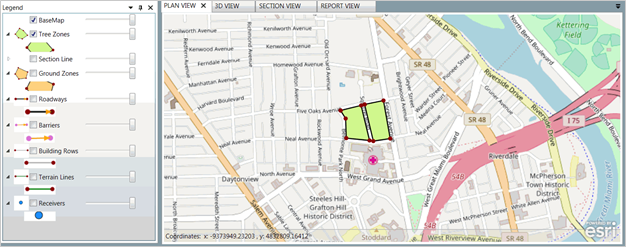
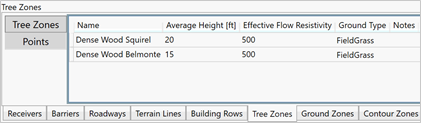
Confirm that model includes tree zones and that they meet FHWA's definition.
FHWA policy states that tree zones should consist of long, wide regions of heavy, non-deciduous woods and undergrowth, not just individual trees or several rows of trees.
Review the plan view (Figure 2-38) to see any modeled tree zones and check the associated input data in the tree zones Object Details Pane or tree zones report. Verify that existing and/or proposed tree zones meet FHWA's tree zone definition. If the model includes a tree zone(s) for future conditions, then there should be a reasonable expectation that the trees will still exist at that time. Use of tree zones in the future should be explained in the Noise Study Report during the discussion of land uses.
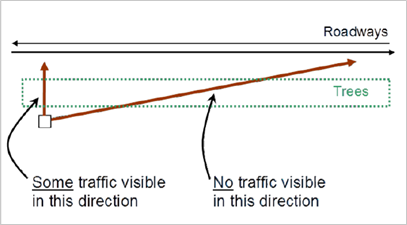
Narrow tree zones (up to 50 feet) typically provide no noise reduction to the nearest portions of a roadway. However, omitting these narrow tree zones could increase the length of a barrier due since there may be a significant distance through the tree zone at shallow angles as shown in Figure 2-40.
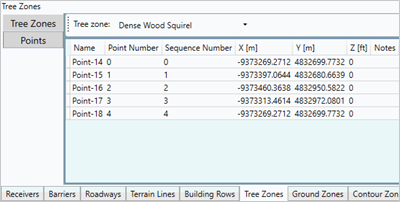
Check assignment of tree zone names and ground types.
Check tree zone input data in the tree zones Object Details Pane (Figure 2-41) or tree zones report.
Verify that the ground type within the tree zone is consistent with what exists. There is no need to model a soft-ground ground zone around the tree zone, though it is not necessarily incorrect to do so and it should not affect the results.
Check accuracy of tree zone elevations.
Check section and 3D views and the tree zone Object Details Pane (Figure 2-42) to ensure that tree zones are modeled correctly. This may involve including terrain lines in and/or around the tree zone in addition to the elevation defined for the tree zone itself.
Verify modeling accuracy of barriers in the TNM project.
Barriers should be minimally 8 times the distance between the barrier and the most-distant receiver, with the receiver centered along the barrier.
The TNM Project should show barriers modeled as equally spaced segments, it is preferable to use 100 feet segments for preliminary noise analysis and 25 -50 feet for final design noise analysis to align with the stationing of the adjacent highway. Please note that this may not match the actual design segments of the barrier which may be 10-20 feet in length. Barriers should be optimized horizontally and vertically to provide optimal design of the noise mitigation.
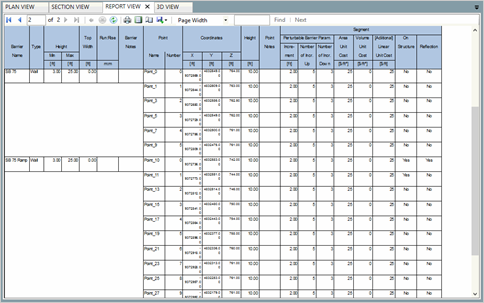
The reviewer can enable the barriers layer (Figure 2-43), review the plan view and check barrier data in the Object Details Pane or barriers report (Figure 2-44).
Check accuracy of barriers heights and perturbation increments.
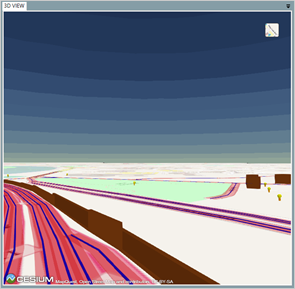
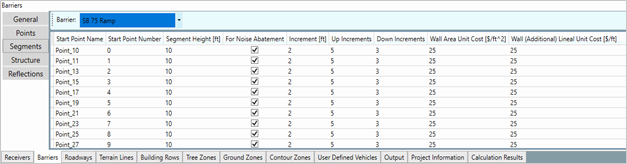
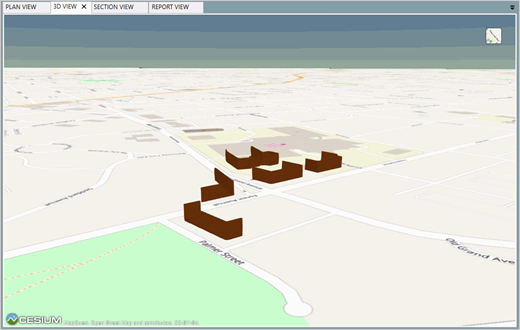
Check 3D view (Figure 2-45) and the barriers Object Details Pane (Figure 2-46) or barriers reports to ensure that barriers heights are modeled correctly and that the number of perturbations was assigned in accordance with the SHA noise policy. Typically, perturbations are set at increments of 2 feet starting from 8 feet and going to the maximum allowable height, usually 20 - 22 feet.
Verify that large buildings are modeled as barriers.
Verify that large buildings are modeled as fixed heights barriers (not for noise abatement) in accordance with FHWA guidance. Check the 3D view (Figure 2-47), the barriers Object Details Pane (Figure 2-48) or the barriers report to ensure that large buildings heights are modeled correctly. Buildings may be modeled based on the front face of the building, or the front and sides as shown below. Modeling the entire building envelope adds processing time without increasing the accuracy of noise level results and is not necessary.
Model Jersey barriers using fixed-height barriers; this applies to both roadside and median jersey barriers.
Check that parapet walls and median barriers are modeled per the noise policy.
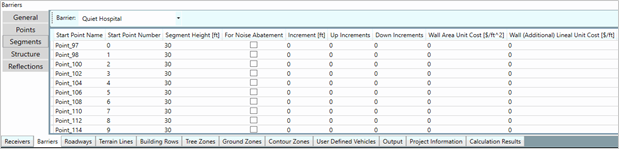
Check that median barriers and parapet walls (Jersey barriers) are modeled as fixed heights barriers (typically 3 or 3.5 feet, as indicated in SHA specifications) in accordance with FHWA guidance. Check the 3D view, the barriers Object Details Pane (Figure 2-49) or the barriers report to ensure that median/jersey barriers heights are modeled correctly
Structure barrier segments may shield both structure roadway segments and non-structure roadway segments.
Check modeling accuracy of barriers on structure.
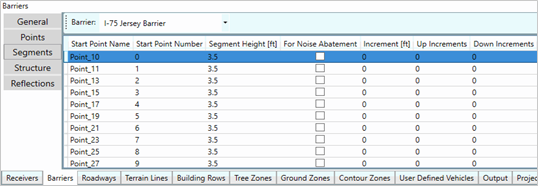
Check the barriers Object Details Pane (Figure 2-50) or the barriers report to ensure that barriers on structured are paired correctly with roadway segments.
Check assignment of barriers reflection surfaces
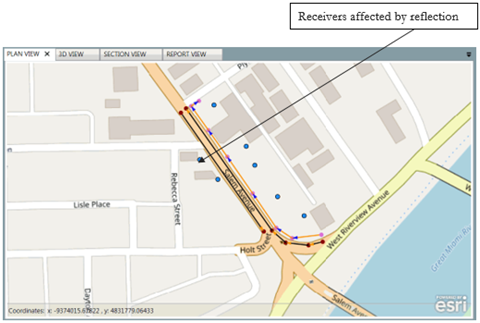
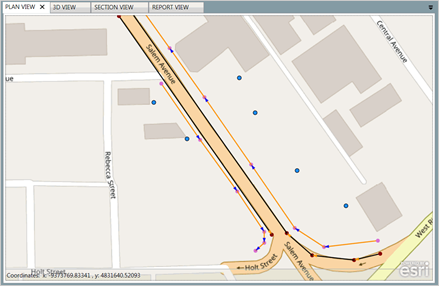
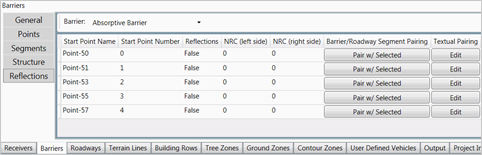
TNM 3.0 includes the ability for receivers on the opposite side of the highway to account for barrier reflection from the highway side (Figure 2-51). Check the barriers Object Details Pane (Figure 2-52) or the barriers report to ensure that barriers reflection are modeled correctly. Where the table shows Reflections as 'True', that is a reflective surface barrier. Where it shows 'False', that is an absorptive surface barrier.
Typically, barriers have a reflective surface unless the SHA noise policy specifies when and how absorptive treatments can be used. Most SHAs that allow use of absorptive materials do so in cases where there are barriers on both sides of the roadway, or where there is a barrier on one side, but the opposite noise-sensitive land uses did not qualify for abatement, or on the back side of a barrier where there is a roadway between the barrier and the receptors - such as a frontage road.
Check parallel barrier analysis
When a roadway is flanked by parallel reflective barriers, retaining walls, or a combination of the two, sound reflects back and forth across the roadway many times before ultimately progressing outwards towards nearby receivers. These multiple reflections increase the sound level at nearby receivers, this noise increase due to reverberation may partially offset the noise reduction due to the barrier construction.
To avoid a reduction in the performance of parallel reflective noise barriers, check the width-to-height ratio (W:H) of the roadway section to the barriers (Figure 2-53). If the W:H is less than 10:1, then parallel barrier analysis is required. When the W:H is between 10:1 and 20:1, then parallel barrier analysis is recommended, but if the W:H is more than 20:1, then parallel barrier analysis is not required.
Check the barriers Object Details Pane (Figure 2-54) to ensure that barriers reflection are modeled correctly. Where the table shows Reflections as 'True', that is a reflective surface barrier. Where it shows 'False', that is an absorptive surface barrier. Check the parallel barrier by clicking on "start section" under the Calculate Section button. Draw a section across the two barriers, then view the results of sound level degradation in the Object Details Pane (Figure 2-55).
Check accuracy of barriers elevation.
Check 3D view (Figure 2-56) and the barriers Object Details Pane to ensure that barriers are modeled correctly. At a minimum, barriers should be tall enough to cut the line of site from a receptor to the roadway. They should also be located close to the roadway (as shown below) or close to the receptors. In the case of an on-ramp or off-ramp, there should be some overlap between a barrier for the mainline and a second barrier for the ramp (as shown in Figure 2-56)
The following Specific Projects are representative of more widely used project types and of the common modeling errors associated with them. Recently, roundabouts are more commonly recommend by highway engineers as an alternative solution to un-signalized intersections. In addition, signalized and unsignalized intersection projects are more common nowadays as more states are developing projects on local arterial roadways to accommodate increasing traffic volumes.
Roundabouts have become a more and more common design feature for regular intersections and for highway entrance and exit termini in the last 15 years. A modern roundabout is characterized by a generally circular shape with counterclockwise flow, a single lane or multiple lanes and use of yield signs at the entries rather than stop signs or signals. The main issue with roundabouts is finding a level of detail in modeling that achieves accurate results while avoiding over-modeling that does not improve the results. Modeling roundabouts is challenging as there is need to correctly account for vehicles accelerating and decelerating during the approach and departure from the roundabouts.
FHWA TNM computes the acoustical effect of acceleration as vehicles pull away from traffic-control devices such as stop signs, toll booths/barriers, and traffic signals, and also along highway entrance ramps. FHWA TNM calls roadways with traffic-control devices "flow control" or "interrupted flow" roadways. An interrupted flow roadway is designated by choice of a "Control Device" in the FHWA TNM Roadway Input dialog box. When this choice is made, the modeler-supplied speeds on the traffic tab of the roadway input dialog box are treated by FHWA TNM as the final speeds that vehicles will try to reach during their acceleration. The modeler provides a starting speed for all traffic on the roadway, called the "speed constraint," which would be zero for a stop sign, but which could be non-zero for an entrance ramp, as an example. The modeler also provides a percentage from 0 to 100% for "vehicles affected," which, in the case of a control device such as an entrance ramp, results in a percentage of the traffic to experience acceleration, while the remaining percentage is modeled as cruising along the roadway at the modeler-provided speeds.
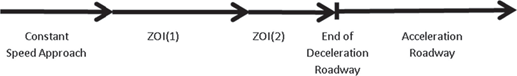
FHWA TNM has no built-in function for modeling deceleration. NCHRP Report 311 defined two "zones of influence" (ZOIs) to represent the last two segments of a roadway being used to model deceleration, as illustrated in Figure 3-1. The reviewer should check NCHRP Report 791 for guidelines on the lengths of these segments, as a function of approach speed, and "equivalent speeds" to use for each vehicle type on each segment. Generally, the noise analyst reduces the modeled speed as the vehicles approach the roundabout.
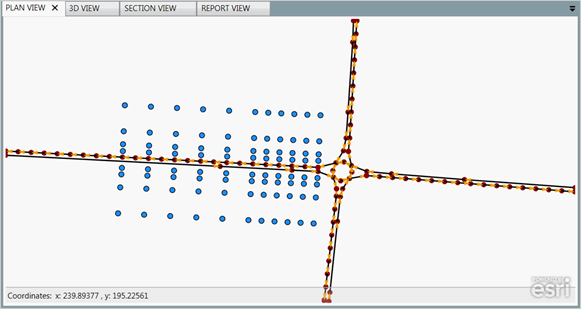
The screenshots shown below are meant as an example (Figure 3-2) to illustrate how the reviewer should check the modeling of a roundabouts. The receivers were modeled only on one side to speed the model runtime.
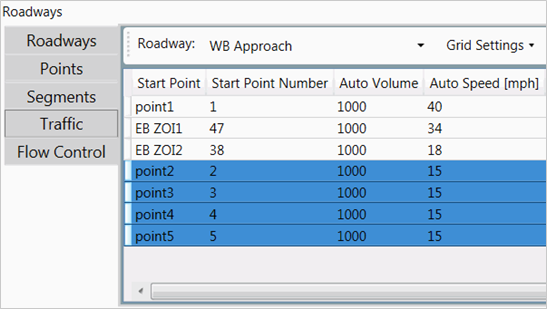
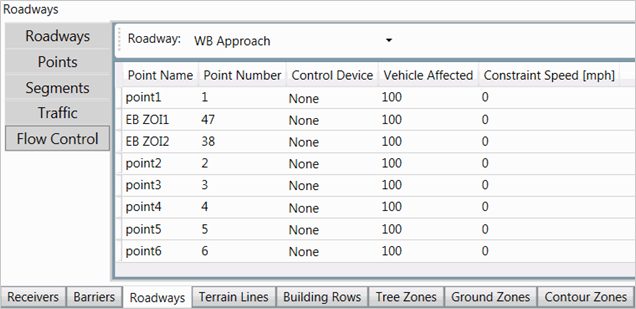
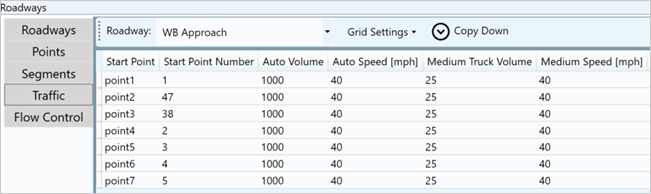
NCHRP 791 recommends modeling an approach and departure legs for each roadway. Check the approach leg (deceleration) is modeled by a constant speed (highlighted) equal to the posted speed up to the beginning of the roundabout as shown in Figure 3-3. Verify there is no flow control applied for the approach leg as shown in Figure 3-4.
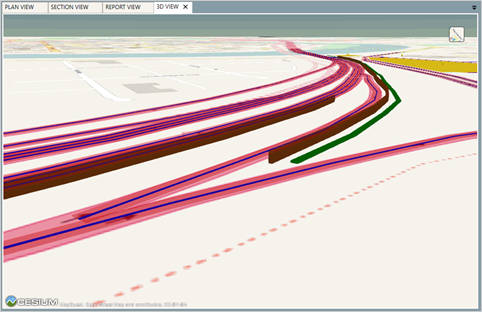
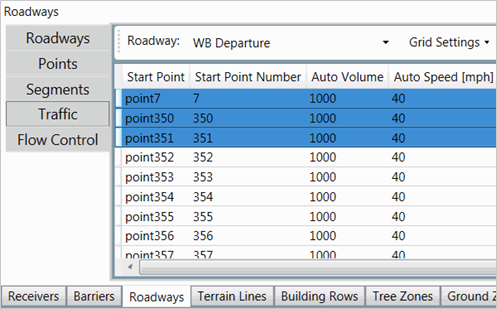
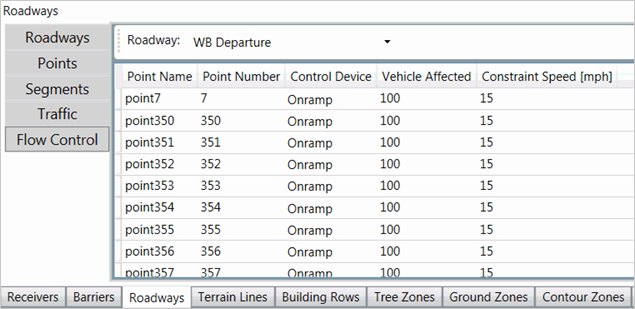
Check the departure leg (accelerated) is modeled by constant-speed (posted speed) roadway that will start at the exit point from the roundabout as shown in Figure 3-5. Verify that a flow control acceleration roadway would be modeled from the exit point from the roundabout to the end of the modeled site as shown in Figure 3-6. Check the roadway have a "Speed Constraint" (starting speed) and 100% vehicles affected with the posted or operating speed.
The main issue with unsignalized intersections is over-modeling or micro-modeling without any improvement in the accuracy of the results. The converse issue would be under-modeling and missing potentially important effects on received sound levels, particularly the effects of accelerating vehicles, when noise-sensitive receptors are nearby.
FHWA TNM computes the acoustical effect of acceleration as vehicles pull away from traffic-control devices such as stop signs. FHWA TNM calls roadways with traffic-control devices "flow control" or "interrupted flow" roadways. An interrupted flow roadway is designated by choice of a "Control Device" in the FHWA TNM Roadway Input dialog box. When this choice is made, the modeler-supplied speeds on the traffic tab of the roadway input dialog box are treated by FHWA TNM as the final speeds that vehicles will try to reach during their acceleration. The modeler provides a starting speed for all traffic on the roadway, called the "speed constraint," which would be zero for a stop sign. The modeler also provides a percentage from 0 to 100% for "vehicles affected," which, in the case of a control device such as a stop sign will result in 100% of the traffic to experience acceleration.
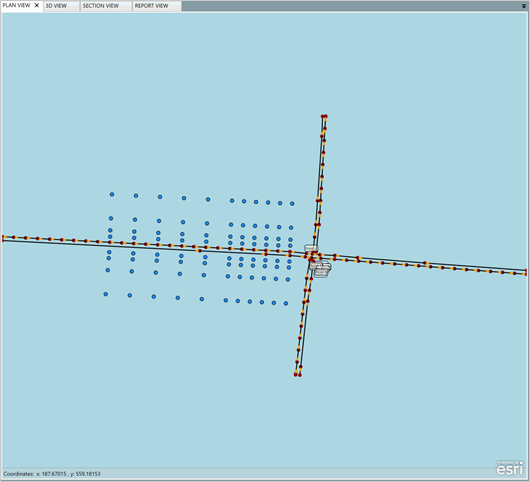
The screenshot in Figure 3-7 illustrates how the reviewer should check the accuracy of an unsignalized intersection project. The receivers were modeled only on one side to speed the model runtime.

For modeling unsignalized intersection, NCHRP 791 recommends to partially model the movements of one of the roads and avoid all of the intersecting FHWA TNM points. In this case, model the road with the most traffic (or perhaps the most adjacent receivers) as continuous, while the cross road (lesser traffic) will be modeled as an approach and departure leg. There is no need for modeling of reduced speeds for deceleration unless the posted speed is high because of the dominance of noise from the percentage of traffic cruising through the stop sign and the percentage of traffic accelerating from a stopped condition on the departure leg of the intersection.
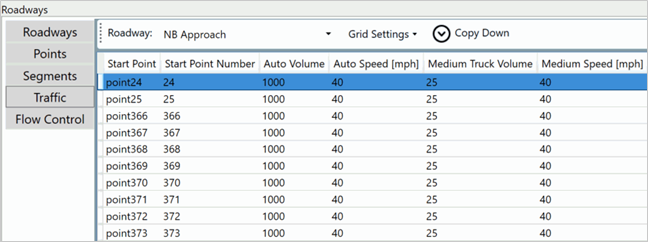
Check that the roadway with more traffic is modeled with the posted speed on the approaching leg Figure 3-8) and connected at the stop line to a flow control acceleration roadway that crosses through the intersection and proceeds on the departing leg. Verify that the flow control on the departure leg roadway would have a "Speed Constraint" (starting speed) of 0 mph and 100% vehicles affected as shown in Figure 3-9.
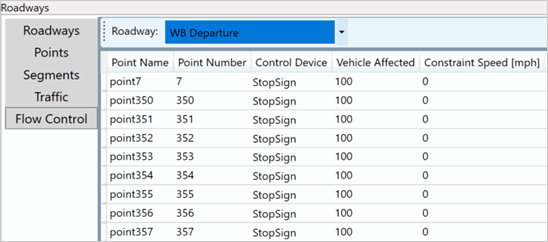
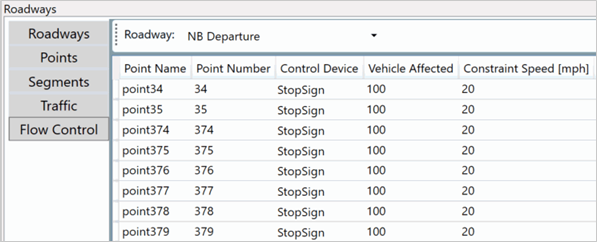
Check that the roadway with lesser traffic is modeled by a constant-speed (posted speed) on the approach leg, as shown in Figure 3-10. Verify that the departing leg is modeled by a flow control acceleration roadway starting just past the main roadways using 100% vehicles affected and a "Speed Constraint" (starting speed) of 20 mph to represent speed as the vehicles exit the intersection, as shown in Figure 3-11.
The main issue with signalized intersections is over-modeling or micro-modeling without any improvement in the accuracy of the results. The converse issue would be under-modeling and missing potentially important effects on received sound levels, particularly the effects of accelerating vehicles, when noise-sensitive receptors are nearby.
FHWA TNM computes the acoustical effect of acceleration as vehicles pull away from traffic-control devices such as traffic signals. FHWA TNM calls roadways with traffic-control devices "flow control" or "interrupted flow" roadways. An interrupted flow roadway is designated by choice of a "Control Device" in the FHWA TNM Roadway Input dialog box. When this choice is made, the modeler-supplied speeds on the traffic tab of the roadway input dialog box are treated by FHWA TNM as the final speeds that vehicles will try to reach during their acceleration. The modeler provides a starting speed for all traffic on the roadway, called the "speed constraint," which would be zero for a traffic signal. The modeler also provides a percentage from 0 to 100% for "vehicles affected," which, in the case of a control device such as a stop sign will result in 100% of the traffic to experience acceleration.
The screenshots shown below are meant as an example (Figure 3-12) to illustrate how the reviewer should check the accuracy of a signalized intersection project. The receivers were modeled only on one side to speed the model runtime.
For modeling signalized intersection, NCHRP 791 recommends to partially model the movements of one of the roads and avoid all the intersecting FHWA TNM points. In this case, model the road with the most traffic (or perhaps the most adjacent receivers) as continuous, while the cross road (lesser traffic) will be modeled as an approach and departure leg. There is no need for modeling of reduced speeds for deceleration unless the posted speed is high because of the dominance of noise from the percentage of traffic cruising through the signal and the percentage of traffic accelerating from a stopped condition on the departure leg of the intersection.
Check that the roadway with more traffic is modeled with the posted speed on the approaching leg (Figure 3-13) and connected at the stop line to a flow control acceleration roadway that crosses through the intersection and proceeds on the departing leg. Verify that the flow control on the departure leg roadway would have a "Speed Constraint" (starting speed) of 0 mph and 50% vehicles affected as shown in Figure 3-14.
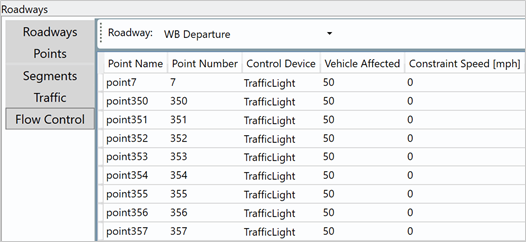
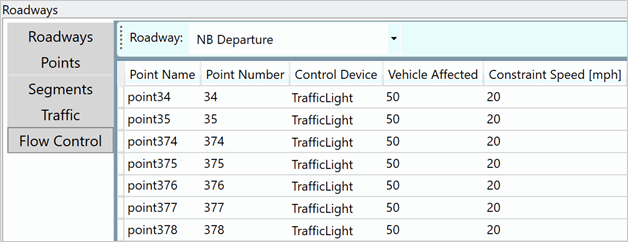
Check that the roadway with lesser traffic is modeled by a constant-speed (posted speed) on the approach leg, as shown in Figure 3-15. Verify that the departing leg is modeled by a flow control acceleration roadway starting just past the main roadways using 50% vehicles affected and a "Speed Constraint" (starting speed) of 20 mph to represent speed as the vehicles exit the intersection, as shown in Figure 3-16.
This section identified challenges in TNM 3.0 analysis and common problems that TNM reviewer need to confirm that have been conducted for any noise analysis.
| TNM Object | Issue |
|---|---|
| Roadways |
|
Traffic |
|
Receivers |
|
Barriers |
|
Building Rows |
|
Terrain Lines |
|
Ground Zones |
|
Tree Zones |
|
[1] Procedures for Abatement of Highway Traffic and Construction Noise, 23 CFR 772, Federal Highway Administration, July 2010.
[2] Highway Traffic Noise: Analysis and Abatement Guidance, Federal Highway Administration, December 2011.
[3] NCHRP Report 791 Supplemental Guidance on the Application of FHWA's Traffic Noise Model (TNM).
[4] FHWA Highway Traffic Noise, https://www.fhwa.dot.gov/Environment/noise/.
| Project Information | |
|---|---|
| Project | |
| Jurisdiction | |
| Project Number | |
| Project Plans and Date | |
| Traffic Data Source and Date | |
| TNM Model Information | |
| TNM Project Name | |
| Year | |
| Alternative | |
| Filename/Location | |
| Review Information | |
| Reviewer | |
| Date Review Completed | Click here to enter a date. |
| Input | Question | N/A | Yes? | Notes for Guide |
|---|---|---|---|---|
| Project Settings Section 2.2 | Is the basic setup information complete? | ☐ | ☐ | |
| Receivers Section 2.5 | Are receivers named? | ☐ | ☐ | Review plan view. Check receiver object details pane or receiver report. Can also export report. |
| Are the numbers of dwelling units set correctly for each receiver? | ☐ | ☐ | Check receiver object details pane or receiver report. Can also export report. | |
| Are the receiver elevations correct? | ☐ | ☐ | Check 3D and section views. Check receiver object details pane or receiver report. Can also export report. | |
| Is the height above ground accurate for modeled upper-floor receivers? | ☐ | ☐ | Same as above | |
| Are enough receivers modeled to account for impacts and benefits? | ☐ | ☐ | Review plan view, 3D view, and use measurement tool. | |
| Are the NAC correct for the modeled receivers? | ☐ | ☐ | Check receiver object details pane or receiver report. | |
| Is the Noise Reduction Design Goal set per the noise policy? | ☐ | ☐ | Same as above | |
| Is the threshold for Substantial Increase set per the noise policy? | ☐ | ☐ | Same as above | |
| Roadways Section 2.6 | Are roadway names assigned? | ☐ | ☐ | Check plan view, roadway object details pane, or roadway report. Can also export report. |
| Are modeled roadway categories correct? | ☐ | ☐ | Check roadway object details pane or roadway report. Can also export report. | |
| Are the modeled pavement types correct? | ☐ | ☐ | Check roadway object details pane or roadway report. Can also export report. | |
| Are the roadway elevations correct? | ☐ | ☐ | Check 3D and section views. Check roadway object details pane or roadway report. Can also export report. | |
| Are the widths of roadway segments correct? | ☐ | ☐ | Same as above. Also Check 3D view and cut section views. | |
| Are traffic volumes and speeds assigned to all applicable roadway segments? | ☐ | ☐ | Check roadway object details pane or roadway report. Can also export report. | |
| Are traffic control devices modeled accurately (traffic lights, stop signs, on-ramps, toll booths)? | ☐ | ☐ | Check object details pane for flow control (Note: not shown in any view, or roadway/traffic reports); need to know how TNM handles this to give better guidance | |
| Are roadways on structure modeled accurately? | ☐ | ☐ | Select segment in plan view, find in object details pane | |
| Building Rows Section 2.7 | Are building rows modeled? | ☐ | ☐ | Review plan view. |
| Are the building row elevations correct? | ☐ | ☐ | Check 3D and section views. Check building row object details pane or building row report. Can also export report. | |
| Do the building row heights and building percentages appear to be correct? | ☐ | ☐ | Same as above. | |
| Terrain Lines Section 2.8 | Does the model include significant terrain features? | ☐ | ☐ | Review plan, 3D and sections views. |
| Are the terrain line elevations correct? | ☐ | ☐ | Check 3D and section views. Check terrain line object details pane or building row report. Can also export report. | |
| Ground Zones Section 2.9 | · Does the model include significant ground zones? | ☐ | ☐ | Review plan view. |
| Are the ground zone types assigned correctly? | ☐ | ☐ | Check ground zone object details pane or ground zone report. | |
| Tree Zones Section 2.10 | Does the model include tree zones? | ☐ | ☐ | Review plan view. |
| Are modeled tree zones likely to exist in the design year? | ☐ | ☐ | Check with project planners | |
| · Are tree zone names assigned? | ☐ | ☐ | Check plan view, tree zone object details pane, or tree zone report. Can also export report. | |
| Do the tree zone elevations appear to be correct? | ☐ | ☐ | Check 3D and section views. Check tree zone object details pane or tree zone report. Can also export report. | |
| Barriers Section 2.11 | Are barrier names assigned? | ☐ | ☐ | Check plan view, barrier object details pane, or barrier report. Can also export report. |
| Are barrier reflection surfaces assigned as appropriate? | ☐ | ☐ | Check barrier object details pane or barrier report. Need to check NRCs and pairings. | |
| Are barriers on structure modeled accurately and are the shielded lists correct? | ☐ | ☐ | Check barrier object details pane or barrier report. | |
| Fixed Height Barriers (Buildings, Parapet Walls, Median Barriers) | ||||
| Are large buildings modeled? | ☐ | ☐ | Check plan and 3D views. | |
| Are parapet walls, median barriers, etc. modeled per the noise policy? | ☐ | ☐ | Check plan and 3D views. | |
| Are the barrier heights correct? | ☐ | ☐ | Check plan and 3D views. Check barrier object details pane or barrier report. | |
| Proposed Barriers | ||||
| Are the proposed barriers modeled at the most acoustically effective location? | ☐ | ☐ | Check multiple section views. | |
| Are the barrier point names tied to stationing? | ☐ | ☐ | Review plan view. | |
| Are the barrier elevations correct? | ☐ | ☐ | Check 3D and section views. Check barrier object details pane or barrier report. Can also export report. | |
| Are the barrier heights, perturbation increment, and number of perturbations assigned in accordance with the noise policy? | ☐ | ☐ | Check barrier object details pane or barrier report. Can also export report. | |

