

Comprehensive Design Example for Prestressed Concrete (PSC) Girder Superstructure Bridge
Design Step 5 Design of Superstructure
Design Step 5.3 - Unfactored and Factored Load Effects
Design Step 5.3.1
Summary of loads
The dead load moments and shears were calculated based on the loads shown in Design Step 5.2. The live load moments and shears were calculated using a generic live load analysis computer program. The live load distribution factors from Design Step 5.1 are applied to these values.
Table 5.3-1 - Summary of Unfactored Moments
Interior girder, Span 1 shown, Span 2 mirror image
| Location* (ft.) |
Noncomposite | Composite | Live Load + IM | ||||||
|---|---|---|---|---|---|---|---|---|---|
| Girder | Slab and Haunch (k-ft) |
Exterior Diaphragm (k-ft) |
Total Noncomp. (k-ft) |
Parapet (k-ft) |
FWS (k-ft) |
Positive HL-93 (k-ft) |
Negative HL-93 (k-ft) | ||
| ** (k-ft) |
*** (k-ft) | ||||||||
| 0 | 47 | 0 | 0 | 0 | 0 | 0 | 0 | 0 | 0 |
| 1.0 | 108 | 61 | 62 | 3 | 125 | 9 | 12 | 92 | -11 |
| 5.5 | 368 | 322 | 325 | 14 | 661 | 46 | 62 | 476 | -58 |
| 11.0 | 656 | 609 | 615 | 28 | 1,252 | 85 | 114 | 886 | -116 |
| 16.5 | 909 | 863 | 871 | 42 | 1,776 | 118 | 158 | 1,230 | -174 |
| 22.0 | 1,128 | 1,082 | 1,093 | 56 | 2,230 | 144 | 193 | 1,509 | -233 |
| 27.5 | 1,313 | 1,267 | 1,279 | 70 | 2,616 | 164 | 220 | 1,724 | -291 |
| 33.0 | 1,464 | 1,417 | 1,432 | 84 | 2,933 | 177 | 237 | 1,882 | -349 |
| 38.5 | 1,580 | 1,534 | 1,549 | 98 | 3,181 | 183 | 246 | 1,994 | -407 |
| 44.0 | 1,663 | 1,616 | 1,633 | 111 | 3,360 | 183 | 246 | 2,047 | -465 |
| 49.5 | 1,711 | 1,664 | 1,681 | 125 | 3,471 | 177 | 237 | 2,045 | -523 |
| 54.5 | 1,725 | 1,679 | 1,696 | 138 | 3,512 | 165 | 222 | 2,015 | -576 |
| 55.0 | 1,725 | 1,678 | 1,695 | 137 | 3,511 | 164 | 220 | 2,010 | -581 |
| 60.5 | 1,705 | 1,658 | 1,675 | 123 | 3,456 | 144 | 194 | 1,927 | -640 |
| 66.0 | 1,650 | 1,604 | 1,620 | 109 | 3,333 | 118 | 159 | 1,794 | -698 |
| 71.5 | 1,562 | 1,515 | 1,531 | 95 | 3,141 | 86 | 115 | 1,613 | -756 |
| 77.0 | 1,439 | 1,392 | 1,407 | 81 | 2,880 | 46 | 62 | 1,388 | -814 |
| 82.5 | 1,282 | 1,236 | 1,248 | 67 | 2,551 | 1 | 1 | 1,124 | -872 |
| 88.0 | 1,091 | 1,044 | 1,055 | 53 | 2,152 | -52 | -69 | 825 | -1,124 |
| 93.5 | 865 | 819 | 827 | 39 | 1,686 | -110 | -148 | 524 | -1,223 |
| 99.0 | 606 | 560 | 565 | 25 | 1,150 | -176 | -236 | 297 | -1,371 |
| 104.5 | 312 | 266 | 268 | 11 | 546 | -248 | -332 | 113 | -1,663 |
| 108.0 | 110 | 61 | 62 | 3 | 125 | -297 | -398 | 33 | -1,921 |
| 109.0 | 47 | 0 | 0 | 0 | 0 | -311 | -418 | 15 | -2,006 |
| Span2-0 | - | 0 | 0 | 0 | 0 | -326 | -438 | 0 | -2,095 |
* Distance from the centerline of the end bearing
** Based on the simple span length of 110.5 ft. and supported at the ends of the girders. These values are used to calculate stresses at transfer.
*** Based on the simple span length of 109 ft. and supported at the centerline of bearings. These values are used to calculate the final stresses.
Table 5.3-2 - Summary of Factored Moments
Interior girder, Span 1 shown, Span 2 mirror image
| Location* (ft.) |
Strength I (k-ft) |
Service I ** | Service III ** | ||
|---|---|---|---|---|---|
| NC (k-ft) |
Comp. (k-ft) |
NC (k-ft) |
Comp. (k-ft) | ||
| 0 | 0 | 0 | 0 | 0 | 0 |
| 1.0 | 346 | 125 | 112 | 125 | 94 |
| 5.5 | 1,809 | 661 | 584 | 661 | 488 |
| 11.0 | 3,394 | 1,252 | 1,085 | 1,252 | 908 |
| 16.5 | 4,756 | 1,776 | 1,506 | 1,776 | 1,260 |
| 22.0 | 5,897 | 2,230 | 1,846 | 2,230 | 1,544 |
| 27.5 | 6,821 | 2,616 | 2,108 | 2,616 | 1,763 |
| 33.0 | 7,536 | 2,933 | 2,296 | 2,933 | 1,920 |
| 38.5 | 8,063 | 3,181 | 2,423 | 3,181 | 2,024 |
| 44.0 | 8,381 | 3,360 | 2,477 | 3,360 | 2,067 |
| 49.5 | 8,494 | 3,471 | 2,459 | 3,471 | 2,050 |
| 54.5 | 8,456 | 3,512 | 2,402 | 3,512 | 1,999 |
| 55.0 | 8,440 | 3,511 | 2,394 | 3,511 | 1,992 |
| 60.5 | 8,163 | 3,456 | 2,265 | 3,456 | 1,880 |
| 66.0 | 7,690 | 3,333 | 2,070 | 3,333 | 1,712 |
| 71.5 | 7,027 | 3,141 | 1,813 | 3,141 | 1,490 |
| 77.0 | 6,181 | 2,880 | 1,497 | 2,880 | 1,219 |
| 82.5 | 5,158 | 2,551 | 1,126 | 2,551 | 901 |
| 88.0 | 3,967 | 2,152 | -1,245 | 2,152 | -1,020 |
| 93.5 | 2,664 | 1,686 | -1,481 | 1,686 | -1,237 |
| 99.0 | -1,535 | 1,150 | -1,783 | 1,150 | -1,509 |
| 104.5 | -3,035 | 546 | -2,242 | 546 | -1,910 |
| 108.0 | -4,174 | 125 | -2,616 | 125 | -2,232 |
| 109.0 | -4,525 | 0 | -2,734 | 0 | -2,333 |
| Span 2 - 0 | -4,729 | 0 | -2,858 | 0 | -2,439 |
Load Factor Combinations
| Strength I | = 1.25(DC) + 1.5(DW) + 1.75(LL + IM) |
| Service I | = 1.0[DC + DW + (LL + IM)] |
| Service III | = 1.0(DC + DW) + 0.8(LL + IM) |
* Distance from the centerline of the end bearing
** For service limit states, moments are applied to the section of the girder, i.e. noncomposite or composite, that resists these moments. Hence, noncomposite and composite moments have to be separated for service load calculations.
Table 5.3-3 - Summary of Unfactored Shear
Interior girder, Span 1 shown, Span 2 mirror image
| Location* (ft.) |
Noncomposite | Composite | Live Load + IM | |||||
|---|---|---|---|---|---|---|---|---|
| Girder (k) |
Slab and Haunch (k) |
Exterior Diaphragm (k) |
Total Noncomp. (k) |
Parapet (k) |
FWS (k) |
Positive HL-93 (k) |
Negative HL-93 (k) | |
| 0 | 61.6 | 62.2 | 2.5 | 126.4 | 8.9 | 12.0 | 113.3 | -12.9 |
| 1.0 | 60.5 | 61.1 | 2.5 | 124.1 | 8.7 | 11.7 | 111.7 | -12.9 |
| 5.5 | 55.4 | 55.9 | 2.5 | 113.9 | 7.7 | 10.4 | 104.3 | -13.0 |
| 11.0 | 49.2 | 49.7 | 2.5 | 101.4 | 6.5 | 8.8 | 95.5 | -13.4 |
| 16.5 | 43.0 | 43.4 | 2.5 | 88.9 | 5.4 | 7.2 | 86.9 | -15.9 |
| 22.0 | 36.7 | 37.1 | 2.5 | 76.4 | 4.2 | 5.6 | 78.7 | -20.6 |
| 27.5 | 30.5 | 30.8 | 2.5 | 63.9 | 3.0 | 4.0 | 70.8 | -26.0 |
| 33.0 | 24.3 | 24.6 | 2.5 | 51.4 | 1.8 | 2.4 | 63.1 | -32.8 |
| 38.5 | 18.1 | 18.3 | 2.5 | 38.9 | 0.6 | 0.8 | 55.9 | -39.8 |
| 44.0 | 11.9 | 12.0 | 2.5 | 26.4 | -0.6 | -0.8 | 48.9 | -46.8 |
| 49.5 | 5.7 | 5.7 | 2.5 | 13.9 | -1.8 | -2.4 | 42.4 | -54.0 |
| 54.5 | 0 | 0 | -2.5 | -2.5 | -2.9 | -3.8 | 36.8 | -60.5 |
| 55.0 | -0.6 | -0.6 | -2.5 | -3.7 | -3.0 | -4.0 | 36.2 | -61.2 |
| 60.5 | -6.8 | -6.9 | -2.5 | -16.2 | -4.2 | -5.6 | 30.4 | -68.4 |
| 66.0 | -13.0 | -13.1 | -2.5 | -28.7 | -5.3 | -7.2 | 25.0 | -75.7 |
| 71.5 | -19.2 | -19.4 | -2.5 | -41.2 | -6.5 | -8.8 | 20.0 | -82.9 |
| 77.0 | -25.4 | -25.7 | -2.5 | -53.7 | -7.7 | -10.4 | 15.4 | -90.1 |
| 82.5 | -31.7 | -32.0 | -2.5 | -66.1 | -8.9 | -12.0 | 11.3 | -97.3 |
| 88.0 | -37.9 | -38.3 | -2.5 | -78.6 | -10.1 | -13.6 | 8.2 | -104.3 |
| 93.5 | -44.1 | -44.5 | -2.5 | -91.1 | -11.3 | -15.1 | 5.5 | -111.3 |
| 99.0 | -50.3 | -50.8 | -2.5 | -103.6 | -12.5 | -16.7 | 3.2 | -118.0 |
| 104.5 | -56.5 | -57.1 | -2.5 | -116.1 | -13.7 | -18.3 | 1.2 | -124.7 |
| 108.0 | -60.5 | -61.1 | -2.5 | -124.1 | -14.4 | -19.4 | 0.4 | -128.7 |
| 109.0 | -61.6 | -62.2 | -2.5 | -126.4 | -14.6 | -19.6 | 0.2 | -129.9 |
| Span 2 - 0 | 0 | 0 | 0 | 0 | -14.8 | -19.9 | 0 | -131.1 |
* Distance from the centerline of the end bearing
Table 5.3-4 - Summary of Factored Shear
Interior girder, Span 1 shown, Span 2 mirror image
| Location* (ft.) |
Strength I (k) |
Service I (k) |
Service III (k) |
|---|---|---|---|
| 0 | 385.4 | 260.6 | 237.9 |
| 1.0 | 379.0 | 256.2 | 233.8 |
| 5.5 | 350.0 | 236.2 | 215.4 |
| 11.0 | 315.1 | 212.1 | 193.0 |
| 16.5 | 280.7 | 188.3 | 170.9 |
| 22.0 | 246.8 | 164.8 | 149.1 |
| 27.5 | 213.4 | 141.6 | 127.5 |
| 33.0 | 180.6 | 118.7 | 106.1 |
| 38.5 | 148.3 | 96.2 | 85.0 |
| 44.0 | 116.7 | 74.0 | 64.2 |
| 49.5 | 85.7 | 52.1 | 43.6 |
| 54.5 | -118.4 | -69.7 | -57.6 |
| 55.0 | -121.3 | -71.8 | -59.6 |
| 60.5 | -153.5 | -94.3 | -80.6 |
| 66.0 | -185.7 | -116.9 | -101.7 |
| 71.5 | -217.9 | -139.4 | -122.8 |
| 77.0 | -250.0 | -161.8 | -143.8 |
| 82.5 | -282.0 | -184.3 | -164.8 |
| 88.0 | -313.8 | -206.6 | -185.7 |
| 93.5 | -345.4 | -228.8 | -206.6 |
| 99.0 | -376.8 | -250.9 | -227.3 |
| 104.5 | -407.9 | -272.8 | -247.8 |
| 108.0 | -427.4 | -286.6 | -260.8 |
| 109.0 | -433.0 | -290.5 | -264.5 |
| Span 2 - 0 | -277.8 | -165.8 | -139.6 |
Load Factor Combinations
* Distance from the centerline of the end bearing
| Strength I | = 1.25(DC) + 1.5(DW) + 1.75(LL + IM) |
| Service I | = 1.0[DC + DW + (LL + IM)] |
| Service III | = 1.0(DC + DW) + 0.8(LL + IM) |
Table 5.3-5 - Summary of Unfactored Moments
Exterior girder, Span 1 shown, Span 2 mirror image
| Location* (ft.) |
Noncomposite | Composite | Live Load + IM | ||||||
|---|---|---|---|---|---|---|---|---|---|
| Girder | Slab and Haunch (k-ft) |
Exterior Diaphragm (k-ft) |
Total Noncomp. (k-ft) |
Parapet (k-ft) |
FWS (k-ft) |
Positive HL-93 (k-ft) |
Negative HL-93 (k-ft) | ||
| ** (k-ft) |
*** (k-ft) | ||||||||
| 0 | 47 | 0 | 0 | 0 | 0 | 0 | 0 | 0 | 0 |
| 1.0 | 108 | 61 | 55 | 1 | 117 | 9 | 8 | 93 | -11 |
| 5.5 | 368 | 322 | 288 | 7 | 616 | 46 | 41 | 482 | -59 |
| 11.0 | 656 | 609 | 545 | 14 | 1,168 | 85 | 77 | 897 | -118 |
| 16.5 | 909 | 863 | 771 | 21 | 1,655 | 118 | 106 | 1,245 | -177 |
| 22.0 | 1,128 | 1,082 | 967 | 28 | 2,076 | 144 | 130 | 1,528 | -236 |
| 27.5 | 1,313 | 1,267 | 1,132 | 35 | 2,434 | 164 | 148 | 1,746 | -294 |
| 33.0 | 1,464 | 1,417 | 1,267 | 42 | 2,726 | 177 | 160 | 1,906 | -353 |
| 38.5 | 1,580 | 1,534 | 1,371 | 49 | 2,954 | 183 | 165 | 2,019 | -412 |
| 44.0 | 1,663 | 1,616 | 1,445 | 56 | 3,117 | 183 | 166 | 2,073 | -471 |
| 49.5 | 1,711 | 1,664 | 1,488 | 63 | 3,215 | 177 | 160 | 2,071 | -530 |
| 54.5 | 1,725 | 1,679 | 1,501 | 69 | 3,248 | 165 | 149 | 2,041 | -583 |
| 55.0 | 1,725 | 1,678 | 1,501 | 68 | 3,247 | 164 | 148 | 2,035 | -589 |
| 60.5 | 1,705 | 1,658 | 1,482 | 61 | 3,202 | 144 | 130 | 1,951 | -648 |
| 66.0 | 1,650 | 1,604 | 1,434 | 54 | 3,092 | 118 | 107 | 1,816 | -706 |
| 71.5 | 1,562 | 1,515 | 1,355 | 48 | 2,917 | 86 | 77 | 1,633 | -765 |
| 77.0 | 1,439 | 1,392 | 1,245 | 41 | 2,678 | 46 | 42 | 1,406 | -824 |
| 82.5 | 1,282 | 1,236 | 1,105 | 34 | 2,374 | 1 | 1 | 1,139 | -883 |
| 88.0 | 1,091 | 1,044 | 934 | 27 | 2,005 | -52 | -47 | 836 | -1,138 |
| 93.5 | 865 | 819 | 732 | 20 | 1,571 | -110 | -100 | 531 | -1,238 |
| 99.0 | 606 | 560 | 500 | 13 | 1,072 | -176 | -159 | 300 | -1,389 |
| 104.5 | 312 | 266 | 238 | 6 | 509 | -248 | -224 | 114 | -1,683 |
| 108.0 | 110 | 61 | 55 | 1 | 117 | -297 | -268 | 33 | -1,945 |
| 109.0 | 47 | 0 | 0 | 0 | 0 | -311 | -281 | 15 | -2,031 |
| Span 2 - 0 | - | 0 | 0 | 0 | 0 | -326 | -294 | 0 | -2,121 |
* Distance from the centerline of the end bearing
** Based on the simple span length of 110.5 ft. and supported at the ends of the girders. These values are used to calculate stresses at transfer.
*** Based on the simple span length of 109 ft. and supported at the centerline of bearings. These values are used to calculate the final stresses.
Table 5.3-6 - Summary of Factored Moments
Exterior girder, Span 1 shown, Span 2 mirror image
| Location* (ft.) |
Strength I (k-ft) |
Service I ** | Service III ** | ||
|---|---|---|---|---|---|
| NC (k-ft) |
Comp. (k-ft) |
NC (k-ft) |
Comp. (k-ft) | ||
| 0 | 0 | 0 | 0 | 0 | 0 |
| 1.0 | 331 | 117 | 110 | 117 | 91 |
| 5.5 | 1,734 | 616 | 570 | 616 | 473 |
| 11.0 | 3,251 | 1,168 | 1,059 | 1,168 | 879 |
| 16.5 | 4,554 | 1,655 | 1,469 | 1,655 | 1,220 |
| 22.0 | 5,644 | 2,076 | 1,801 | 2,076 | 1,496 |
| 27.5 | 6,524 | 2,434 | 2,057 | 2,434 | 1,708 |
| 33.0 | 7,203 | 2,726 | 2,242 | 2,726 | 1,861 |
| 38.5 | 7,702 | 2,954 | 2,368 | 2,954 | 1,964 |
| 44.0 | 8,001 | 3,117 | 2,422 | 3,117 | 2,007 |
| 49.5 | 8,103 | 3,215 | 2,407 | 3,215 | 1,993 |
| 54.5 | 8,061 | 3,248 | 2,355 | 3,248 | 1,947 |
| 55.0 | 8,047 | 3,247 | 2,347 | 3,247 | 1,940 |
| 60.5 | 7,793 | 3,202 | 2,226 | 3,202 | 1,836 |
| 66.0 | 7,351 | 3,092 | 2,041 | 3,092 | 1,678 |
| 71.5 | 6,727 | 2,917 | 1,796 | 2,917 | 1,469 |
| 77.0 | 5,928 | 2,678 | 1,494 | 2,678 | 1,213 |
| 82.5 | 4,961 | 2,374 | 1,140 | 2,374 | 912 |
| 88.0 | 3,834 | 2,005 | -1,237 | 2,005 | -1,009 |
| 93.5 | 2,605 | 1,571 | -1,448 | 1,571 | -1,201 |
| 99.0 | -1,547 | 1,072 | -1,723 | 1,072 | -1,445 |
| 104.5 | -2,954 | 509 | -2,154 | 509 | -1,818 |
| 108.0 | -4,031 | 117 | -2,510 | 117 | -2,121 |
| 109.0 | -4,364 | 0 | -2,623 | 0 | -2,217 |
| Span 2 - 0 | -4,560 | 0 | -2,741 | 0 | -2,317 |
Load Factor Combinations
| Strength I | = 1.25(DC) + 1.5(DW) + 1.75(LL + IM) |
| Service I | = 1.0[DC + DW + (LL + IM)] |
| Service III | = 1.0(DC + DW) + 0.8(LL + IM) |
* Distance from the centerline of the end bearing
** For service limit states, moments are applied to the section of the girder, i.e. noncomposite or composite, that resists these moments. Hence, noncomposite and composite moments have to be separated for service load calculations.
Table 5.3-7 - Summary of Unfactored Shear
Exterior girder, Span 1 shown, Span 2 mirror image
| Location* (ft.) |
Noncomposite | Composite | Live Load + IM | |||||
|---|---|---|---|---|---|---|---|---|
| Girder (k) |
Slab and Haunch (k) |
Exterior Diaphragm (k) |
Total Noncomp. (k) |
Parapet (k) |
FWS (k) |
Positive HL-93 (k) |
Negative HL-93 (k) | |
| 0 | 61.6 | 55.1 | 1.3 | 117.9 | 8.9 | 8.1 | 98.4 | -11.2 |
| 1.0 | 60.5 | 54.1 | 1.3 | 115.8 | 8.7 | 7.9 | 97.0 | -11.2 |
| 5.5 | 55.4 | 49.5 | 1.3 | 106.2 | 7.7 | 7.0 | 90.6 | -11.3 |
| 11.0 | 49.2 | 44.0 | 1.3 | 94.4 | 6.5 | 5.9 | 82.9 | -11.6 |
| 16.5 | 43.0 | 38.4 | 1.3 | 82.6 | 5.4 | 4.8 | 75.5 | -13.8 |
| 22.0 | 36.7 | 32.8 | 1.3 | 70.8 | 4.2 | 3.8 | 68.3 | -17.9 |
| 27.5 | 30.5 | 27.3 | 1.3 | 59.1 | 3.0 | 2.7 | 61.4 | -22.6 |
| 33.0 | 24.3 | 21.7 | 1.3 | 47.3 | 1.8 | 1.6 | 54.8 | -28.5 |
| 38.5 | 18.1 | 16.2 | 1.3 | 35.5 | 0.6 | 0.5 | 48.5 | -34.5 |
| 44.0 | 11.9 | 10.6 | 1.3 | 23.7 | -0.6 | -0.5 | 42.5 | -40.7 |
| 49.5 | 5.7 | 5.1 | 1.3 | 12.0 | -1.8 | -1.6 | 36.8 | -46.9 |
| 54.5 | 0 | 0 | -1.3 | -1.3 | -2.9 | -2.6 | 31.9 | -52.6 |
| 55.0 | -0.6 | -0.5 | -1.3 | -2.3 | -3.0 | -2.7 | 31.4 | -53.1 |
| 60.5 | -6.8 | -6.1 | -1.3 | -14.1 | -4.2 | -3.8 | 26.4 | -59.4 |
| 66.0 | -13.0 | -11.6 | -1.3 | -25.9 | -5.3 | -4.8 | 21.7 | -65.7 |
| 71.5 | -19.2 | -17.2 | -1.3 | -37.7 | -6.5 | -5.9 | 17.4 | -72.0 |
| 77.0 | -25.4 | -22.7 | -1.3 | -49.4 | -7.7 | -7.0 | 13.4 | -78.3 |
| 82.5 | -31.7 | -28.3 | -1.3 | -61.2 | -8.9 | -8.0 | 9.8 | -84.5 |
| 88.0 | -37.9 | -33.9 | -1.3 | -73.0 | -10.1 | -9.1 | 7.2 | -90.6 |
| 93.5 | -44.1 | -39.4 | -1.3 | -84.8 | -11.3 | -10.2 | 4.8 | -96.6 |
| 99.0 | -50.3 | -45.0 | -1.3 | -96.5 | -12.5 | -11.3 | 2.8 | -102.5 |
| 104.5 | -56.5 | -50.5 | -1.3 | -108.3 | -13.7 | -12.3 | 1.0 | -108.3 |
| 108.0 | -60.5 | -54.1 | -1.3 | -115.8 | -14.4 | -13.0 | 0.4 | -111.8 |
| 109.0 | -61.6 | -55.1 | -1.3 | -117.9 | -14.6 | -13.2 | 0.2 | -112.8 |
| Span 2 - 0 | 0 | 0 | 0 | 0 | -14.8 | -13.4 | 0 | -113.8 |
* Distance from the centerline of the end bearing
Table 5.3-8 - Summary of Factored Shear
Exterior girder, Span 1 shown, Span 2 mirror image
| Location* (ft.) |
Strength I (k) |
Service I (k) |
Service III (k) |
|---|---|---|---|
| 0 | 342.9 | 233.3 | 213.7 |
| 1.0 | 337.2 | 229.4 | 210.0 |
| 5.5 | 311.3 | 211.4 | 193.3 |
| 11.0 | 280.1 | 189.7 | 173.2 |
| 16.5 | 249.3 | 168.3 | 153.2 |
| 22.0 | 219.0 | 147.1 | 133.4 |
| 27.5 | 189.1 | 126.2 | 113.9 |
| 33.0 | 159.7 | 105.5 | 94.6 |
| 38.5 | 130.9 | 85.2 | 75.5 |
| 44.0 | 102.5 | 65.1 | 56.6 |
| 49.5 | 74.8 | 45.4 | 38.0 |
| 54.5 | -101.0 | -59.3 | -48.7 |
| 55.0 | -103.6 | -61.1 | -50.5 |
| 60.5 | -132.4 | -81.4 | -69.5 |
| 66.0 | -161.3 | -101.8 | -88.6 |
| 71.5 | -190.1 | -122.1 | -107.7 |
| 77.0 | -218.8 | -142.4 | -126.7 |
| 82.5 | -247.5 | -162.6 | -145.7 |
| 88.0 | -276.0 | -182.8 | -164.7 |
| 93.5 | -304.4 | -202.8 | -183.5 |
| 99.0 | -332.5 | -222.8 | -202.2 |
| 104.5 | -360.4 | -242.5 | -220.9 |
| 108.0 | -377.9 | -255.0 | -232.7 |
| 109.0 | -382.9 | -258.6 | -236.0 |
| Span 2 - 0 | -237.8 | -142.1 | -119.3 |
Load Factor Combinations
| Strength I | = 1.25(DC) + 1.5(DW) + 1.75(LL + IM) |
| Service I | = 1.0[DC + DW + (LL + IM)] |
| Service III | = 1.0(DC + DW) + 0.8(LL + IM) |
* Distance from the centerline of the end bearing
Based on the analysis results, the interior girder controls the design. The remaining sections covering the superstructure design are based on the interior girder analysis. The exterior girder calculations would be identical.
Design Step 5.3.2 - Analysis of Creep and Shrinkage Effects
Design Step 5.3.2.1
The compressive stress in the beams due to prestressing causes the prestressed beams to creep. For simple span pretensioned beams under dead loads, the highest compression in the beams is typically at the bottom, therefore, creep causes the camber to increase, i.e., causes the upward deflection of the beam to increase. This increased upward deflection of the simple span beam is not accompanied by stresses in the beam since there is no rotational restraint of the beam ends. When simple span beams are made continuous through a connection at the intermediate support, the rotation at the ends of the beam due to creep taking place after the connection is established are restrained by the continuity connection. This results in the development of fixed end moments (FEM) that maintain the ends of the beams as flat. As shown schematically in Figure 5.3-1 for a two-span bridge, the initial deformation is due to creep that takes place before the continuity connection is established. If the beams were left as simple spans, the creep deformations would increase; the deflected shape would appear as shown in part b of the figure. However, due to the continuity connection, fixed end moments at the ends of the beam will be required to restrain the end rotations after the continuity connection is established as shown in part c of the figure. The beam is analyzed under the effects of the fixed end moments to determine the final creep effects.
Similar effects, albeit in the opposite direction, take place under permanent loads. For ease of application, the effect of the dead load creep and the prestressing creep are analyzed separately. Figures 5.3-2 and 5.3-3 show the creep moment for a two-span bridge with straight strands. Notice that the creep due to prestressing and the creep due to dead load result in restrained moments of opposite sign. The creep from prestressing typically has a larger magnitude than the creep from dead loads.
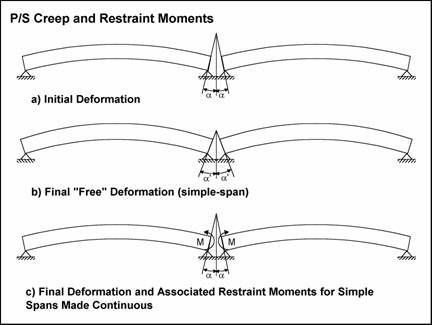
Figure 5.3-1 - Prestressed Creep Deformations and Restraint Moments
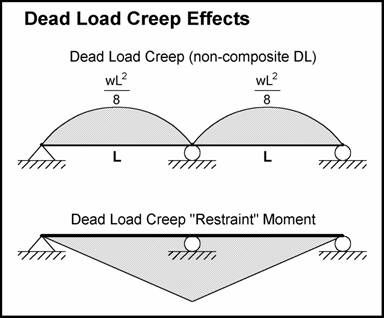
Figure 5.3-2 - Dead Load Creep Moment
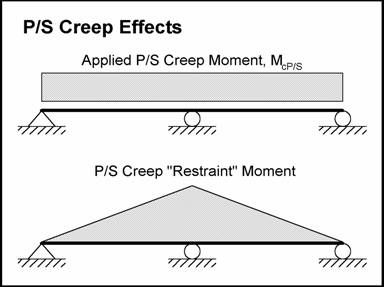
Figure 5.3-3 - Prestressed Creep Moment
Shrinkage effects
The shrinkage of the pretensioned beams is different from the shrinkage of the deck slab. This is due to the difference in the age, concrete strength, and method of curing of the two concretes. Unlike creep, differential shrinkage induces stresses in all prestressed composite beams, including simple spans. The larger shrinkage of the deck causes the composite beams to sag as shown in Figure 5.3-4. The restraint and final moments are also shown schematically in the figure.
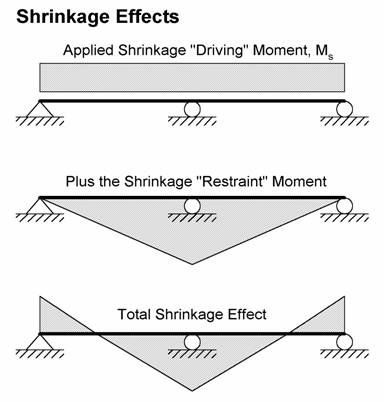
Figure 5.3-4 - Shrinkage Moment
Calculations of creep and shrinkage effects
The effect of creep and shrinkage may be determined using the method outlined in the publication entitled "Design of Continuous Highway Bridges with Precast, Prestressed Concrete Girders" published by the Portland Cement Association (PCA) in August 1969. This method is based on determining the fixed end moments required to restrain the ends of the simple span beam after the continuity connection is established. The continuous beam is then analyzed under the effect of these fixed end moments. For creep effects, the result of this analysis is the final result for creep effects. For shrinkage, the result of this analysis is added to the constant moment from shrinkage to determine the final shrinkage effects. Based on the PCA method, Table 5.3-9 gives the value of the fixed end moments for the continuous girder exterior and interior spans with straight strands as a function of the length and section properties of each span. The fixed end moments for dead load creep and shrinkage are also applicable to beams with draped strands. The PCA publication has formulas that may be used to determine the prestress creep fixed end moments for beams with draped strands.
Table 5.3-9 - Fixed End Actions for Creep and Shrinkage Effects
| DL Creep | P/S Creep | Shrinkage | |||||||
|---|---|---|---|---|---|---|---|---|---|
| Left End Span | Interior Span | Right End Span | Left End Span | Interior Span | Right End Span | Left End Span | Interior Span | Right End Span | |
| Left Moment (1) | 0 | 2/3(MD) | MD | 0 | 2EIΘ,/L | 3EIΘ/L | 0 | Ms | 1.5Ms |
| Right Moment (2) | -MD | -2/3(MD) | 0 | -3EIΘ/L | -2EIΘ/L | 0 | -1.5Ms | -Ms | 0 |
| Left Shear (3) | -MD/L | 0 | MD/L | -3EIΘ/L2 | 0 | 3EIΘ/L2 | -3Ms/2L | 0 | 3Ms/2L |
| Right Shear (4) | MD/L | 0 | -MD/L | 3EIΘ/L2 | 0 | -3EIΘ/L2 | 3Ms/2L | 0 | -3Ms/2L |
Notation for Fixed End Actions
| MD | = maximum non-composite dead load moment |
| L | = simple span length |
| Ec | = modulus of elasticity of beam concrete (final) |
| I | = moment of inertia of composite section |
| Θ | = end rotation due to eccentric P/S force |
| Ms | = applied moment due to differential shrinkage between slab and beam |
Design Step 5.3.2.3 - Effect of beam age at the time of the continuity connection application
The age of the beam at the time of application of the continuity connection has a great effect on the final creep and shrinkage moments. As the age of the beam increases before pouring the deck and establishing the continuity connection, the amount of creep, and the resulting creep load effects, that takes place after the continuity connection is established gets smaller. The opposite happens to the shrinkage effects as a larger amount of beam shrinkage takes place before establishing the continuity connection leading to larger differential shrinkage between the beam and the deck.
Due to practical considerations, the age of the beam at the time the continuity connection is established can not be determined with high certainty at the time of design. In the past, two approaches were followed by bridge owners to overcome this uncertainty:
Ignore the effects of creep and shrinkage in the design of typical bridges. (The jurisdictions following this approach typically have lower stress limits at service limit states to account for the additional loads from creep and shrinkage.)
Account for creep and shrinkage using the extreme cases for beam age at the time of establishing the continuity connection. This approach requires determining the effect of creep and shrinkage for two different cases: a deck poured over a relatively "old" beam and a deck poured over a relatively "young" beam. One state that follows this approach is Pennsylvania. The two ages of the girders assumed in the design are 30 and 450 days. In case the beam age is outside these limits, the effect of creep and shrinkage is reanalyzed prior to construction to ensure that there are no detrimental effects on the structure.
For this example, creep and shrinkage effects were ignored. However, for reference purposes, calculations for creep and shrinkage are shown in Appendix C.