
FHWA Supports:


The assessments took place between July 2014 and June 2015, and involved U.S. DOT field offices in every State, engaging nearly 1,500 participants across the country. Each assessment was convened by one U.S. DOT agency, coordinating closely with other U.S. DOT agency field offices serving that State and their stakeholders to form an assessment planning team. FHWA had primary responsibility for 36 assessments; FTA and NHTSA each had primary responsibility for seven assessments; and FRA and FMCSA each hosted one assessment. See Appendix 3 for more information on assessment locations.
The field offices invited many stakeholders to take part in the assessments. While attendance varied at each event, participation typically included:
Federal partners: Environmental Protection Agency, U.S. Department of Housing and Urban Development, U.S. Department of Health and Human Services, the National Park Service, and the U.S. Postal Service
State agencies: transportation, health, economic development, motor vehicles, highway safety, universities, energy, conservation and natural resources
Local/regional governments: planning, transportation, public works, economic development, disability/accessibility commissions, civil rights/diversity/inclusion offices, police, fire, health, parks/trails, mayors, transit agencies, elected officials, metropolitan planning organizations (MPOs)/regional planning commissions
Tribal governments
Resident/non-governmental organizations: Chambers of Commerce, Rotary Club, hospitals, neighborhood associations/groups, local walk/bike/transit advocates, land trusts, local arts commissions, local business owners, seniors, environment/energy groups, smart growth groups, and other community interest and advocacy groups representing diverse/minority/low income communities
Private consultants: those working with local/State/transit agencies
The assessments generated enthusiasm at all levels. Many participants were eager to share their concerns and ideas through coordinating with stakeholders at other agencies that share a role in creating safer environments for walking and bicycling. Participants noted it was valuable to bring together a variety of organizations, to learn from one another and build partnerships, and many noted the desire to organize additional assessment events around their State. Local elected officials participated in ten assessments, and senior U.S. DOT field leadership attended more than half of the events.
Most of the assessments were half- to full-day events, with some spread over two days to accommodate an introduction, on-the-ground assessment, and then a follow-up meeting and debrief. The planning teams used a variety of methods for conducting the assessments, tailoring the events to fit the size of the group and the scope of the assessment site.
The assessment teams took a thoughtful approach to planning and executing these events as part of the Secretary's initiative. There are many methods for conducting safety assessments, which can apply to different contexts and scales. The assessments for the Secretary's initiative focused on building relationships, and examining the bigger picture of the status of walking and bicycling at the assessment sites. Some States expanded the assessments to increase awareness of bicycling and pedestrian safety issues among a broader audience in the community, using press releases and inviting large numbers of participants. While the value of these larger scale assessment events was evident, smaller scale assessments focused on engineering changes are also important. See Appendix 1 for a brief how-to guide for conducting safety assessments based on the instructions given to the field offices for this project.
Each assessment planning team selected a location within their State, taking into account known or documented pedestrian and bicycle safety issues, upcoming roadway or transit station improvement or rehabilitation projects, and local feedback. Some assessments emphasized certain issues, such as access to transit or accessibility for people with disabilities.
Many teams used a data-driven process to select the assessment site, analyzing crash data, local demographics, commuting patterns, pedestrian and bicycle counts, and proximity to transit. For example, the Tennessee assessment team used U.S. Census data and Tennessee DOT safety data to identify the assessment location in Nashville. The staff analyzed factors such as households without access to vehicles, households below the poverty line, use of alternative modes of transportation to get to work, and non-motorized crash data. The Florida team used data to identify a low income area in Orlando with high pedestrian and bicycle crash rates and a high percentage of transit use. The Idaho team developed a site selection criteria checklist to help identify potential sites (see Appendix 2).
The assessment locations ranged from downtown or urban environments to more suburban and rural settings. Some examined a single intersection while others covered corridors of up to three or four miles. Many assessments focused on urban arterials because they often have multiple lanes, challenging intersections, are served by transit, have relatively high traffic volumes and speeds, and have some form of shared responsibility between State and local entities. The Illinois team selected a highly complex six-legged intersection in Chicago that is within one-half mile of a commuter rail station, and has heavy vehicular traffic, multiple bus stops for major bus routes, nearby interstate ramps, railroad viaducts, and documented crashes involving pedestrians.
More than half of the groups used the assessment as an opportunity to examine pedestrian and bicycle facilities in locations with planned or recent roadway reconstruction projects. In general, assessments that take place in the relatively early stages of project scoping are advantageous because they have the best chance to influence the design, evaluate alternatives, and get to desired performance outcomes. For example, in Connecticut, the assessment identified several short term improvements that could be implemented relatively easily, as well as longer term steps that could be incorporated into an upcoming safety project on the corridor. The Mississippi assessment took place in downtown Jackson, on a road that was recently converted from a one-way street to a two-way street with installation of landscaping, roundabouts, and bicycle and pedestrian facilities. For this assessment, as with others, it was particularly useful to have project engineers and designers participating to answer questions and experience firsthand the issues and concerns raised during the assessment.
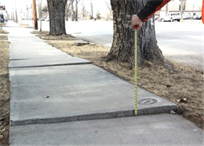
To help guide the effort, U.S. DOT developed a planning guide and disseminated several examples of existing assessment tools and worksheets (see Appendix 1). Many assessment teams customized these resources or created their own tools to best fit the local needs and context. For example, Minnesota used a State-level guide to evaluate treatments for pedestrians and uncontrolled intersections. The Nebraska team created a resource guide with a survey form, photographs, and suggested solutions. The Hawaii team adapted two existing FHWA guides for their assessment.
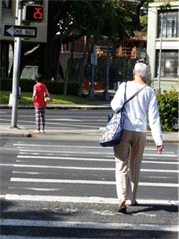
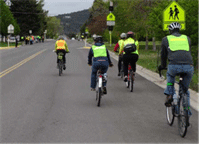
Participants walked and/or bicycled the assessment areas, in some cases riding in vehicles on longer sections and getting out at select locations to analyze the areas in more depth. In some cases, they also had impromptu discussions with passersby and local business owners to learn about their experiences. For example, during the South Dakota assessment, a local business owner saw the team walking around, and provided input on the issues she observed at an intersection near her business.
Several assessment teams noted the importance of time of day and the local context when planning an assessment, in order to better understand how the infrastructure serves (or does not serve) its users under different conditions. For example, the Massachusetts assessment analyzed the area around a transit station scheduled for rehabilitation. Participants conducted the bicycle portion of the assessment earlier in the afternoon, and the pedestrian portion of the assessment during the evening rush hour, to best observe pedestrian behavior and volumes, as well as vehicular, pedestrian, and bicycle traffic in the station area. Participants noted that they perceived the pedestrian experience differently in the quiet afternoon versus during the busy evening rush hour. In Georgia, assessment organizers included a nighttime review in order to document impediments to safe walking and bicycling after dark (e.g., lack of lighting, retroreflectivity, and signing visibility).
In addition to focusing on specific locations, some groups used the assessments as an opportunity to provide training and education to participants, in some cases organizing full-day or multi-day events with multiple training sessions. The California assessment included an afternoon workshop for over 50 participants, discussing topics such as engineering improvements, data, funding, and policy opportunities. Alaska and Oregon both used the assessments as an opportunity to demonstrate successes and show models of recently built facilities that successfully integrate bicycling and walking.
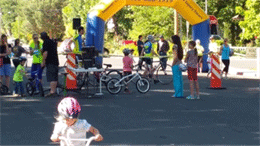
In some States the assessment team coordinated with organizers of other existing initiatives, allowing them to pool resources and reach new stakeholders. For example, the Utah team planned the assessment to take place at the same time as Utah's Road Respect Tour Community Event in Hurricane, Utah. The Road Respect Tour is run by the Utah DOT and the State Bicycle Federation, and the purpose of the tour is raise awareness of bicycle safety on roadways. The benefits of pairing safety assessments with other initiatives include raising awareness of existing initiatives among larger audiences, combining events to make more effective use of travel funding, forming and strengthening relationships with new partners, and demonstrating the will and commitment of many stakeholders to improving conditions for pedestrians and cyclists.

