

Composite Bridge Decking, Final Project Report
APPENDIX B: REPORT ON FINITE ELEMENT ANALYSIS
Finite Element Model For the Whole Bridge
Tables 6 through 8 detail the properties of the various materials used to model the composite bridge deck.
| Laminate Unit Value | Unit | Values for Horizontal Walls Thickness = 0.20" | Values for Inclined Walls Thickness = 0.24" | Values for graphite (thickness for each layer = 0.172in) |
|---|---|---|---|---|
| Elastic modulus of 0 degree, Ex | psi | 3.89 E+6 | 3.43 E+6 | 3.13 E+6 |
| Elastic modulus of 90 degree, Ey | psi | 1.77 E+6 | 2.73 E+6 | 2.03 E+6 |
| Shear modulus, Gxy | psi | 0.86 E+6 | 0.75 E+6 | 1.32 E+6 |
| Ultimate tensile strength of 0 degree | psi | 39,960 | 33,000 | 50,960 |
| Ultimate tensile strength of 90 degree | psi | 19,890 | 10,340 | 44,340 |
| Ultimate compressive strength of 0 degree | psi | 70,000 | 54,120 | 35,710 |
| Ultimate compressive strength of 90 degree | psi | 33,430 | 37,060 | 35,710 |
| Ultimate shear strength | psi | 14,580 | 14,770 | 9,090 |
| Poisson's ratio | 0.223 | 0.231 modeling | 0.184 |
| Properties | Unit | Value |
|---|---|---|
| Compressive strength | psi | 1.32E+4 |
| Tensile strength | psi | 2.35E+3 |
| Elastic modulus | psi | 2.16E+6 |
| Properties | Unit | Value |
|---|---|---|
| Elastic modulus | psi | 2.90E+7 |
| Poisson's ratio | 0.3 |
Result
Using AASHTO Load and Resistance Factor Design (LRFD) Bridge Design specifications:
- Load Factor for Lane Load = 1.75.
- Load Factor for Truck Load = 1.75*(1+0.33) = 2.3275.
Tables 9 through 11 show the response of the deck under service load, as obtained from finite element analysis. The finite element model used property values that were primarily derived from the physical testing of as-fabricated composite specimens.
| Loading | Maximum Deflection (in.) (Service Load) |
Square root of Tsai-Hill Index (R) (√ITH) (LRFD) |
|---|---|---|
| HL-93 | 0.284 | 0.413 |
Maximum local deflection between two girders = 0.02 inches.
| Loading | Maximum Deflection (in.) (Service Load) |
Square root of Tsai-Hill Index (R) (√ITH) (LRFD) |
|---|---|---|
| HL-93 | 0.357 | 1.38 |
Maximum local deflection between two girders = 0.17 inches.
| Loading | Maximum Deflection (in.) (Service Load) |
Square root of Tsai-Hill Index (R) (√ITH) (LRFD) |
|---|---|---|
| HL-93 | 0.279 | 0.853 |
Maximum local deflection between two girders = 0.088 inches.
The most critical element (the element with the highest Tsai Hill index under LRFD loading) is located under the area of applying the truck load (on the top flange). The stress states for these elements are presented in tables 12 through 15.
| Element No. | S11 (psi) | % of Ultimate | S22 (psi) | % of Ultimate | S12 (psi) | % of Ultimate |
|---|---|---|---|---|---|---|
| Under truck load (vertical wall) |
-19342 | 27 | -28021 | 84 | 13 | 0.09 |
| Element No. | S11 (psi) | % of Ultimate | S22 (psi) | % of Ultimate | S12 (psi) | % of Ultimate |
|---|---|---|---|---|---|---|
| Under truck load (vertical wall) |
-45019 | 64 | -65219 | 195 | 30 | 0.2 |
| Element No. | S11 (psi) | % of Ultimate | S22 (psi) | % of Ultimate | S12 (psi) | % of Ultimate |
|---|---|---|---|---|---|---|
| Under truck load (vertical wall) |
-2391 | 7 | -8197 | 23 | 168 | 2 |
| Element No. | S11 (psi) | % of Ultimate | S22 (psi) | % of Ultimate | S12 (psi) | % of Ultimate |
|---|---|---|---|---|---|---|
| Under truck load (vertical wall) |
-5565 | 16 | -19079 | 53 | 390 | 4 |
Figures 33 through 41 graphically illustrate the finite element model made for the proof-of-concept bridge.
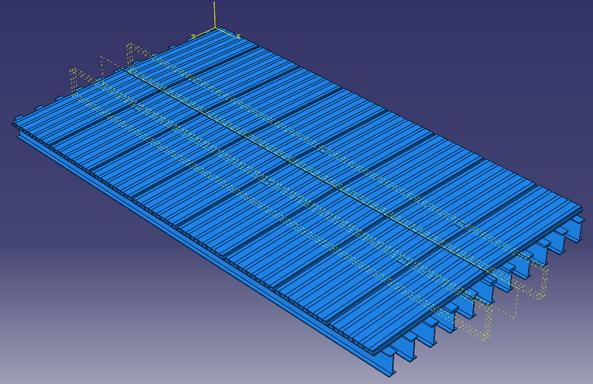
Figure 33. Diagram. 3D view.
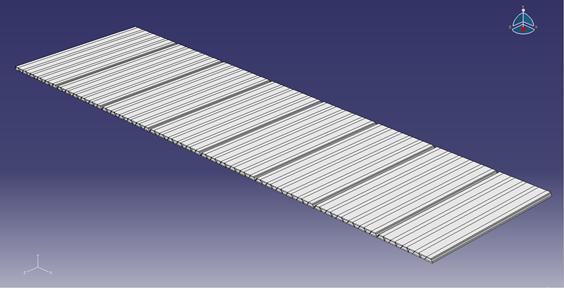
Figure 34. Diagram. Half of FRP deck (7 panels with 11 cells and 1 panel with 8 cells).
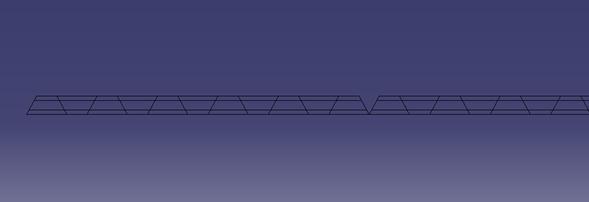
Figure 35. Diagram. Cross-section of a part of the FRP deck.
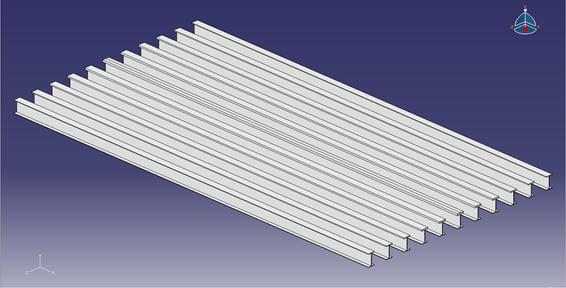
Figure 36. Diagram. Girders.
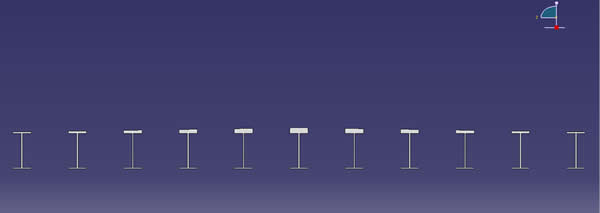
Figure 37. Diagram. Cross-section of the girders.
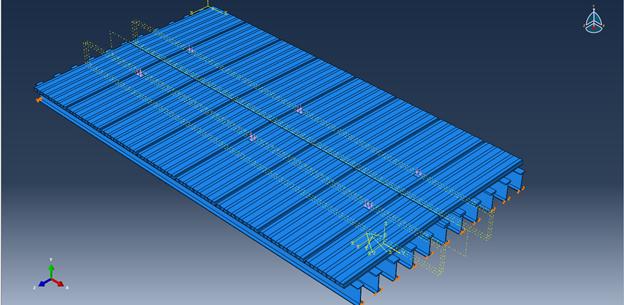
Figure 38. Diagram. Loading and boundary conditions.
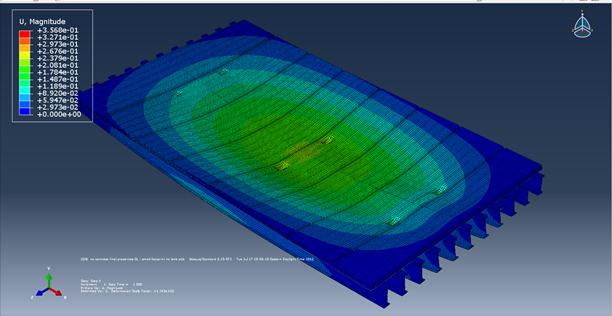
Figure 39. Diagram. Deflection (service load), small footprint.
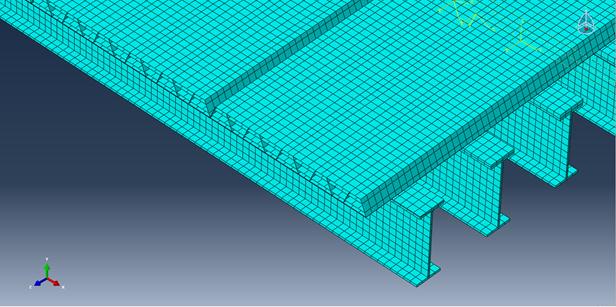
Figure 40. Diagram. Mesh.
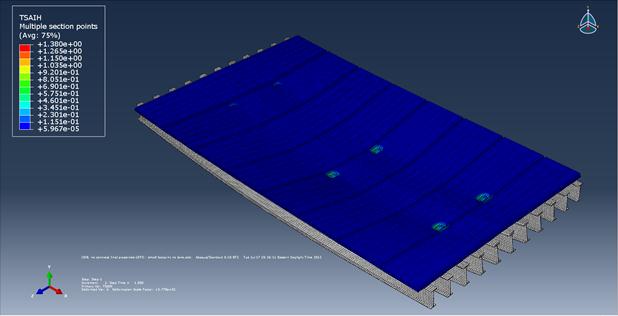
Figure 41. Diagram. Tsai-Hill Index (LRFD), small footprint.