
TMIP peer reviews yield many interesting and valuable insights for the host agency. Some of the findings are agency specific, while many are common and can be generalized. A review of the twenty-eight peer reviews was performed to draw out the salient lessons, observed model limitations, suggested recommendations, as well as general policy and modeling trends. This section of the report presents these themes.
Major trends and themes can be culled from the peer review final reports by getting a sense for what was discussed at each of the individual peer review meetings. There are two important elements available in almost all of the peer review final reports that can be used for this purpose. The peer review final reports typically include:
The host agency technical questions and the panel recommendations can then be organized into major topic areas to draw out commonalities that exist not only within the industry, but across planning agencies of different sizes and how the major topics have changed over time.
As part of the TMIP peer review application process, the host agency is required to develop a "charge to the peer review panel." This charge to the peer review panel is often conveyed as a list of topic areas the host agency is interested in and most commonly as a list of ten to fifteen specific technical questions. The technical questions posed to the peer review panel can therefore provide a clear picture of the concerns, challenges and modeling issues from the perspective of a host agency.
The format and structure of the TMIP peer review final reports have evolved over time partly as a result of varied authorship over the years (Volpe 2003-2004, TTI 2004-2005, Volpe 2005-2007, RSG 2010-current). The specific technical questions posed by the host agency have only recently been explicitly included in the peer review final reports as an appendix. However, the technical questions that were likely posed can often be found and extracted from other sections in the older peer review final reports.
There is very good documentation on the specific technical questions posed by the host agency for thirteen of the twenty-eight total peer reviews. The thirteen reviews which have good documentation on the specific technical questions still represent a good mix of the large, medium, and small sized agencies. Table 3 below identifies the agency peer review for which there is good technical question documentation included in the peer review final report. Table 4 characterizes the thirteen reviews that identified the technical questions using the large, medium, and small agency categorization.
| Technical Questions Posted | Count | Agencies |
|---|---|---|
| Documented in Final Report | 13 | NYMTC, NCDOT, MTC, DVRPC, IaDOT, MBC, SACOG, CAMPO, MAPA, AMBAG, CHCNGA-TPO, AMATS, CCMPO |
| Not Documented in Final Report | 15 | SCAG, NJTPA, SEMCOG, ARC, SANDAG, DRCOG, EWGCG, OKI, MATA, PPACG, COMPASS, BRC, DMPO, CMPO, ECIA |
| Total | 28 |
| Agency Size | Count | Agencies |
|---|---|---|
| Large | 5 | NYMTC, NCDOT, MTC, DVRPC, IaDOT |
| Medium | 5 | BMC, SACOG, CAMPO, MAPA, AMBAG |
| Small | 3 | CHCNGA-TPO, AMATS, CCMPO |
| Total | 13 |
Approximately two-hundred different specific technical questions were posed to the peer review panels in the thirteen host agency reviews where this information is well-documented in the final reports. This broad and diverse set of technical questions was categorized using twenty-one generalized major topic areas. The process by which technical questions were collected and grouped into the generalized major topic areas is somewhat subjective. A sample technical question and the resulting topic area assignment along with the host agency and peer review date are presented below.
"How accurate is the travel model in capturing intrastate and interstate freight movements?" (AMATS, 2004)
Topic Area à Freight Modeling
Some judgment is required as this particular question posed by staff during the Anchorage, Alaska peer review could have been categorized into other major topic areas as well. The intent was to categorize the technical questions in a straightforward way without attributing the same question to multiple topic areas, although there were a few cases when this was done. Appendix A provides detailed descriptions of the twenty-one generalized major topic areas along with an example of a specific host agency technical question that was attributed to the topic area.
Figure 8 illustrates the percent share of technical questions by topic area posed by host agencies sorted from smallest to largest. Eleven percent of all the technical questions posed by host agencies for example were related to calibration and validation. Figure 9 disaggregates the data presented in Figure 8 by agency size. Thirteen percent of all technical questions posed by large-size host agencies for example were related to the topic of calibration and validation. Ten percent of all the technical questions posed by medium-size host agencies and almost none percent of all technical questions posed by small-size host agencies were related to calibration / validation. Finally, Figure 10 disaggregates the data presented in Figure 8 by year. The yearly data was grouped into three ranges: 2004-2005, 2008-2010, and 2011. This was done to eliminate years where few (or no) technical questions were documented in the peer review final reports (e.g. 2003, 2006-2007). Note, the same axis category order and axis scaling are applied to each figure to facilitate comparisons down the page.
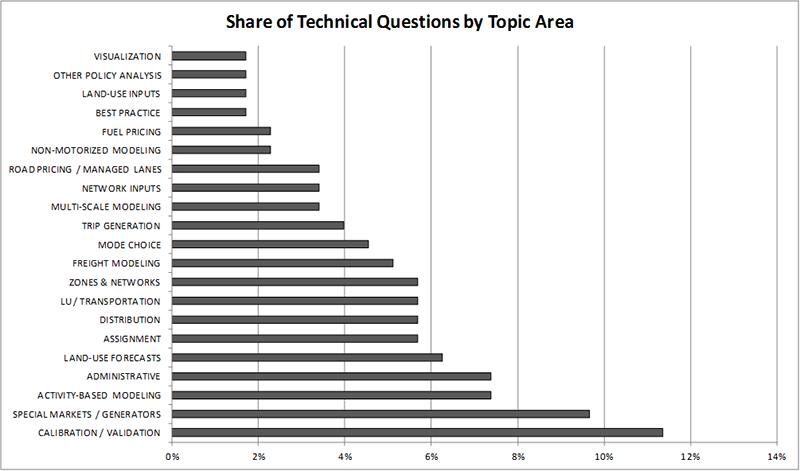
Figure 8 Share of Technical Questions by Topic Area
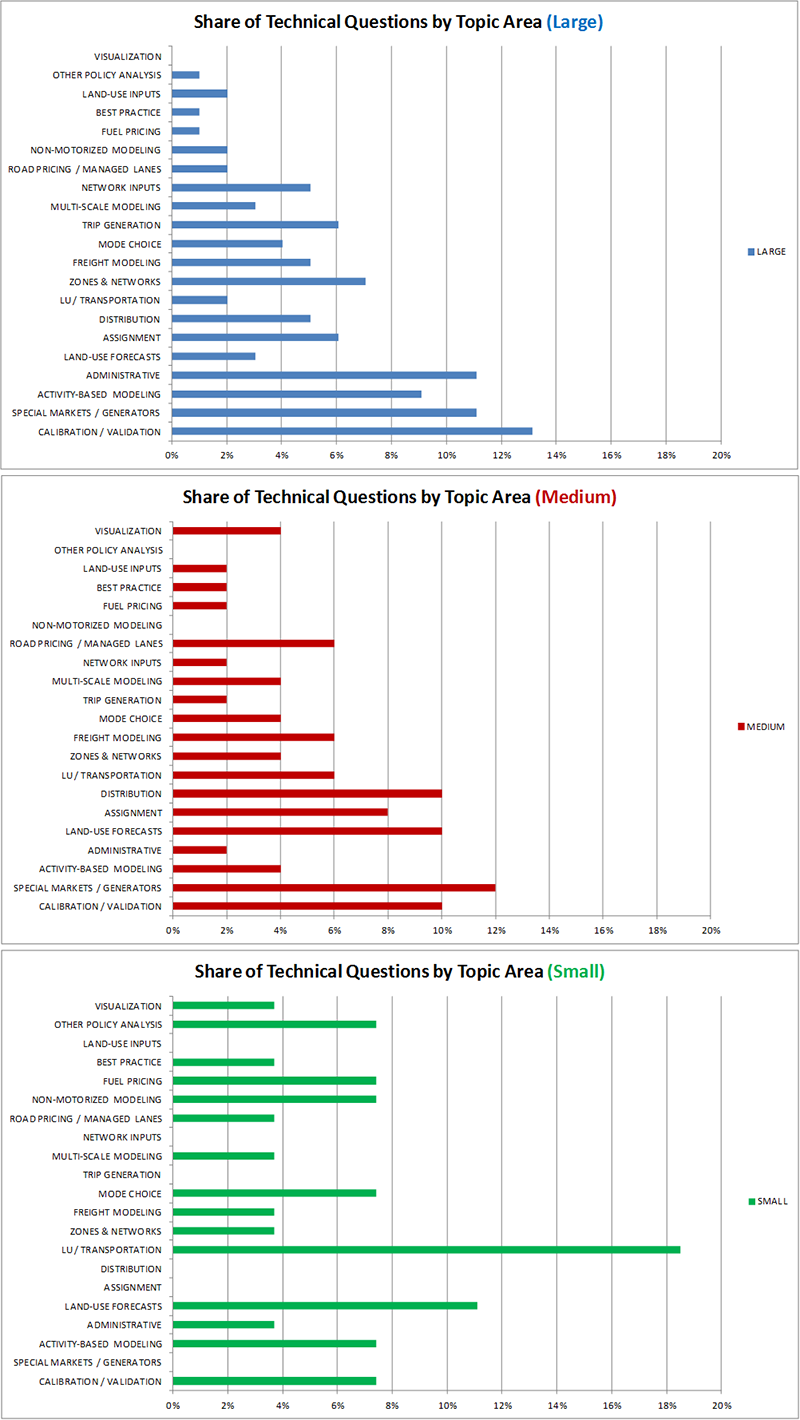
Figure 9 Technical Questions by Topic Area by Agency Size
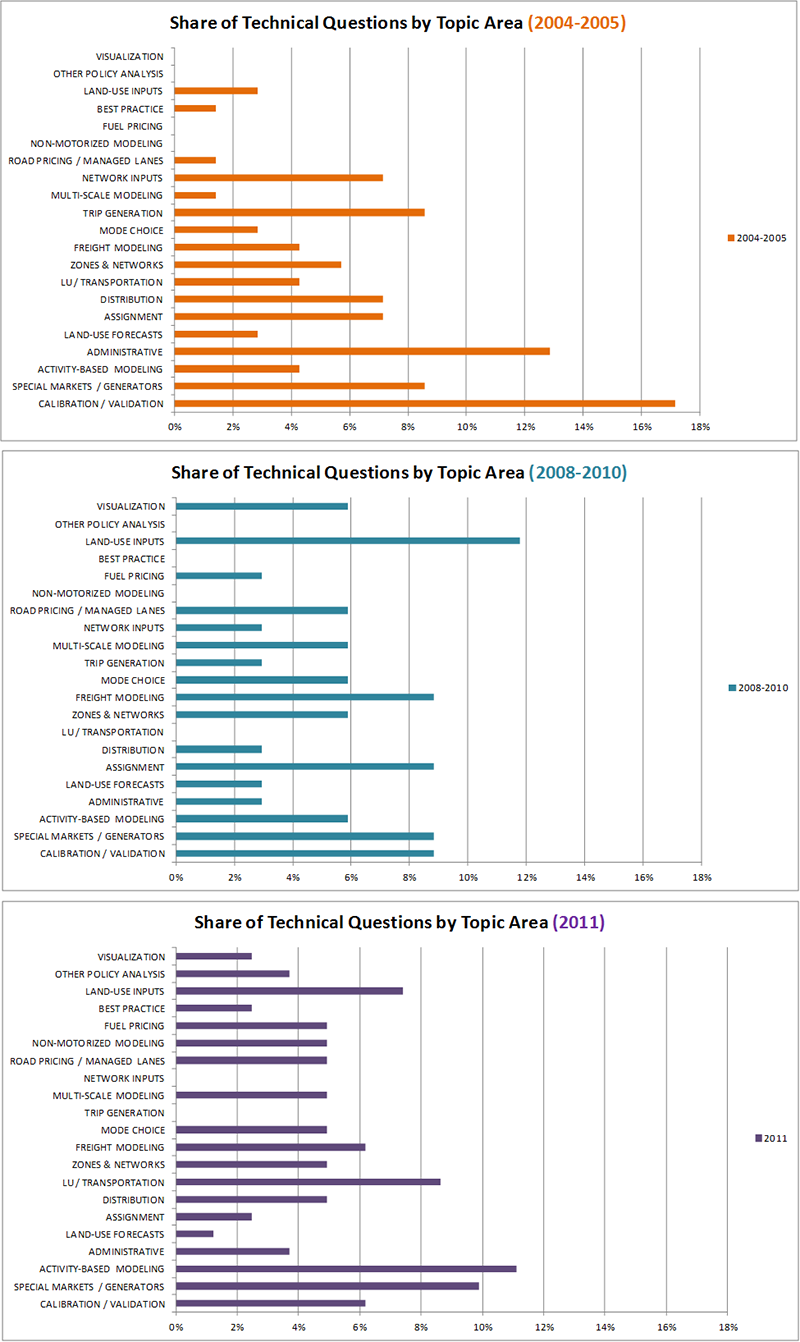
Figure 10 Technical Questions by Topic Area by Calendar Year
A few key findings emerge based on this review of the technical questions posed by the host agencies:
Each TMIP peer review culminates in a list of recommendations which the peer panel presents to the agency staff. Peer panel recommendations are typically delivered as short-term and long-term priorities the agency should consider to improve their travel modeling tools and procedures. As with the technical questions submitted to the panel, a list of about ten to fifteen panel recommendations are presented to the agency staff in the final session of the multi-day meetings which then concludes the peer review. These recommendations are incredibly valuable given the make-up of these peer review panels. As described earlier in this report, these individuals are prominent practitioners in the industry and the nationally recognized technical leaders. A review of their specific recommendations can therefore provide a clear picture of the concerns, challenges and issues as well as solutions for addressing them from the perspective of peer panel experts.
All twenty-eight peer review final reports have good documentation on the recommendations presented by the peer panel at the conclusion of the review.
Approximately 175 different specific panel recommendations were presented to the host agencies in the twenty-eight peer review final reports. This broad and diverse set of panel recommendations was categorized using the same twenty-one generalized major topic areas used to categorize the host agency technical questions in the preceding section. The process by which the panel recommendations were collected and grouped into the generalized major topic areas is somewhat subjective. A sample panel recommendation and the resulting topic area assignment along with the host agency and peer review date are presented below.
"MTC should consider developing a finer-grained regional zone system." (MTC, 2004)
Topic Area à Zones & Networks
Some judgment is again required as was the case in assigning the host agency technical questions to generalized topic areas. The intent was to categorize the panel recommendations in the most straight-forward way possible without attributing the same recommendation to many different topic areas. Appendix A provides detailed descriptions of the twenty-one generalized major topic areas. Peer panel recommendations limited only to very specific agency implementation issues were not considered for this assessment and evaluation (e.g. remove bridge penalties).
Figure 11 illustrates the percent share of panel recommendations by topic area sorted from smallest to largest. Thirteen percent of all the peer panel recommendations for example were related to administrative items. Figure 12 disaggregates the data presented in Figure 11 by agency size. Just over fourteen percent of all the peer panel recommendations made during large-size agency reviews for example were related to the administrative topic area. Eight percent of all the peer panel recommendations made during medium-size agency reviews and slightly more than sixteen percent of all the recommendations made during small-size host agency reviews were related to administrative items. Figure 13 disaggregates the data presented in Figure 11 by year. The yearly data was grouped into three ranges: 2003-2005, 2006-2008, and 2009-2011. Grouping the recommendations into consecutive three-year ranges is possible when examining the peer panel recommendations because the panel recommendations are well-documented in all the peer review final reports which was not the case with the host agency technical questions. Finally, Figure 14 presents the panel recommendations based on the panel's prioritization (e.g. long-term, short-term). Note, the same axis category order and axis scaling are applied to each figure to facilitate comparisons down the page.
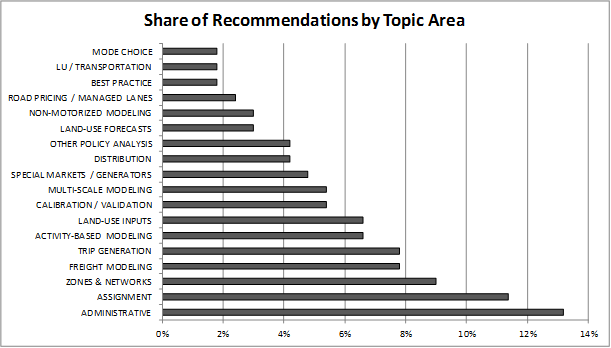
Figure 11 Panel Recommendations by Topic Area
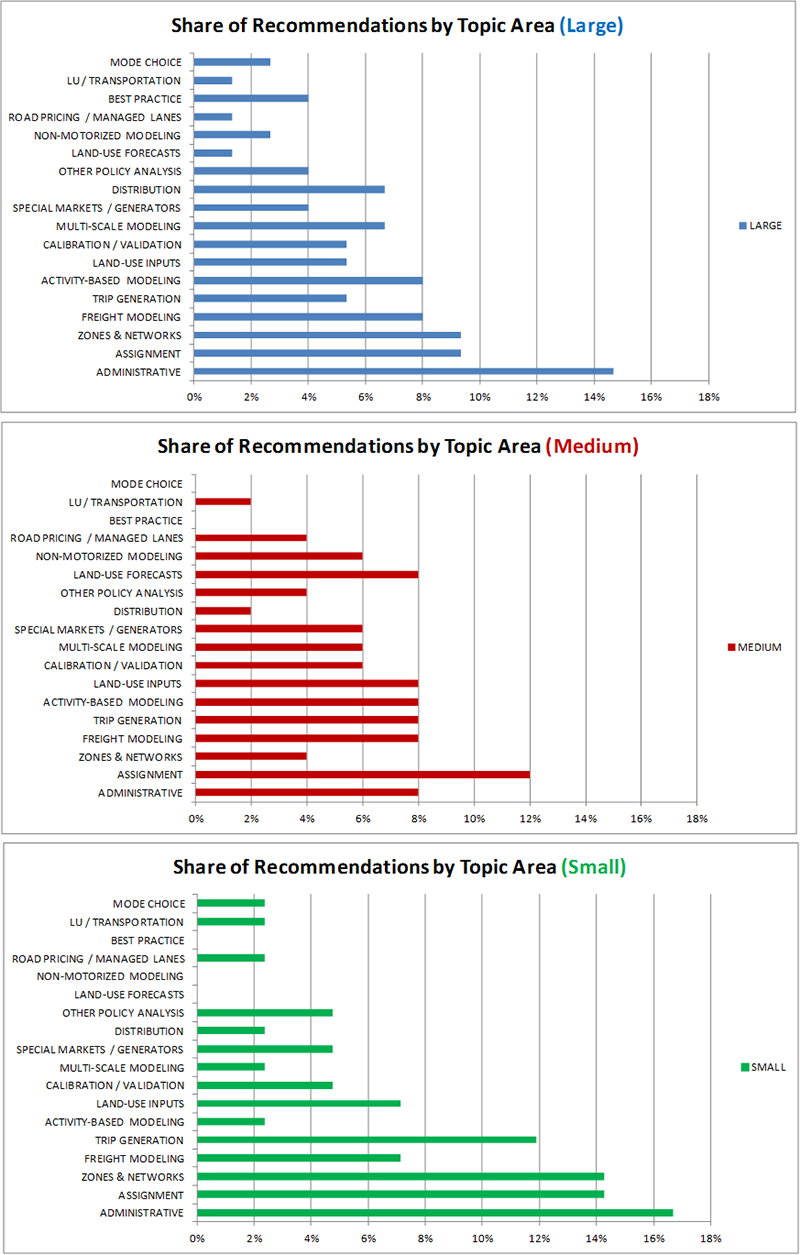
Figure 12 Panel Recommendations by Topic Area by Agency Size
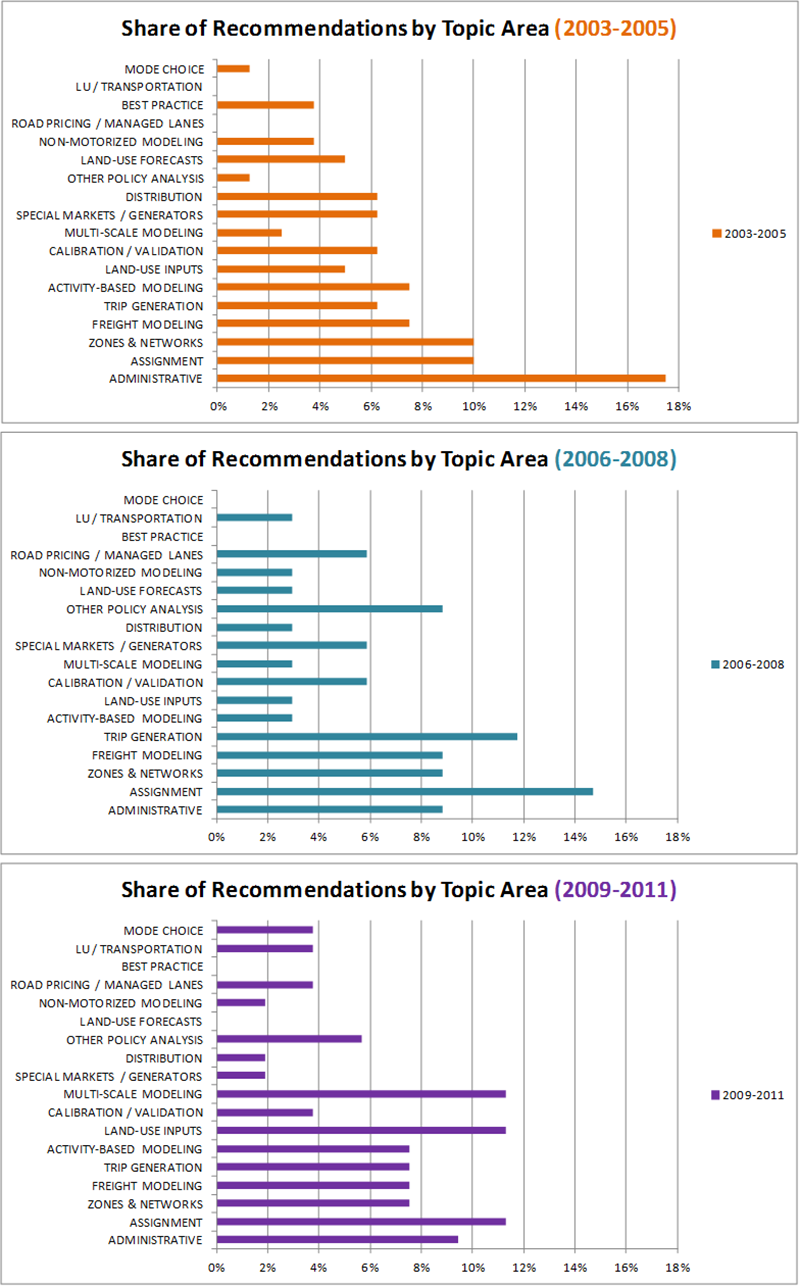
Figure 13 Panel Recommendations by Topic Area by Calendar Year
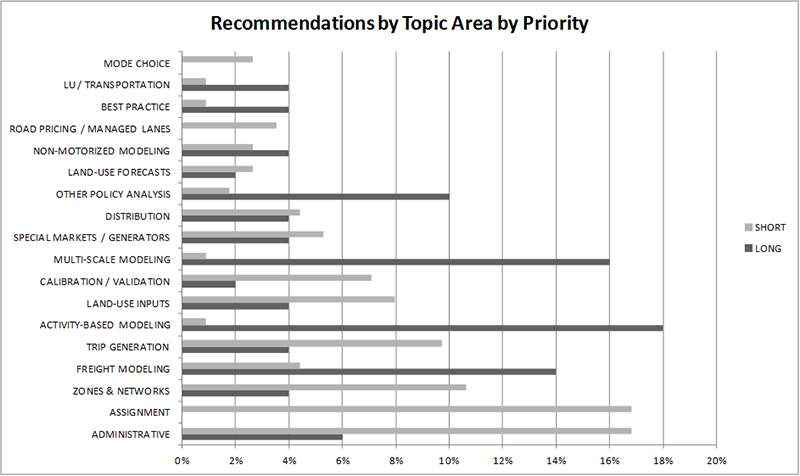
Figure 14 Panel Recommendations by Topic Area by Priority
A few key findings emerge based on this review of the recommendations delivered to the host agency by the peer review panels:
As described in the preceding section, the same set of generalized topic areas were identified to categorize both the technical questions posed to the panel by host agencies and the model improvement recommendations presented to the host agency by the peer review panel. In many cases the peer panels respond directly to certain questions posed the agency with their final recommendations. To provide an overall summary, the technical questions and the panel recommendations were merged and evaluated together.
This section of the report serves to identify which major topic areas were discussed among all twenty-eight peer reviews. A major topic area is assumed to have been discussed at length if there was at least one technical question posed during the review or if a panel recommendation was made during the peer review about the topic.
Figure 15 illustrates the percent share of questions and recommendations by topic area sorted from smallest to largest. Figure 9 disaggregates the data presented in Figure 15 by agency size. Figure 17 disaggregates the data presented in Figure 15 by year. The yearly data was again grouped into three ranges: 2003-2005, 2006-2008, and 2009-2011. Note, the same axis category order and axis scaling are applied to each figure to facilitate comparisons down the page.
Figure 15, Figure 16, and Figure 17 help visualize and emphasize two important findings from the earlier technical question and panel recommendation summaries:
Continued tracking of the TMIP peer review program trends and themes along the dimensions which have been presented in this report will be very beneficial moving forward. TMIP is now and should continue to develop tools that can streamline the assessment/evaluation of the peer review program.
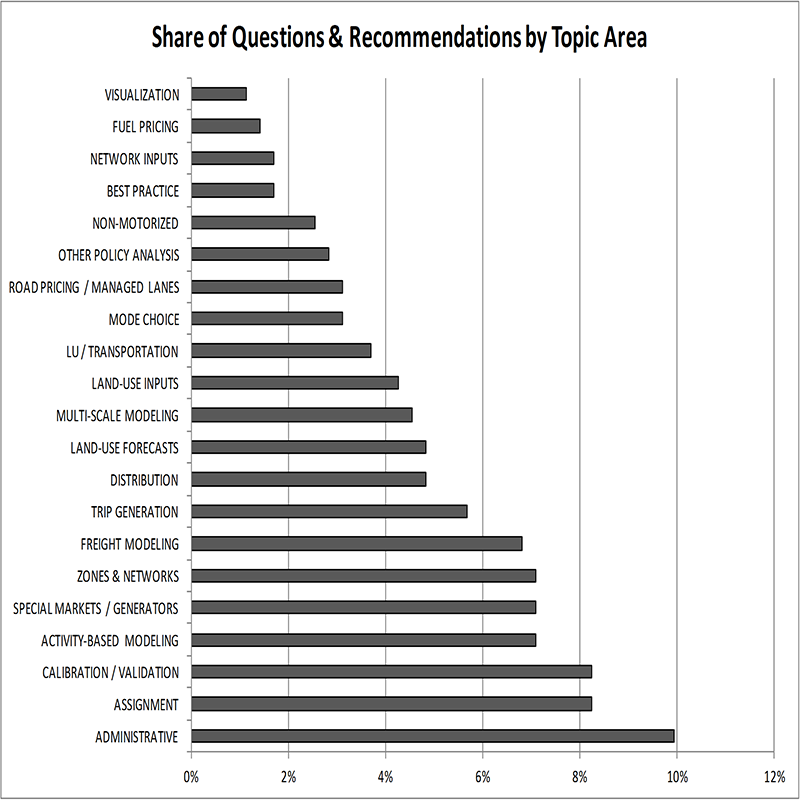
Figure 15 Share of Questions and Recommendations by Topic Area
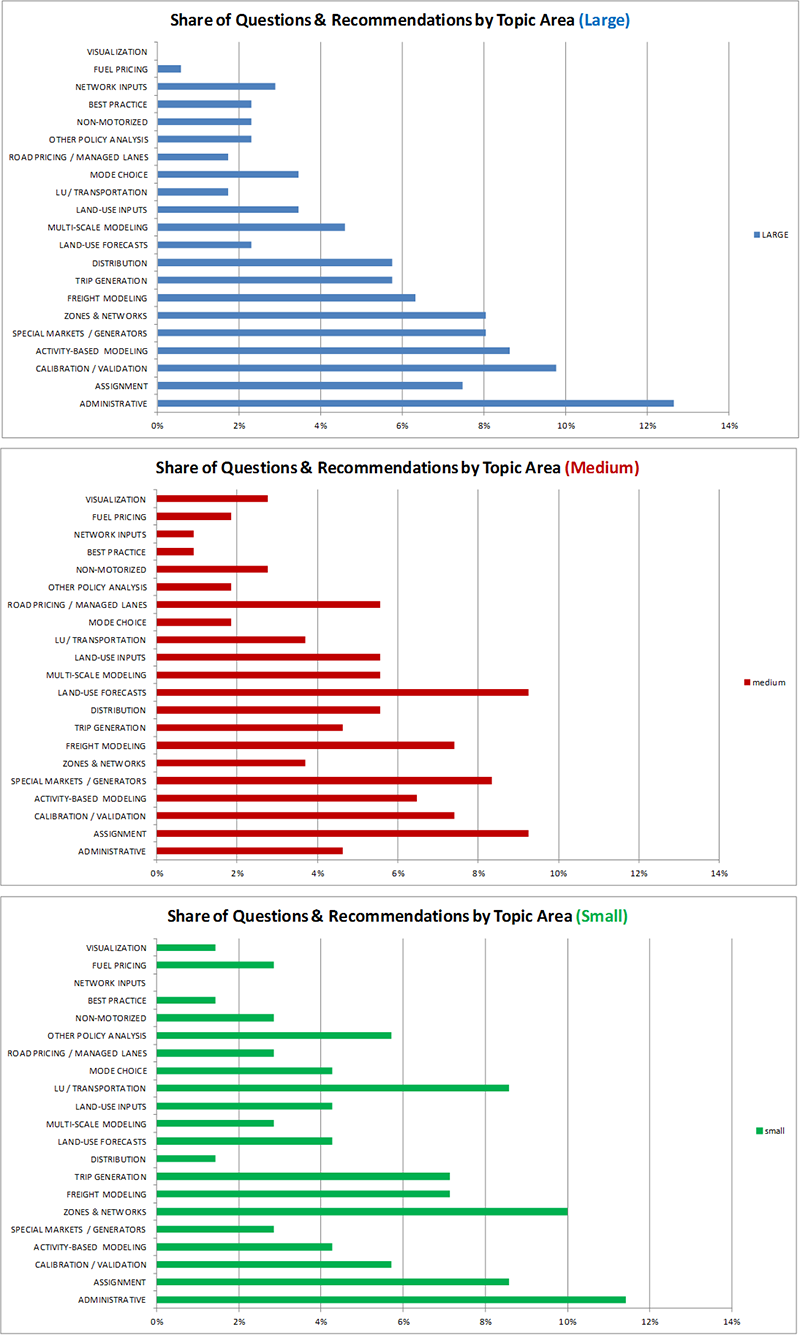
Figure 16 Share of Questions and Recommendations by Topic Area by Agency Size
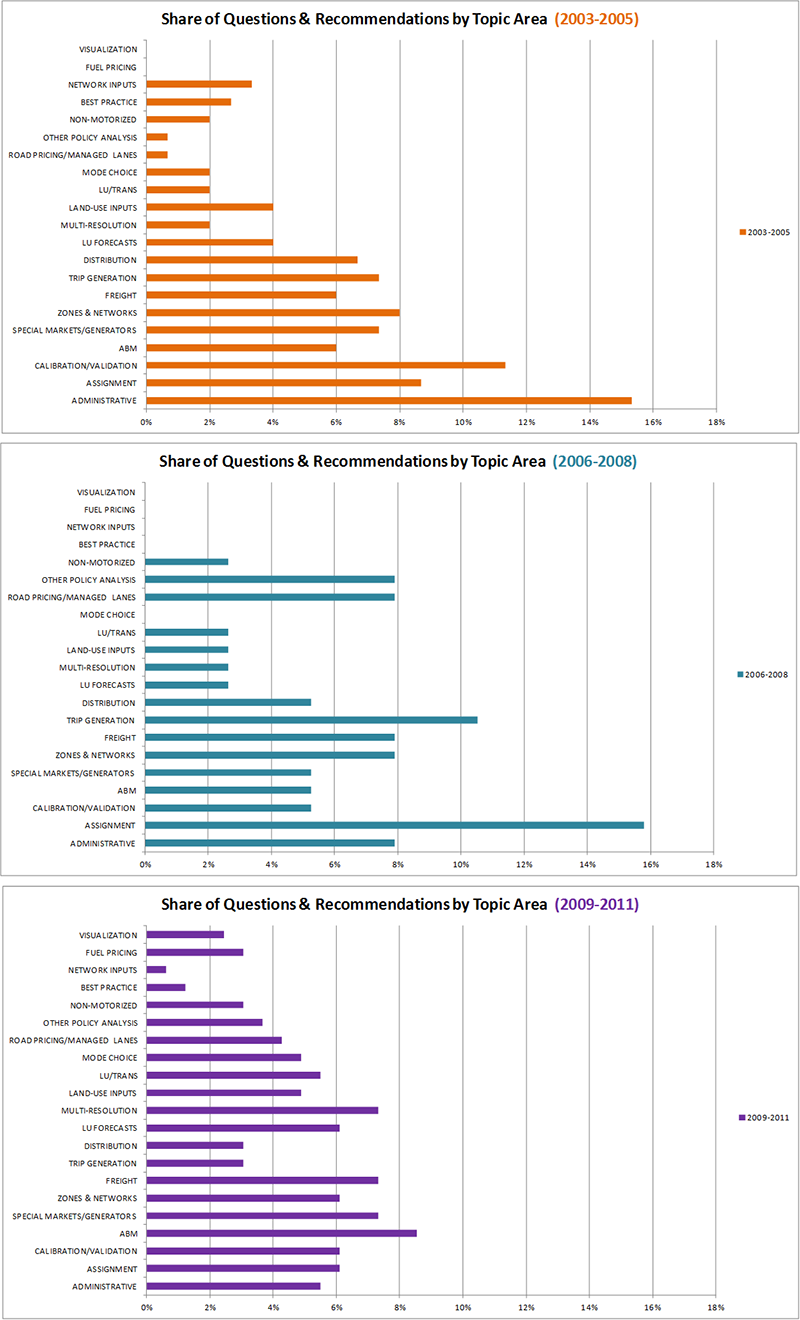
Figure 17 Share of Questions and Recommendations by Topic Area by Calendar Year

