
The Baltimore Regional Transportation Board (BRTB) is the federally designated Metropolitan Planning Organization (MPO) for the cities of Annapolis and Baltimore, and the counties of Anne Arundel, Baltimore, Carroll, Harford, and Howard (see Figure 2‑1). The agency is responsible for transportation planning and policy in the region. Specifically, the agency provides policy direction and oversight in the development of a federally mandated Long Range Transportation Plan (Plan It 2035, a copy of the Plan is available here: http://www.baltometro.org/plans/final-plan-it-2035-2), Short Range Plan (2014-2017 STIP/TIP, a draft list of the projects by jurisdiction is available here: http://www.baltometro.org/plans/transportation-improvement-program-2014-2017), and the transportation component of the State Air Quality Implementation Plan. In addition, BRTB manages the Unified Planning Work Program (UPWP), which provides a list of transportation-related tasks and studies to be undertaken in the region over a period of one year. The Baltimore Metropolitan Council (BMC) provides technical assistance and staff support to the MPO policy board. For instance, BMC is responsible for maintaining the transportation model for the Baltimore planning region.
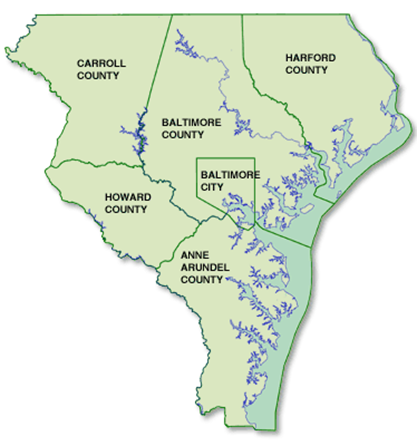
Figure 2‑1: Baltimore Regional Transportation Board (BRTB) MPO Area
(source: Baltimore Metropolitan Council website, available at: http://www.baltometro.org/about-the-region/map)
The current (2010) population, number of households, and employment in the Baltimore region are over 2.6 million, 1 million, and 1.5 million, respectively (source: BMC's presentation to the peer review panel). In the next 30 years, these numbers are expected to rise by 14%, 17%, and 26%, respectively (see Figure 2‑2). In addition, historic data shows a positive growth in the 65+ population age group (see Table 2‑1). Further, average household size in the region has decreased, and 1- and 2-person households have increased over the years.[1]
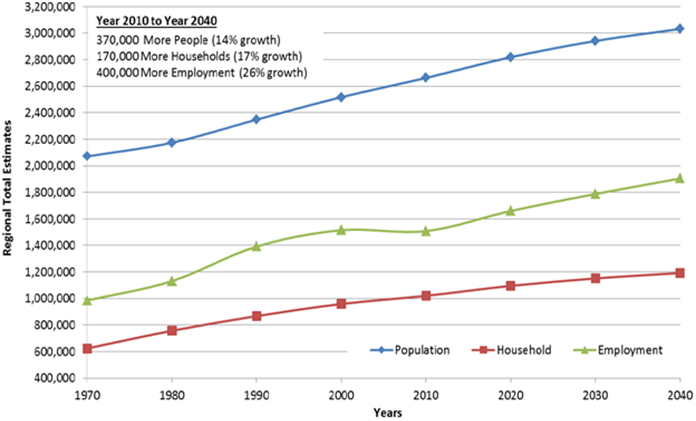
Figure 2‑2: Historical Growth and Projection in Households, Population, and Employment
(reproduced from BMC's peer review panel presentation)
Table 2‑1: Population Age Distribution in Baltimore MPO Area
(source: 1980, 1990, and 2000 Census and 2009 American Community Survey)
| Age | 1980 | 1990 | 2000 | 2009 |
|---|---|---|---|---|
| 0-4 | 6.3% | 7.6% | 6.5% | 6.5% |
| 5-19 | 24.5% | 19.4% | 21.4% | 19.6% |
| 20-44 | 38.4% | 42.2% | 37.0% | 34.4% |
| 45-64 | 20.7% | 19.1% | 23.0% | 27.1% |
| 65+ | 10.1% | 11.6% | 12.0% | 12.4% |
There are also substantial inter-regional interactions in terms of where people live and work (see Figure 2‑3). For example, the number of workers who live in the City of Baltimore but work in Washington D.C. has risen from about 115,000 to 130,000 workers between 2000 and 2010. Over the same period, the reverse flow of workers (i.e., workers who live in Washington D.C. but work in Baltimore) has increased from about 45,000 to 60,000 (source: BMC's presentation to the peer review panel).
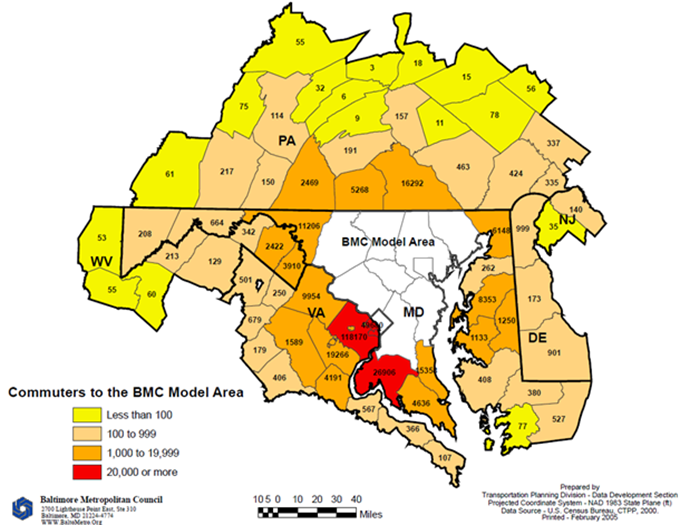
Figure 2‑3: Commuters to Baltimore Model Area
(data source: U.S. Census Bureau, CTPP 2000. The figure is available at: http://www.baltometro.org/images/stories/BMC_CommuteShed.pdf)
In addition, the region faces a number of environmental challenges such as established statewide goals for greenhouse gas reduction and protection of the Chesapeake Bay Critical Area. A portion of the Chesapeake Bay falls within the jurisdiction of Baltimore City, Anne Arundel County, Baltimore County, and Harford County. Thus, any land use and transportation planning in these jurisdictions must protect the quality of the Bay. When considering freight, the region is expecting significant changes in cargo movements at the Port of Baltimore and in freight movements across the study area due to the Panama Canal Expansion Project, which is expected to double the capacity of the Canal by 2015[2]. The Port of Baltimore is one of the two ports on the East Coast that are ready to efficiently handle super-sized ships that are expected to use the Canal once the project is complete.
In 2013, the state of Maryland raised the motor fuel tax by 3.5 cents. Maryland fuel tax will be adjusted annually to reflect the Consumer Price Index in the future. The action addresses the depletion of the State's Transportation Trust Fund. The increase in the trust fund will allow Maryland Departpemnt of Transportaion (MDOT) to implement needed transportation projects.
It is clear from the above discussion that the Baltimore region is currently facing a number of challenges that can be adequately addressed only by advanced modeling tools. In the next two chapters, existing travel demand model for the region, its limitations, and the agency's plan to improve available modeling tools are discussed.
[1] Source: Critical Issues and Challenges in the 21st Century. The report is published by the BMC and is available at: http://www.baltometro.org/PlanIt2035/planit2035ch2pt1.pdf.
[2] Source: "Panama Canal Expansion Study" Phase I Report: Development in Trade and National and Global Economies, November 2013. The report is available here: http://www.marad.dot.gov/wp-content/uploads/pdf/Panama_Canal_Phase_I_Report_-_20Nov2013.pdf

