U.S. Department of Transportation
Federal Highway Administration
1200 New Jersey Avenue, SE
Washington, DC 20590
202-366-4000
Federal Highway Administration Research and Technology
Coordinating, Developing, and Delivering Highway Transportation Innovations
| REPORT |
| This report is an archived publication and may contain dated technical, contact, and link information |
|
| Publication Number: FHWA-HRT-12-033 Date: December 2012 |
Publication Number: FHWA-HRT-12-033 Date: December 2012 |
The most ambitious fully automated driving activity appears to be occurring in Japan’s Energy ITS project, which has been developing and testing a platoon of three fully automated trucks for close to 5 years. This project, under the sponsorship of METI through its New Energy Technology Development Organization (NEDO), has been funded at the equivalent of about $12 million per year for 5 years. The work is being conducted by researchers at multiple universities, with coordination and management by the Japan Automobile Research Institute (JARI) but with little direct involvement by the truck manufacturers. The primary goal is to attain energy savings (CO2 reductions) through the reduction of aerodynamic drag by operating trucks in an electronically coupled platoon at shorter-than-normal gaps, with additional objectives of improving highway traffic flow and safety. Because of Japan’s rapidly aging population, its truck fleet operators are concerned about future shortages of truck drivers, which could be alleviated if the following trucks in the platoon could indeed be driverless.
The operational concept for this system has gone through some changes, motivated by political pressures from the sponsoring agency. Originally the project was planned to evaluate both a mixed–traffic and a dedicated–lane approach for truck platooning. After some evaluation, the researchers decided to focus on the dedicated-lane scenario based on technical feasibility considerations, but then the sponsors directed them to switch their attention to the mixed–traffic scenario. After several years of development activities, the project manager saw problems with the feasibility of the mixed–traffic scenario, based on its mixed treatment of driver roles and responsibilities (unable to control but still in the control loop in an ambiguous way). At present, the project manager does not see a clear way past this challenge, because operation of fully automated platoons without drivers in the following trucks on dedicated lanes will not be possible until the future and would involve significant complications in assembling and disassembling the platoons in special staging areas.
The target trucks for this work are 25–ton single–unit trucks, which are the typical type of heavy truck used for over-the-road freight hauling in Japan. The trucks have been retrofitted with an extensive suite of sensors, actuators, computers, and displays, and their cargo compartments have been equipped as mobile office space, with computer racks, desktops, displays, and seats for visitors to receive demonstration rides. Researchers tested the trucks on a section of the New Tomei Expressway before it was opened to public traffic, but most testing and demonstrations have been performed at the test track of the Agency for Industrial Science and Technology, part of METI, near Tsukuba City. The researchers provided a demonstration of these trucks to attendees of the active safety conference, FAST-Zero, in September 2011.
The intended operations of the Energy ITS project truck platoon system are summarized in figure 36,(30) indicating that all of the trucks are expected to be driven automatically while in the platoon, although the drivers would be responsible for the lane-changing maneuvers associated with entering and leaving the platoon.
The components and subsystems that were added to the trucks to implement the automated platoon functions are summarized schematically in figure 37.(30) Note that two different sensor technologies are used for forward ranging, both laser and millimeter wave radars. The laser radar has a very wide field of regard so that it can be used to detect cut-in maneuvers by cars or other trucks (as was demonstrated successfully). When an unauthorized vehicle (a private car) cuts into the platoon, the truck behind it breaks away from the platoon and follows the cut–in vehicle at a much larger gap, using a basic ACC strategy. When the intruding vehicle departs, the following truck can re-connect to the platoon. The steering actuators and V2V communication systems are redundant for safety purposes. The lane-position detection is performed by using video cameras that face down at the front and rear of the truck so that the two separate measurements can be used to identify both lateral displacement and yaw angle relative to the solid lane marking on the left side of the truck. A laser scanner system for lane–marker detection has also been tested and will be added as a redundant source of lane position information. For safety considerations, the braking rate of the first truck is limited to substantially less than the braking capabilities of the following trucks. The control computers have also been designed for safety considerations, with each truck equipped with two dual–processor computers provided by a railway signal maker. This increases cost and complexity but greatly reduces the likelihood of a catastrophic system failure.
The performance requirements for the truck platoon system are summarized in figure 38.(30) Emergency braking at 0.4 g (4 m/s2 or 12.9 ft/s2) was demonstrated for visitors in September 2011, and the higher braking rate of 0.5 g (5 m/s2 or 16.1 ft/s2) is planned for later stages of the project. The 0.4 g (4 m/s2 or 12.9 ft/s2) braking rate is hard enough that passengers feel significant pressure as their bodies press against their shoulder belt restraints.
The Energy ITS team has developed a variety of scenarios to prove the feasibility of the maneuvers needed to form and break a platoon, as shown in figure 39,(30) and they demonstrated those scenarios in September 2011. In the first scenario, a third truck joined a two-truck platoon in the middle. To accommodate this, the following truck in the platoon increased its following distance to 35 m (115 ft) to leave enough space for the new truck to enter, and they then formed a new platoon. The steady cruising of the second scenario was performed at a 15-m (49-ft) gap, although the target gap for the end of the program is 10 m (33 ft). In the third scenario, an unauthorized non-equipped vehicle cut into the gap between the second and third trucks, but this was detected by the wide-angle laser radar on the third truck, which proceeded to increase its gap so that it followed the intruder vehicle at a safe gap by using ACC car following. The final scenario was the emergency braking already mentioned. An additional scenario that was not demonstrated to visitors was a coordinated lane change by the entire platoon to avoid a vehicle stopped in its lane.
The goal of the Energy ITS project is, of course, drag reduction to reduce CO2 emissions. In support of this goal, researchers conducted computational fluid dynamics simulations to predict the extent of the drag reduction before full-scale tests could be performed under all conditions of interest. Some of the results of these simulations are shown in figure 40,(30) together with some early results from test–track tests of the full-size trucks. The colored plots on the left of figure 40(30) show visualizations of air speeds and pressures around the truck platoon. The plot on the upper right of the figure shows the estimated reductions in the drag coefficients of each truck at the minimum gap of 4 m (13 ft). Because the aerodynamic drag accounts for only about half of the truck energy use at highway speeds, these percentage reductions are much larger than the reductions in energy use. The plot in the lower right corner of figure 40(30) converts these results to estimates of fuel consumption savings as a function of vehicle–following gap. The results of test-track experiments with the full–scale truck platoon at a 10-m (33-ft) gap are plotted for comparison with the predictions. The second truck had the largest fuel savings, whereas the third truck saved slightly less fuel. The 14–percent average fuel saving for the entire platoon shown here was somewhat higher than the trend of what was predicted from the simulation. Note that even the first truck saved about 10 percent of its fuel consumption by being coupled in the platoon at a 10-m (33-ft) gap.
One aspect of the Energy ITS truck platoon system that is not yet well developed is the driver interface. There is a complex display screen in each truck, which includes much technical information of interest to the researchers developing the system, but it is likely to be overwhelming for a truck driver in real–world operations. At the request of the truck drivers, it includes live video of the first driver’s forward view, which is transmitted to the drivers of the two following trucks. This display screen is shown in figure 41(16) as a picture that was taken before the trucks started to move. In addition to the display screen in the truck, the driver is also expected to monitor three types of information displays on the back of the preceding trailer, as shown in figure 42.(16) The three colored lights at the lower center of the trailer have been coded to represent a large number of different operating conditions, based on different patterns of colors for the center and outer lights and whether they are illuminated steadily or flashing.
The Energy ITS program has not yet succeeded in stimulating strong interest in the Japanese trucking fleets, who would be the end users of the system. Although Japanese trucking fleets are intrigued by the potential energy savings and reductions in driver labor costs, they are concerned about the complications of forming a platoon among trucks from different fleets, especially when the energy–saving benefits depend on their position within the platoon.

Figure 36. Presentation slide. Energy ITS truck platoon definition of capabilities. NOTE: V2V = vehicle-to-vehicle communication, ACC = adaptive cruise control, CACC = cooperative adaptive cruise control.

Figure 37. Diagram. Automation equipment installed on Energy ITS trucks. NOTE: GPS = global positioning system, IMU = inertial measurement unit, V2V = vehicle-to-vehicle communication, HMI = human–machine interface
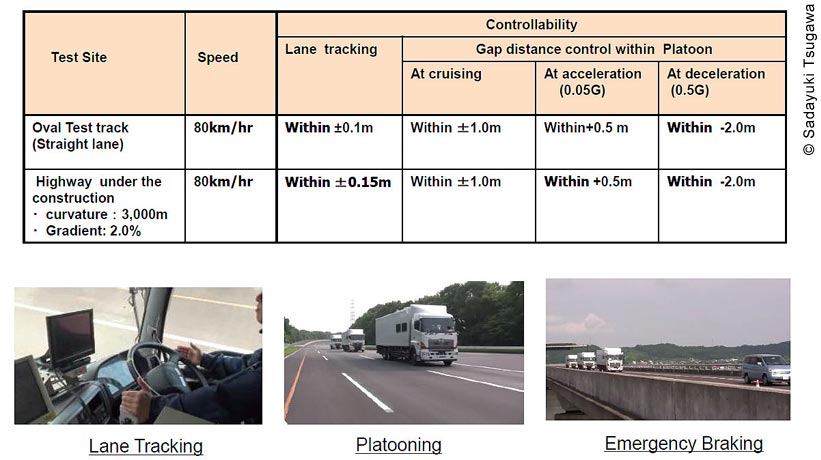
Figure 38. Presentation slide. Performance requirements for Energy ITS truck platoon system.
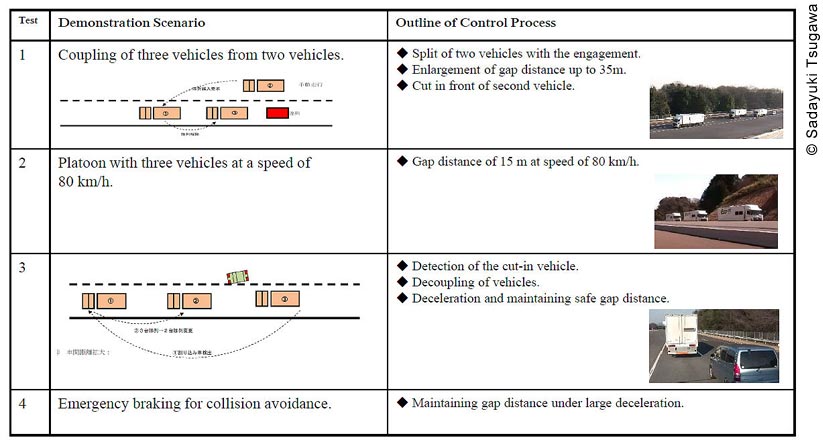
Figure 39. Diagram. Maneuver scenarios for Energy ITS project truck platoon. NOTE: 80 km/h = 50 mi/h.
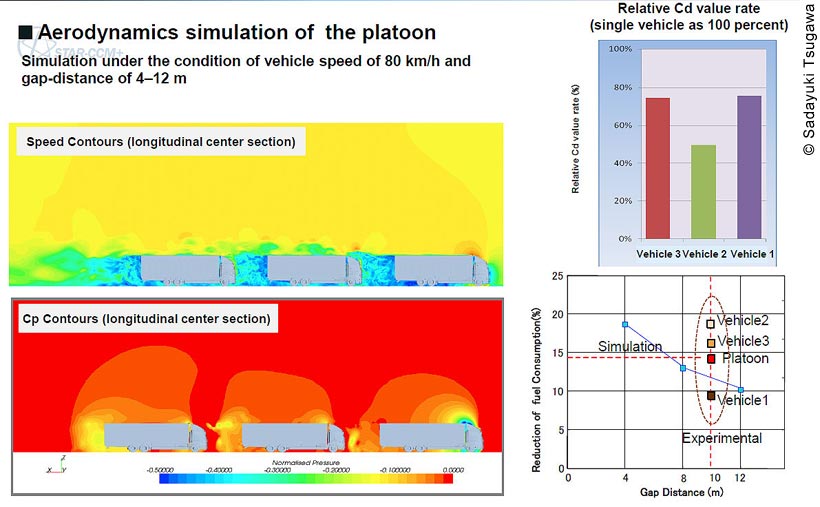
Figure 40. Presentation slide. First predictions of aerodynamic drag effects of Energy ITS project truck platooning, compared with experimental results on full–scale trucks. NOTE: 80 km/h = 50 mi/h, 4 m–12 m = 13 ft–40 ft, Cd = drag coefficient, Cp = pressure coefficient.
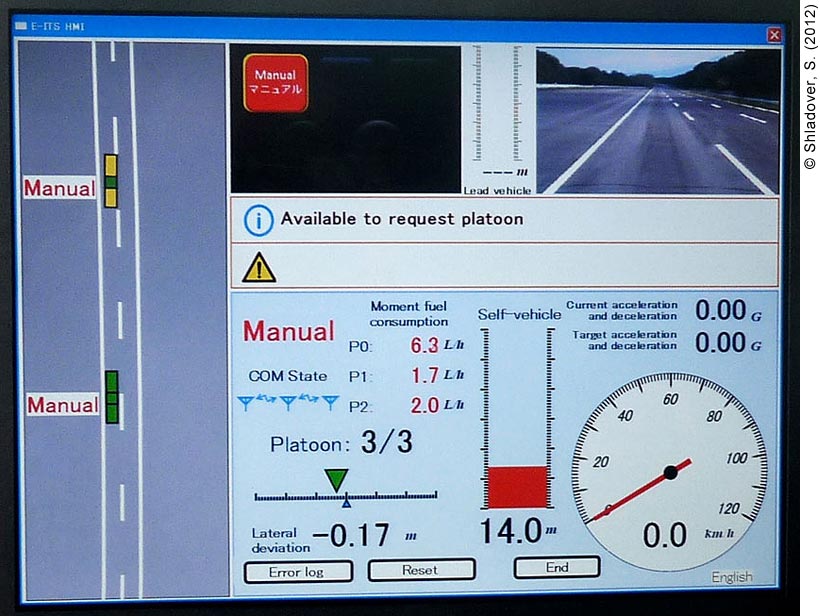
Figure 41. Photo. In-vehicle display screen of a following truck in the Energy ITS platoon.
Toyota Motor Company has developed and tested a platoon of three Lexus LS-460 passenger cars that follow each other closely to reduce fuel consumption. Toyota has described this work in a few conference papers but has not provided any demonstrations of the system to visitors. This system uses frequent V2V communication to coordinate longitudinal motions of the vehicles and includes both forward– and rear–facing millimeter–wave radars on each vehicle to provide redundant information about the range and range rate between successive vehicles. Toyota reported string stability of vehicle-following control, with 10-m (33-ft) gaps and spacing errors of 1 m (3.3 ft) or less, including decelerations up to 0.4 g (4 m/s2 or 12.9 ft/s2). These vehicles did not include automation of lateral control.
Published results show impressive fuel savings from this system, which was optimized for fuel economy.(31) The aerodynamic drag reductions were reported in the 40 percent range for the following vehicles and in the 8–9 percent range for the leading vehicle at a 10-m (33-ft) gap. Even at a 20-m (66-ft) gap they were still reporting 25 percent drag reductions for the following vehicles. The second vehicle saved somewhat more than did the third vehicle when direct fuel consumption measurements were recorded, in the 8–10 percent range (compared with 1–2 percent for the leading vehicle) at 10-m (33-ft) gaps, with gradual declines in savings as the gaps were increased in 5-m (16-ft) increments to 30 m (98 ft).
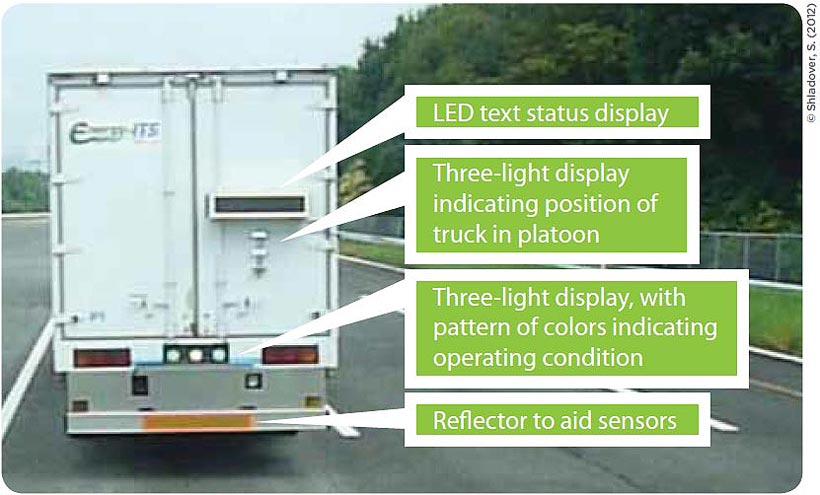
Figure 42. Photo. Rear view of Energy ITS truck with three information displays. NOTE: LED = light–emitting diode.