U.S. Department of Transportation
Federal Highway Administration
1200 New Jersey Avenue, SE
Washington, DC 20590
202-366-4000
Federal Highway Administration Research and Technology
Coordinating, Developing, and Delivering Highway Transportation Innovations
| REPORT |
| This report is an archived publication and may contain dated technical, contact, and link information |
|
| Publication Number: FHWA-HRT-11-060 Date: November 2011 |
Publication Number: FHWA-HRT-11-060 Date: November 2011 |
the test results presented in this chapter demonstrate that conventional fusion-bonded epoxy coating significantly reduces the corrosion of reinforcing steel. Epoxy-coated bars initiate corrosion at chloride contents that are generally several times greater and corrode at rates that are typically two orders of magnitude below those exhibited by conventional reinforcement. The results show that cracks in concrete directly over and parallel to the reinforcement, such as found in bridge decks, result in earlier corrosion initiation and higher corrosion rates than obtained with intact concrete for all systems tested.
Epoxies that provide initially high adhesion to the underlying steel provide no advantage in terms of improved corrosion performance or improved adhesion when used in concrete. Using concrete with a reduced w/c ratio (and thus, lower permeability) lowers the corrosion rate for both conventional reinforcement and ECR under all conditions in intact concrete but provides only limited corrosion protection, at best, in the presence of cracks, which allow direct access of chlorides to reinforcing bars. Corrosion inhibitors consistently provided improved corrosion protection when used in conjunction with conventional reinforcement and ECR in intact concrete but to a lesser degree in cracked concrete. Corrosion inhibitors had a greater relative effect on uncoated than on coated reinforcement. Bars with an MC system consisting of 98 percent zinc and 2 percent aluminum and conventional epoxy exhibit high corrosion rates in cases when the concrete is often wet but corrosion rates similar to those exhibited by conventional ECR under conditions similar to those in bridge decks; the metallic coating corrodes in preference to the underlying steel, providing some additional protection. All coated bars exhibited corrosion losses at openings through the coating. The reduction in adhesion between an epoxy coating and the reinforcing steel (often referred to as disbondment) that occurs after a period of exposure to corrosive conditions increases with increasing chloride content in the concrete and in the presence of cracks and decreases with the use of corrosion inhibitors, with the use of MC reinforcement, and with electrical isolation of the epoxy-coated bars from each other. Corrosion products form under the disbonded coating. Disbondment does not affect the rate at which coated bars corrode.
All systems were evaluated using rapid macrocell tests. The bare bar test, however, was not used to evaluate corrosion inhibitors. The results presented in this section represent the average of six specimens. The epoxy on all bars was penetrated with four 3.2-mm (0.125-inch)-diameter holes, representing 1.0 percent of the total area in contact with the solution, as previously described.
Corrosion losses (total thickness of metal lost due to corrosion calculated by integrating the corrosion rate) for the individual specimens in the rapid macrocell test are summarized in table 9 and table 10, which express the results based on the total area of the bars in contact with the test solutions and on the area of steel exposed by the four holes through the coating on each epoxy-coated bar.
Table 9. Corrosion loss at 15 weeks (![]() m) for rapid macrocell specimens based on total area.
m) for rapid macrocell specimens based on total area.
| Steel Designationa | Specimen | Average | Standard Deviation | |||||
|---|---|---|---|---|---|---|---|---|
| 1 | 2 | 3 | 4 | 5 | 6 | |||
Controls |
||||||||
Conv. |
7.1 |
5.3 |
4.7 |
7.4 |
6.5 |
5.2 |
6.0 |
1.12 |
Mb-Conv. |
5.8 |
6.7 |
3.5 |
3.8 |
3.8 |
5.4 |
4.8 |
1.33 |
ECR |
0.256 |
0.649 |
0.215 |
0.381 |
0.494 |
0.018 |
0.336 |
0.222 |
M-ECR |
0.000 |
0.000 |
0.000 |
0.000 |
-0.004 |
0.000 |
-0.001 |
0.001 |
Epoxies with increased adhesion |
||||||||
ECR(Chromate) |
0.101 |
0.000 |
0.000 |
0.000 |
0.000 |
0.055 |
0.026 |
0.043 |
M-ECR(Chromate) |
0.000 |
0.000 |
0.000 |
0.000 |
0.000 |
0.000 |
0.000 |
0.000 |
ECR(DuPont) |
0.000 |
0.438 |
0.336 |
0.361 |
0.425 |
0.418 |
0.330 |
0.166 |
M-ECR(DuPont) |
0.000 |
0.000 |
0.000 |
0.000 |
0.000 |
0.000 |
0.000 |
0.000 |
ECR(Valspar) |
0.266 |
0.389 |
0.599 |
0.083 |
0.056 |
0.499 |
0.315 |
0.221 |
M-ECR(Valspar) |
0.000 |
-0.003 |
0.000 |
0.000 |
0.000 |
0.000 |
0.000 |
0.001 |
Corrosion inhibitors in mortar |
||||||||
M-ECR(DCI) |
0.000 |
-0.003 |
0.000 |
0.000 |
0.000 |
0.000 |
0.000 |
0.001 |
M-ECR(RH) |
0.000 |
0.000 |
0.000 |
0.000 |
0.000 |
0.000 |
0.000 |
0.000 |
M-ECR(HY) |
0.000 |
0.000 |
0.000 |
0.000 |
0.000 |
0.000 |
0.000 |
0.000 |
M-ECR(primer/Ca(NO2)2) |
0.000 |
0.000 |
0.000 |
0.000 |
0.008 |
0.009 |
0.003 |
0.004 |
Epoxies with increased adhesion plus calcium nitrite in mortar |
||||||||
M-ECR(Chromate)-DCI |
0.000 |
0.000 |
0.000 |
0.000 |
0.000 |
0.000 |
0.000 |
0.000 |
M-ECR(DuPont)-DCI |
0.000 |
0.000 |
0.000 |
0.000 |
0.000 |
0.000 |
0.000 |
0.000 |
M-ECR(Valspar)-DCI |
0.000 |
0.000 |
0.000 |
0.000 |
0.000 |
0.000 |
0.000 |
0.000 |
Bars with multiple coatings |
||||||||
MC(both layers penetrated) |
0.043 |
0.041 |
0.007 |
0.007 |
-0.038 |
0.023 |
0.014 |
0.030 |
M-MC(both layers penetrated) |
-0.004 |
0.001 |
0.001 |
0.000 |
-0.011 |
0.000 |
-0.002 |
0.005 |
MC(only epoxy penetrated) |
0.064 |
0.022 |
0.108 |
0.050 |
0.039 |
0.060 |
0.057 |
0.029 |
M-MC(only epoxy penetrated) |
0.020 |
0.030 |
0.017 |
0.024 |
0.006 |
0.022 |
0.020 |
0.008 |
1 ![]() m = 0.0394 mil
m = 0.0394 mil
a See table 1 for abbreviation definitions.
b M prefix indicates mortar-wrapped specimen, otherwise bare bar
specimen.
Table 10. Corrosion loss at 15 weeks (![]() m) for rapid macrocell specimens based on area exposed at holes through coating.
m) for rapid macrocell specimens based on area exposed at holes through coating.
| Steel Designationa | Specimen | Average | Standard Deviation | |||||
|---|---|---|---|---|---|---|---|---|
| 1 | 2 | 3 | 4 | 5 | 6 | |||
Controls |
||||||||
Conv. |
- |
- |
- |
- |
- |
- |
- |
- |
Mb-Conv. |
- |
- |
- |
- |
- |
- |
- |
- |
ECR |
25.6 |
64.9 |
21.5 |
38.1 |
49.4 |
1.8 |
33.6 |
22.2 |
M-ECR |
0.000 |
0.000 |
0.000 |
0.000 |
-0.352 |
0.000 |
-0.059 |
0.144 |
Epoxies with increased adhesion |
||||||||
ECR(Chromate) |
10.14 |
0.00 |
0.00 |
0.00 |
0.04 |
5.49 |
2.61 |
4.29 |
M-ECR(Chromate) |
0.000 |
0.000 |
0.000 |
0.000 |
0.000 |
0.000 |
0.000 |
0.000 |
ECR(DuPont) |
0.0 |
43.8 |
33.6 |
36.1 |
42.5 |
41.8 |
33.0 |
16.6 |
M-ECR(DuPont) |
0.000 |
0.000 |
0.000 |
0.000 |
0.000 |
0.000 |
0.000 |
0.000 |
ECR(Valspar) |
26.6 |
38.9 |
59.9 |
8.3 |
5.6 |
49.9 |
31.5 |
22.1 |
M-ECR(Valspar) |
0.000 |
-0.282 |
0.000 |
0.000 |
0.000 |
0.000 |
-0.047 |
0.115 |
Corrosion inhibitors in mortar |
||||||||
M-ECR(DCI) |
0.000 |
-0.282 |
0.000 |
0.000 |
0.000 |
0.000 |
-0.047 |
0.115 |
M-ECR(RH) |
0.000 |
0.000 |
0.000 |
0.000 |
0.000 |
0.000 |
0.000 |
0.000 |
M-ECR(HY) |
0.000 |
0.000 |
0.000 |
0.000 |
0.000 |
0.000 |
0.000 |
0.000 |
M-ECR(primer/Ca(NO2)2) |
0.000 |
0.000 |
0.000 |
0.000 |
0.774 |
0.925 |
0.283 |
0.441 |
Epoxies with increased adhesion plus calcium nitrite in mortar |
||||||||
M-ECR(Chromate)-DCI |
0.000 |
0.000 |
0.000 |
0.000 |
0.000 |
0.000 |
0.000 |
0.000 |
M-ECR(DuPont)-DCI |
0.000 |
0.000 |
0.000 |
0.000 |
0.000 |
0.000 |
0.000 |
0.000 |
M-ECR(Valspar)-DCI |
0.000 |
0.000 |
0.000 |
0.000 |
0.000 |
0.000 |
0.000 |
0.000 |
Bars with multiple coatings |
||||||||
MC(both layers penetrated) |
4.26 |
4.13 |
0.65 |
0.66 |
-3.82 |
2.27 |
1.36 |
2.99 |
M-MC(both layers penetrated) |
-0.35 |
0.12 |
0.08 |
0.00 |
-1.06 |
0.00 |
-0.20 |
0.45 |
MC(only epoxy penetrated) |
6.35 |
2.21 |
10.78 |
5.00 |
3.86 |
6.03 |
5.70 |
2.91 |
M-MC(only epoxy penetrated) |
1.96 |
2.97 |
1.66 |
2.37 |
0.57 |
2.18 |
1.95 |
0.81 |
1 ![]() m = 0.0394 mil
m = 0.0394 mil
- No test.
a See table 1 for abbreviation definitions.
b M prefix indicates mortar-wrapped specimen, otherwise bare bar
specimen.
The average corrosion rates for the systems evaluated using bare bars are shown in figure 30 and figure 31. The two figures differ in the scale of the vertical axis. The corrosion rate represents the average based on the total area exposed to the test solution.
1 ![]() m = 0.0394 mil
m = 0.0394 mil
Figure 30. Graph. Macrocell test, average corrosion rate for bare conventional, ECR, increased-adhesion ECR, and MC steel in simulated pore solution with 1.6 molal ion concentration of sodium chloride.
Figure 31. Graph. Macrocell test, average corrosion rate for bare ECR, increased-adhesion ECR, and MC steel in simulated pore solution with 1.6 molal ion concentration of sodium chloride (adjusted y-axis).
The results indicate that conventional steel corroded at a
much higher rate than any of the epoxy-coated bars in the test, with a rate
that ranged between 7 and 40 ![]() m/year (0.3 and 1.6 mil/year) during
the 15-week test. Based on corrosion rate, the epoxy-coated bars fell into two
groups, with conventional ECR, ECR(DuPont), and ECR(Valspar) corroding at an
average rate between 0.5 and 1.7
m/year (0.3 and 1.6 mil/year) during
the 15-week test. Based on corrosion rate, the epoxy-coated bars fell into two
groups, with conventional ECR, ECR(DuPont), and ECR(Valspar) corroding at an
average rate between 0.5 and 1.7 ![]() m/year (0.02
and 0.067 mil/year) and ECR(Chromate) and the MC bars (both layers penetrated and only epoxy penetrated) corroding at an average rate between -0.1 and 0.6
m/year (0.02
and 0.067 mil/year) and ECR(Chromate) and the MC bars (both layers penetrated and only epoxy penetrated) corroding at an average rate between -0.1 and 0.6 ![]() m/year (-0.004 and 0.02
mil/year). The negative corrosion rate, which indicates more oxidation at the
cathode than at the anode, may be explained by the amphoteric nature of zinc.
As demonstrated in the figures, corrosion
rates varied significantly from week to week. Conventional reinforcement
exhibited significant increases in corrosion between weeks 5 and 6 and between
weeks 10 and 11, when the solutions were changed.
m/year (-0.004 and 0.02
mil/year). The negative corrosion rate, which indicates more oxidation at the
cathode than at the anode, may be explained by the amphoteric nature of zinc.
As demonstrated in the figures, corrosion
rates varied significantly from week to week. Conventional reinforcement
exhibited significant increases in corrosion between weeks 5 and 6 and between
weeks 10 and 11, when the solutions were changed.
Total corrosion losses, which are calculated by integrating
the corrosion rate over the test period, are shown in figure 32 and figure 33 and
in table 9 and table 10. Figure 32 expresses the losses based on the total area of the bars in contact with
the text solutions, while figure 33 expresses the losses in terms of the area
of steel exposed by the holes through the epoxy coating, which for macrocell
specimens equals the values based on total bar surface multiplied by a factor
of 100. Over the 15-week period, total losses for conventional steel equaled
approximately 6 ![]() m (0.2 mil). For conventional
ECR, ECR(DuPont), and ECR(Valspar), total losses ranged from 0.31 and 0.34
m (0.2 mil). For conventional
ECR, ECR(DuPont), and ECR(Valspar), total losses ranged from 0.31 and 0.34 ![]() m (0.012 and
0.013 mil) based on total area and between 31 and 34
m (0.012 and
0.013 mil) based on total area and between 31 and 34 ![]() m (1.2 and 1.3 mil) based on exposed area. For the
ECR(Chromate) and MC bars, total losses were below 0.057
m (1.2 and 1.3 mil) based on exposed area. For the
ECR(Chromate) and MC bars, total losses were below 0.057 ![]() m (0.0022 mil) based
on total area and 5.7
m (0.0022 mil) based
on total area and 5.7 ![]() m (0.22 mil) based on exposed
area. The low macrocell corrosion rates for the MC bars resulted because the
test measures macrocell rather than microcell corrosion and because, as an
amphoteric material, zinc is attacked by the alkaline solution at the cathode
(with twice that area of the anode) as well as by the combined alkaline and
salt solution at the anode, reducing the net macrocell current.
m (0.22 mil) based on exposed
area. The low macrocell corrosion rates for the MC bars resulted because the
test measures macrocell rather than microcell corrosion and because, as an
amphoteric material, zinc is attacked by the alkaline solution at the cathode
(with twice that area of the anode) as well as by the combined alkaline and
salt solution at the anode, reducing the net macrocell current.
Figure 32. Graph. Macrocell test, average corrosion loss based on total area for bare conventional, ECR, increased-adhesion ECR, and MC steel in simulated pore solution with 1.6 molal ion concentration of sodium chloride.
Figure 33. Graph. Macrocell test, average corrosion loss based on area exposed at holes through coating for bare conventional, ECR, increased-adhesion ECR, and MC steel in simulated pore solution with 1.6 molal ion concentration of sodium chloride.
The corrosion potentials shown in figure 34 and figure 35 (anode and cathode bars disconnected for 2 h) provide additional information on the behavior of the specimens. With the exception of ECR(Chromate), all specimens exhibited corrosion potentials at the anode more negative than -0.275 V with respect to an SCE (approximately equivalent to -0.350 V for a CSE), indicating that the bars were undergoing active corrosion. In contrast to bars with only steel exposed to the test solutions, the MC bars initially exhibited corrosion potentials of approximately of -1.200 V at both the anode and cathode, indicating active corrosion of the zinc layer. The MC bars with both layers of coating penetrated reached a corrosion potential of about -0.500 V after 3 weeks, indicating that the effect of the zinc surrounding the holes had been largely reduced and that the exposed area of steel was governing the corrosion process. In contrast, the MC bars with only the epoxy penetrated maintained a significantly more negative corrosion potential than the other anode bars, indicating that the zinc was still providing some protection for the underlying steel for a significant portion of the test period. Interestingly, the corrosion potentials of the MC cathode bars are similar to those at the anode throughout the test period. The fact that the MC cathode bars never reached a corrosion potential more positive than -0.275 V, as exhibited by all of the other bars, suggests that the zinc continues to contribute to the performance of the system over time. With the exception of ECR(Chromate), the corrosion potentials exhibited by the other corrosion-protection systems showed a strong similarity to that of uncoated conventional reinforcement, indicating that the differences in observed corrosion rates shown in figure 30 and figure 31 are primarily based on the role of the epoxy coating in limiting the exposed bar surface at both the anode and the cathode. In terms of total metal loss, that effect is significant (see table 9, table 10, figure 32, and figure 33).
Figure 34. Graph. Macrocell test, average corrosion potential at anode for bare conventional, ECR, increased-adhesion ECR, and MC steel in simulated pore solution with 1.6 molal ion concentration of sodium chloride.
Figure 35. Graph. Macrocell test, average corrosion potential at cathode for bare conventional, ECR, increased-adhesion ECR, and MC steel in simulated pore solution with 1.6 molal ion concentration of sodium chloride.
As a general rule in the bare bar tests, the corrosion rates for ECR based on the area exposed at the holes through the coating were significantly higher than they were for conventional reinforcement based on the total area of the bar (see table 9 and table 10). This behavior, however, does not necessarily mean that corrosion losses on damaged regions of ECR are higher than local metal losses due to corrosion on uncoated conventional reinforcement because the losses recorded for uncoated conventional steel represent values that are averaged over the full contact surface. In practice, corrosion losses on uncoated bars are not uniformly distributed over the bar surface but may be much greater in some areas than in others. In addition, the losses calculated for coated bars may include losses that occur under the coating, instead of just on the exposed regions.
The test specimens were evaluated visually following the
tests, and all specimens in the group exhibited significant corrosion, as shown
in figure 36, figure 37, and figure 38 for conventional reinforcement,
conventional ECR, and MC with only the epoxy layer penetrated, respectively. Figure
38 shows that the zinc was fully consumed on the MC bars in spite of the fact
that the total corrosion loss on the exposed area based on the macrocell
current (shown in figure 33) amounted to
less than 6 ![]() m (0.2 mil) for a coating that
was 50
m (0.2 mil) for a coating that
was 50 ![]() m
(2 mil) thick. This observation demonstrates the impact of microcell
corrosion, which was not measured in this test, on the loss of zinc and
indicates that macrocell measurements may underestimate total corrosion losses.
m
(2 mil) thick. This observation demonstrates the impact of microcell
corrosion, which was not measured in this test, on the loss of zinc and
indicates that macrocell measurements may underestimate total corrosion losses.
Figure 36. Photo. Bare conventional anode bar at 15 weeks showing corrosion products that formed below the surface of the solution.
Figure 37. Photo. Bare ECR anode bar at 15 weeks showing corrosion products that formed at holes through the epoxy.
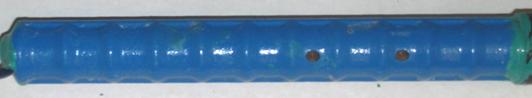
Figure 38. Photo. Bare MC anode bar with only epoxy penetrated at 15 weeks showing corrosion products that formed at holes through the epoxy.
In addition to the tests described above, bare ECR and MC bars were subjected to extended rapid macrocell tests using 6.04 molal ion sodium chloride solutions for periods of up to 40 weeks with the goal of evaluating the relative disbondment characteristics of conventional ECR and MC bars under the severe exposure conditions produced in the test as a function of corrosion loss and time. The results of that evaluation, reported in detail appendix A, demonstrate that in the rapid macrocell test with a high chloride concentration, the specimens with MC reinforcement show greater corrosion losses than the specimens with conventional ECR but that MC reinforcement shows significantly less disbondment than ECR, both as a function of corrosion loss and as a function of time.
The corrosion rates using mortar-wrapped specimens for conventional steel, conventional ECR, ECR(primer/Ca(NO2)2), and MC bars with both layers penetrated and only the epoxy penetrated are shown in figure 39 and Figure 40. In figure 40, the corrosion rate is based on the exposed area at the holes through the coating.
Figure 39. Graph. Macrocell test, average corrosion rate based on total area for mortar-wrapped conventional, ECR, ECR with calcium nitrite primer, and MC steel in simulated pore solution with 1.6 molal ion concentration of sodium chloride.
Figure 40. Graph. Macrocell test, average corrosion rate based on area exposed at holes through coating for mortar-wrapped conventional ECR, ECR with calcium nitrite primer, and MC steel in simulated pore solution with 1.6 molal ion concentration of sodium chloride.
The corrosion rate based on total area for conventional steel
started at approximately 2.5 ![]() m/year (0.098 mil/year), increasing to about 21
m/year (0.098 mil/year), increasing to about 21 ![]() m/year (0.83 mil/year)
at week 9, and remained between 18 and 23
m/year (0.83 mil/year)
at week 9, and remained between 18 and 23 ![]() m/year
(0.71 and 0.91 mil/year) thereafter. As shown in figure 40, conventional ECR exhibited essentially no
corrosion during the test, while the corrosion current exhibited by the other
test specimens shown in the figure was relatively minor. The MC bars with only
the epoxy penetrated exhibited a high corrosion rate between weeks 2 and 5; the
rate decreased to zero after week 5. The other systems tested, including ECR
with improved adhesion (ECR(Chromate)), ECR(DuPont), ECR(Valspar)), ECR in
mortar with a corrosion inhibitor (calcium nitrite, Rheocrete® 222+ or Hycrete™), and the three epoxies with improved adhesion in mortar with
calcium nitrite, exhibited no corrosion in the test.
m/year
(0.71 and 0.91 mil/year) thereafter. As shown in figure 40, conventional ECR exhibited essentially no
corrosion during the test, while the corrosion current exhibited by the other
test specimens shown in the figure was relatively minor. The MC bars with only
the epoxy penetrated exhibited a high corrosion rate between weeks 2 and 5; the
rate decreased to zero after week 5. The other systems tested, including ECR
with improved adhesion (ECR(Chromate)), ECR(DuPont), ECR(Valspar)), ECR in
mortar with a corrosion inhibitor (calcium nitrite, Rheocrete® 222+ or Hycrete™), and the three epoxies with improved adhesion in mortar with
calcium nitrite, exhibited no corrosion in the test.
Corrosion losses based on total and exposed areas for the
systems that did exhibit corrosion are shown in figure 41 and figure 42,
respectively. Corrosion losses at 15 weeks for all specimens are presented in table 9 and table 10. Total losses for
conventional steel amounted to 4.8 ![]() m (0.19 mil) at 15 weeks,
compared to values of less than 0.02
m (0.19 mil) at 15 weeks,
compared to values of less than 0.02 ![]() m (0.0008 mil) based on total area for other systems and amounted to less than 2
m (0.0008 mil) based on total area for other systems and amounted to less than 2 ![]() m (0.08 mil) for the MC bars with only the epoxy penetrated and less than 0.5
m (0.08 mil) for the MC bars with only the epoxy penetrated and less than 0.5 ![]() m (0.02 mil) for the other systems based on exposed area.
m (0.02 mil) for the other systems based on exposed area.
1 ![]() m = 0.0394 mil
m = 0.0394 mil
Figure 41. Graph. Macrocell test, average corrosion loss based on total area for mortar-wrapped conventional, ECR, ECR with calcium nitrite, and MC steel in simulated pore solution with 1.6 molal ion concentration of sodium chloride.
1 ![]() m = 0.0394 mil
m = 0.0394 mil
Figure 42. Graph. Macrocell test, average corrosion loss based on area exposed at holes through coating for mortar-wrapped conventional, ECR, ECR with calcium nitrite, and MC steel in simulated pore solution with 1.6 molal ion concentration of sodium chloride.
The average corrosion potentials during the tests, shown in figure 43 through figure 46, demonstrate that at the anode, only those steels that exhibited some corrosion loss (see table 9 and table 10) had corrosion potentials more negative than -0.275 V, with the exception of ECR(Chromate) in mortar containing calcium nitrite (ECR(Chromate)-DCI), which dropped below -0.275 V after week 12. The potential of the ECR(primer/Ca(NO2)2) bars, which did exhibit corrosion, dropped to approximately -0.400 V at 7 weeks, maintaining that value thereafter. The MC specimens with both layers penetrated and with only epoxy penetrated, exhibited progressively more negative potentials as the test progressed (see figure 43 and figure 44). For the MC bars with both layers penetrated, the corrosion potential started at approximately -0.400 V, dropping to a value somewhat more negative than -0.700 V at 15 weeks at both the anode and the cathode. The MC bars with only epoxy penetrated started at approximately -0.600 V, ending at a value equal to that for the same bars with both layers penetrated. The corrosion potentials of the cathodes for the MC bar tests started at only slightly more positive values than exhibited by the anodes, dropping to values between -0.600 and -0.800 V at 15 weeks. These results suggest that the MC bars started the tests in a passive condition and became relatively more active as the simulated pore solutions, both with and without sodium chloride, penetrated the mortar. The zinc provided protection during the test for both types of damage to the coating.
Figure 43. Graph. Macrocell test, average corrosion potential at anode for mortar-wrapped conventional, ECR, ECR with increased adhesion, ECR cast with corrosion inhibitor, and ECR with calcium nitrite in simulated pore solution with 1.6 molalion concentration of sodium chloride.
Figure 44. Graph. Macrocell test, average corrosion potential at cathode for mortar-wrapped conventional, ECR, ECR with increased adhesion, ECR cast with corrosion inhibitor, and ECR with calcium nitrite in simulated pore solution with 1.6 molal ion concentration of sodium chloride.
Figure 45. Graph. Macrocell test, average corrosion potential at anode for mortar-wrapped MC steel in simulated pore solution with 1.6 molal ion concentration of sodium chloride.
Figure 46. Graph. Macrocell test, average corrosion potential at cathode for mortar-wrapped MC steel in simulated pore solution with 1.6 molal ion concentration of sodium chloride.
At the conclusion of the tests, the mortar was removed and the bars were inspected for evidence of corrosion. The uncoated conventional steel bars exhibited corrosion, as shown in figure 47, while none of the epoxy-coated bars exhibited any corrosion products.
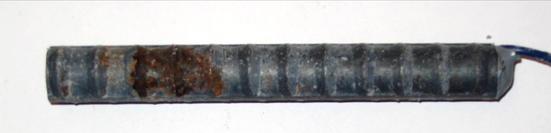
Figure 47. Photo. Conventional anode bar after removal of mortar at 15 weeks.
The results shown in table 9, table 10, and figure 27 through figure 35 indicate several things about the corrosion process for steel with a damaged epoxy coating. As mentioned for the bare bar tests, the epoxy coating significantly reduced total corrosion losses. But more than that, the tests demonstrated that, even with a relatively homogenous material like the mortar used, the chloride concentrations at the surface of the bar are likely to vary, providing concentrations high enough to initiate corrosion at some locations but not high enough at all locations. This is clearly the case for mortar-wrapped conventional steel, as shown in figure 47, where the corrosion products are distributed nonuniformly across the bar surface. The exposed steel at locations where epoxy is damaged should begin to corrode at the same chloride concentration as uncoated conventional steel. When this does not occur, as demonstrated in these tests, it is likely that the chloride concentration at the location of the damaged epoxy has not reached the critical chloride threshold. Thus, even damaged ECR will have an advantage over conventional steel because all locations that are damaged may not be subjected to chloride concentrations high enough to cause corrosion, while under the same conditions for uncoated steel, the chloride concentration would be high enough to initiate corrosion somewhere on the bars.
The test results also suggest that if this test is to be used to evaluate the corrosion protection provided by damaged epoxy coating (as opposed to systems with uncoated bars for which it provides a consistent measure of corrosion resistance), the severity of the exposure conditions should be increased, such as would be provided by an increased number of penetrations in the epoxy or by an increase in the concentration of chloride in the solution at the anode.(31) In the end, the test results for the mortar-wrapped rapid macrocell tests provide a general comparison of the performance of the systems studied.
The results of the southern exposure and cracked beam tests provide a detailed picture of the performance of the corrosion-protection systems in this study. The systems, as reported in the following sections, were compared based on average values for a minimum of three specimens for each configuration and corrosion-protection system. Six southern exposure and cracked beam specimens were used for conventional reinforcing steel and conventional ECR with four holes through the epoxy cast in concrete with a w/c ratio of 0.45 (ECR-4h-45).
Test results expressed in terms of corrosion loss provide an overall view of system performance. Values based on the total area of the bar in contact with concrete and on the exposed area at holes in the epoxy are presented in table 11 and table 12, respectively. For these tests, the corrosion rates and losses based on the exposed area at the holes for bars with 4 and 10 penetrations through the epoxy on each bar are, respectively, 480 and 192 times the corrosion rate based on total bar area. As noted in the tables, two of the six epoxy-coated bars with four holes through the epoxy cast in concrete with a w/c ratio of 0.45 (ECR-4h-45) and a number of other individual specimens with different types of epoxy are not included in the averages because the corrosion rates remained essentially zero throughout the tests. The low corrosion rate on individual epoxy-coated bars resulted from the highly variable chloride content in the concrete. As observed for the mortar-wrapped rapid macrocell specimens with epoxy-coated bars, if the chloride content adjacent to the damage site on the bar is not high enough, corrosion will not be induced. In contrast, uncoated bars have a much larger exposed area, any part of which is susceptible to a chloride content high enough to induce corrosion. Variations in concrete quality can also play a role, and such variations occurred on this project, as described in the interim report.(48) The original southern exposure specimens containing conventional and conventional ECR had a lower than desired w/c ratio. As a result, those tests were repeated and provided the results in this report. The results through 96 weeks for the original conventional and conventional ECR are reported by Draper et al.(49)
Table 13 and table 14 summarize the average chloride content at a depth of 25 mm (1 inch) in the southern exposure specimens at corrosion initiation and at the conclusion of the 96-week test period. The average values at corrosion initiation are weighted based on the number of samples taken per specimen and are used subsequently in this report to estimate the time to corrosion initiation in bridge decks.
Table 11. Corrosion loss at 96 weeks (![]() m) for
southern exposure specimens
based on total area.
m) for
southern exposure specimens
based on total area.
| Steel Designationa | Specimen | Average | Standard Deviation | |||||||||||
|---|---|---|---|---|---|---|---|---|---|---|---|---|---|---|
| 1 | 2 | 3 | 4 | 5 | 6 | |||||||||
Controls |
||||||||||||||
Conv.-45 |
7.23 |
5.59 |
6.71 |
6.06 |
7.48 |
9.44 |
7.083 |
1.352 |
||||||
Conv.2-45 |
14.31 |
13.79 |
15.23 |
14.44 |
0.731 |
|||||||||
Conv.-35 |
1.05 |
4.22 |
1.10 |
2.121 |
1.817 |
|||||||||
ECR-4h-45 |
0.038 |
-0.011b |
-0.011b |
0.011 |
0.011 |
0.001 |
0.015 |
0.016 |
||||||
ECR-10h-45 |
0.019 |
0.008 |
0.023 |
0.017 |
0.008 |
|||||||||
ECR-10h-35 |
0.011 |
0.003 |
0.010 |
0.008 |
0.004 |
|||||||||
Epoxies with increased adhesion |
||||||||||||||
ECR(Chromate)-4h-45 |
0.004 |
0.015 |
0.035 |
0.018 |
0.016 |
|||||||||
ECR(Chromate)-10h-45 |
0.011 |
0.068 |
0.123 |
0.067 |
0.056 |
|||||||||
ECR(DuPont)-4h-45 |
0.031 |
0.017 |
0.030 |
0.026 |
0.008 |
|||||||||
ECR(DuPont)-10h-45 |
0.029 |
0.060 |
0.050 |
0.046 |
0.016 |
|||||||||
ECR(Valspar)-4h-45 |
0.039 |
0.015 |
0.044 |
0.032 |
0.016 |
|||||||||
ECR(Valspar)-10h-45 |
0.054 |
0.044 |
0.090 |
0.063 |
0.024 |
|||||||||
Corrosion inhibitors in concrete |
||||||||||||||
Conv.2(DCI)-45 |
9.63 |
7.28 |
8.88 |
8.60 |
1.200 |
|||||||||
Conv.2(RH)-45 |
3.11 |
2.29 |
4.79 |
3.40 |
1.276 |
|||||||||
Conv.2(HY)-45 |
1.24 |
1.59 |
1.82 |
1.55 |
0.292 |
|||||||||
ECR(DCI)-4h-45 |
0.002 |
0.008 |
0.002 |
0.004 |
0.003 |
|||||||||
ECR(DCI)-10h-45 |
-0.002b |
0.020 |
0.016 |
0.018 |
0.003 |
|||||||||
ECR(DCI)-10h-35 |
0.012 |
0.001 |
0.008 |
0.007 |
0.006 |
|||||||||
ECR(RH)-4h-45 |
0.000 |
0.030 |
-0.002b |
0.015 |
0.021 |
|||||||||
ECR(RH)-10h-45 |
0.001 |
-0.011b |
0.003 |
0.002 |
0.001 |
|||||||||
ECR(RH)-10h-35 |
0.002 |
0.005 |
0.003 |
0.003 |
0.001 |
|||||||||
ECR(HY)-4h-45 |
-0.001b |
-0.002b |
-0.002b |
0.000 |
- |
|||||||||
ECR(HY)-10h-45 |
0.003 |
-0.001b |
0.003 |
0.003 |
0.000 |
|||||||||
ECR(HY)-10h-35 |
0.006 |
-0.002b |
-0.001b |
0.006 |
- |
|||||||||
ECR(primer/Ca(NO2)2)-4h-45 |
0.005 |
0.012 |
0.026 |
0.014 |
0.011 |
|||||||||
ECR(primer/Ca(NO2)2)-10h-45 |
0.031 |
0.137 |
0.022 |
0.064 |
0.064 |
|||||||||
ECR(primer/Ca(NO2)2)-10h-35 |
0.003 |
0.002 |
0.001 |
0.002 |
0.001 |
|||||||||
Epoxies with increased adhesion plus calcium nitrite in concrete |
||||||||||||||
ECR(Chromate)-DCI-4h-45 |
0.002 |
-0.000b |
0.018 |
0.010 |
0.011 |
|||||||||
ECR(DuPont)-DCI-4h-45 |
-0.000b |
-0.001b |
0.001 |
0.001 |
- |
|||||||||
ECR(Valspar)-DCI-4h-45 |
0.000 |
0.002 |
0.033 |
0.012 |
0.019 |
|||||||||
Bars with multiple coatings |
||||||||||||||
MC(both layers penetrated)-4h-45 |
0.030 |
0.013 |
0.016 |
0.020 |
0.009 |
|||||||||
MC(both layers penetrated)-10h-45 |
0.055 |
0.229 |
0.153 |
0.146 |
0.088 |
|||||||||
MC(only epoxy penetrated)-4h-45 |
0.012 |
0.007 |
-0.001 |
0.006 |
0.006 |
|||||||||
MC(only epoxy penetrated)-10h-45 |
0.001 |
0.021 |
0.026 |
0.016 |
0.013 |
|||||||||
1 ![]() m = 0.0394 mil
m = 0.0394 mil
- No standard deviation.
Blank cells indicate no specimen tested.
a See table 1 for abbreviation definitions. 4h = bar with four holes
through epoxy, 10h = bar with 10 holes through epoxy. 35 = concrete with w/c = 0.35, 45 = concrete with w/c = 0.45.
b Excluded from average.
Table 12. Corrosion loss at 96 weeks (![]() m)
for southern exposure specimens
based on area exposed at holes through coating.
m)
for southern exposure specimens
based on area exposed at holes through coating.
| Steel Designationa | Specimen | Average | Standard Deviation | |||||
|---|---|---|---|---|---|---|---|---|
| 1 | 2 | 3 | 4 | 5 | 6 | |||
Controls |
||||||||
ECR-4h-45 |
18.44 |
-5.26b |
-5.32b |
5.07 |
5.18 |
0.70 |
7.35 |
7.68 |
ECR-10h-45 |
3.66 |
1.58 |
4.41 |
3.21 |
1.47 |
|||
ECR-10h-35 |
2.03 |
0.55 |
1.83 |
1.47 |
0.80 |
|||
Epoxies with increased adhesion |
||||||||
ECR(Chromate)-4h-45 |
2.11 |
7.28 |
16.89 |
8.76 |
7.50 |
|||
ECR(Chromate)-10h-45 |
2.04 |
12.99 |
23.66 |
12.90 |
10.81 |
|||
ECR(DuPont)-4h-45 |
14.71 |
7.99 |
14.32 |
12.34 |
3.77 |
|||
ECR(DuPont)-10h-45 |
5.52 |
11.50 |
9.68 |
8.90 |
3.07 |
|||
ECR(Valspar)-4h-45 |
18.76 |
7.00 |
20.97 |
15.58 |
7.51 |
|||
ECR(Valspar)-10h-45 |
10.33 |
8.53 |
17.22 |
12.03 |
4.58 |
|||
Corrosion inhibitors in concrete |
||||||||
ECR(DCI)-4h-45 |
0.99 |
3.62 |
0.84 |
1.82 |
1.57 |
|||
ECR(DCI)-10h-45 |
-0.37b |
3.90 |
3.17 |
3.53 |
0.52 |
|||
ECR(DCI)-10h-35 |
2.25 |
0.11 |
1.49 |
1.29 |
1.08 |
|||
ECR(RH)-4h-45 |
0.00 |
14.46 |
-0.74b |
7.23 |
10.23 |
|||
ECR(RH)-10h-45 |
0.27 |
-2.08b |
0.63 |
0.45 |
0.26 |
|||
ECR(RH)-10h-35 |
0.48 |
0.94 |
0.52 |
0.65 |
0.26 |
|||
ECR(HY)-4h-45 |
-0.39b |
-0.95b |
-1.13b |
0.00 |
- |
|||
ECR(HY)-10h-45 |
0.65 |
-0.20b |
0.66 |
0.65 |
0.01 |
|||
ECR(HY)-10h-35 |
1.17 |
-0.30b |
-0.17b |
1.17 |
- |
|||
ECR(primer/Ca(NO2)2)-4h-45 |
2.18 |
5.63 |
12.35 |
6.72 |
5.17 |
|||
ECR(primer/Ca(NO2)2)-10h-45 |
6.02 |
26.41 |
4.32 |
12.25 |
12.29 |
|||
ECR(primer/Ca(NO2)2)-10h-35 |
0.61 |
0.48 |
0.17 |
0.42 |
0.22 |
|||
Epoxies with increased adhesion plus calcium nitrite in concrete |
||||||||
ECR(Chromate)-DCI-4h-45 |
1.06 |
-0.21b |
8.59 |
4.82 |
5.33 |
|||
ECR(DuPont)-DCI-4h-45 |
-0.21b |
-0.49b |
0.28 |
0.28 |
- |
|||
ECR(Valspar)-DCI-4h-45 |
-0.07b |
1.16 |
16.08 |
8.62 |
10.55 |
|||
Bars with multiple coatings |
||||||||
MC(both layers penetrated)-4h-45 |
30.47 |
30.75 |
21.96 |
27.73 |
5.00 |
|||
MC(both layers penetrated)-10h-45 |
100.15 |
136.15 |
109.50 |
115.3 |
18.68 |
|||
MC(only epoxy penetrated)-4h-45 |
8.96 |
25.20 |
13.51 |
15.89 |
8.38 |
|||
MC(only epoxy penetrated)-10h-45 |
5.06 |
34.37 |
12.70 |
17.37 |
15.20 |
|||
1 ![]() m = 0.0394 mil
m = 0.0394 mil
- No standard deviation.
Blank cells indicate no specimen tested.
a See table 1 for abbreviation definitions. 4h = bar with four holes
through epoxy, 10h = bar with 10 holes through epoxy. 35 = concrete with w/c of
0.35, 45 = concrete with w/c of 0.45.
b Excluded from average.
Table 13. Chloride content at corrosion initiation (kg/m3) for southern exposure specimens.
| Steel Designationa | Samples per Specimenb | Specimen | Average | Standard Deviation | |||||
|---|---|---|---|---|---|---|---|---|---|
| 1 | 2 | 3 | 4 | 5 | 6 | ||||
Controls |
|||||||||
Conv.-45 |
6 |
0.65 |
1.07 |
0.38 |
1.38 |
0.39 |
0.66c |
0.77 |
0.39 |
Conv.2-45 |
6 |
1.58c |
0.66c |
0.48 |
0.88 |
0.65 |
|||
Conv.-35 |
2 |
1.93d |
0.75 |
1.90 |
1.69 |
0.80 |
|||
ECR-4h-45 |
6 |
1.54 |
0.99 |
* |
3.52 |
† |
2.48 |
2.13 |
1.11 |
ECR-10h-45 |
2 |
3.43 |
9.26e |
8.36 |
7.57 |
2.62 |
|||
ECR-10h-35 |
3 |
† |
† |
† |
† |
† |
|||
Epoxies with increased adhesion |
|||||||||
ECR(Chromate)-4h-45 |
2 |
5.54 |
8.30f |
8.47 |
7.56 |
2.56 |
|||
ECR(Chromate)-10h-45 |
2 |
2.44 |
3.73 |
† |
3.08 |
0.91 |
|||
ECR(DuPont)-4h-45 |
2 |
8.77 |
7.73 |
4.24 |
6.91 |
2.37 |
|||
ECR(DuPont)-10h-45 |
2 |
1.56 |
2.17 |
5.41d |
3.99 |
1.96 |
|||
ECR(Valspar)-4h-45 |
2 |
8.17 |
7.25f |
7.15 |
7.48 |
1.31 |
|||
ECR(Valspar)-10h-45 |
2 |
5.11 |
2.77 |
† |
3.94 |
1.65 |
|||
Corrosion inhibitors in concrete |
|||||||||
Conv.2-DCI-45 |
6 |
2.88 |
3.03 |
5.26 |
3.72 |
1.12 |
|||
Conv.2-RH-45 |
6 |
1.97c |
2.26 |
2.24 |
2.16 |
0.76 |
|||
Conv.2-HY-45 |
6 |
† |
0.82 |
0.62 |
1.21 |
0.24 |
|||
ECR(DCI)-4h-45 |
2 |
4.52 |
† |
5.74d |
5.44 |
1.36 |
|||
ECR(DCI)-10h-45 |
2 |
† |
5.78 |
7.29 |
6.53 |
1.06 |
|||
ECR(DCI)-10h-35 |
2 |
2.18 |
2.67 |
1.41 |
2.09 |
0.64 |
|||
ECR(RH)-4h-45 |
6 |
3.44 |
2.17f |
3.38 |
3.16 |
0.96 |
|||
ECR(RH)-10h-45 |
2 |
† |
* |
4.01 |
4.01 |
- |
|||
ECR(RH)-10h-35 |
2 |
* |
1.52 |
0.73 |
1.13 |
0.56 |
|||
ECR(HY)-4h-45 |
6 |
† |
1.19 |
† |
1.19 |
- |
|||
ECR(HY)-10h-45 |
2 |
0.79 |
* |
1.03 |
0.91 |
0.17 |
|||
ECR(HY)-10h-35 |
2 |
0.60 |
0.43d |
0.35f |
0.44 |
0.24 |
|||
ECR(primer/Ca(NO2)2)-4h-45 |
2 |
4.47 |
† |
3.51 |
3.99 |
0.68 |
|||
ECR(primer/Ca(NO2)2)-10h-45 |
2 |
6.36 |
13.80 |
7.47 |
9.21 |
4.01 |
|||
ECR(primer/Ca(NO2)2)-10h-35 |
6 |
* |
1.48 |
* |
1.48 |
- |
|||
Epoxies with increased adhesion plus calcium nitrite in concrete |
|||||||||
ECR(Chromate)-DCI-4h-45 |
2 |
2.26 |
1.20 |
4.86 |
2.77 |
1.88 |
|||
ECR(DuPont)-DCI-4h-45 |
2 |
3.91 |
3.50d |
11.4f |
5.73 |
3.65 |
|||
ECR(Valspar)-DCI-4h-45 |
2 |
* |
1.56 |
9.13 |
5.35 |
4.13 |
|||
Bars with multiple coatings |
|||||||||
MC(both layers penetrated)-4h-45 |
2 |
† |
† |
0.71 |
0.71 |
- |
|||
MC(both layers penetrated)-10h-45 |
2 |
† |
1.48 |
0.96 |
1.22 |
0.37 |
|||
MC(only epoxy penetrated)-4h-45 |
2 |
0.69 |
1.75 |
2.63 |
1.69 |
0.97 |
|||
MC(only epoxy penetrated)-10h-45 |
2 |
5.26 |
2.53 |
† |
3.90 |
1.92 |
|||
1 kg/m3 =1.69 lb/yd3
* Corrosion initiation not recorded.
† Information not available.
- No standard deviation.
Blank cells indicate no specimen tested.
a See table 12 for abbreviation definitions.
b Unless otherwise noted.
c Five samples analyzed; d Six samples analyzed; e Four
samples analyzed; f Three samples analyzed.
Table 14. Chloride content at 96 weeks (kg/m3) for southern exposure specimens.
Steel Designationa |
Specimen |
Average |
Standard Deviation |
|||||
|---|---|---|---|---|---|---|---|---|
1 |
2 |
3 |
4 |
5 |
6 |
|||
Controls |
||||||||
Conv.-45 |
10.65 |
13.16 |
7.09 |
8.51 |
8.08 |
9.01 |
9.42 |
2.18 |
Conv.2-45 |
4.53 |
3.88 |
6.02 |
4.81 |
1.09 |
|||
Conv.-35 |
5.96 |
8.31 |
5.74 |
6.67 |
1.43 |
|||
ECR-4h-45 |
6.92 |
6.83 |
9.42 |
8.15 |
7.79 |
6.13 |
7.54 |
1.17 |
ECR-10h-45 |
12.38 |
13.31 |
13.34 |
13.01 |
0.55 |
|||
ECR-10h-35 |
5.96 |
8.31 |
5.74 |
6.67 |
1.43 |
|||
Epoxies with increased adhesion |
||||||||
ECR(Chromate)-4h-45 |
13.14 |
15.98 |
13.74 |
14.29 |
1.50 |
|||
ECR(Chromate)-10h-45 |
11.34 |
19.49 |
9.24 |
13.35 |
5.42 |
|||
ECR(DuPont)-4h-45 |
12.82 |
17.49 |
10.98 |
13.76 |
3.36 |
|||
ECR(DuPont)-10h-45 |
14.46 |
15.64 |
10.74 |
13.61 |
2.56 |
|||
ECR(Valspar)-4h-45 |
14.34 |
13.39 |
23.93 |
17.22 |
5.83 |
|||
ECR(Valspar)-10h-45 |
17.71 |
18.79 |
8.12 |
14.87 |
5.88 |
|||
Corrosion inhibitors in concrete |
||||||||
Conv.2(DCI)-45 |
4.73 |
8.87 |
8.00 |
12.11 |
3.67 |
|||
Conv.2(RH)-45 |
4.43 |
3.97 |
4.47 |
7.22 |
0.47 |
|||
Conv.2(HY)-45 |
3.13 |
2.45 |
3.23 |
4.94 |
0.72 |
|||
ECR(DCI)-4h-45 |
† |
† |
† |
- |
- |
|||
ECR(DCI)-10h-45 |
† |
† |
† |
- |
- |
|||
ECR(DCI)-10h-35 |
7.97 |
4.53 |
2.45 |
4.98 |
2.79 |
|||
ECR(RH)-4h-45 |
3.74 |
7.76 |
5.88 |
5.79 |
2.01 |
|||
ECR(RH)-10h-45 |
7.74 |
4.99 |
6.49 |
6.41 |
1.38 |
|||
ECR(RH)-10h-35 |
1.56 |
2.94 |
3.73 |
2.74 |
1.10 |
|||
ECR(HY)-4h-45 |
2.76 |
3.04 |
4.74 |
3.51 |
1.07 |
|||
ECR(HY)-10h-45 |
1.78 |
2.89 |
3.73 |
2.80 |
0.98 |
|||
ECR(HY)-10h-35 |
0.74 |
1.61 |
2.23 |
1.53 |
0.75 |
|||
ECR(primer/Ca(NO2)2)-4h-45 |
9.25 |
9.93 |
10.25 |
9.81 |
0.51 |
|||
ECR(primer/Ca(NO2)2)-10h-45 |
9.83 |
9.19 |
11.53 |
10.18 |
1.21 |
|||
ECR(primer/Ca(NO2)2)-10h-35 |
1.69 |
2.81 |
2.73 |
2.41 |
0.62 |
|||
Epoxies with increased adhesion plus calcium nitrite in concrete |
||||||||
ECR(Chromate)-DCI-4h-45 |
7.86 |
6.42 |
7.44 |
7.24 |
0.74 |
|||
ECR(DuPont)-DCI-4h-45 |
7.95 |
6.06 |
8.35 |
7.45 |
1.23 |
|||
ECR(Valspar)-DCI-4h-45 |
8.35 |
4.93 |
8.19 |
7.16 |
1.93 |
|||
Bars with multiple coatings |
||||||||
MC(both layers penetrated)-4h-45 |
11.13 |
10.22 |
11.76 |
11.04 |
0.77 |
|||
MC(both layers penetrated)-10h-45 |
12.76 |
12.56 |
12.79 |
12.70 |
0.12 |
|||
MC(only epoxy penetrated)-4h-45 |
8.85 |
15.37 |
9.84 |
11.35 |
3.52 |
|||
MC(only epoxy penetrated)-10h-45 |
11.62 |
13.23 |
11.21 |
12.02 |
1.07 |
|||
1 kg/m3 =1.69 lb/yd3
† Information not available.
- No standard deviation.
Blank cells indicate no specimen tested.
a See table 12 for abbreviation definitions.
The chloride contents at corrosion initiation, 0.77 and 0.88 kg/m3 (1.30 and 1.48 lb/yd3), are within the expected range of 0.60 to 1.20 kg/m3 (1.0 to 2.0 lb/yd3) for conventional steel cast in concrete with w/c of 0.45 and somewhat higher, 1.69 kg/m3 (2.85 lb/yd3), in concrete with w/c of 0.35. With the notable exception of bars cast in concrete containing the corrosion inhibitor Hycrete™ (discussed later in this section), chloride contents at corrosion initiation for epoxy-coated bars and conventional bars cast in concrete containing a corrosion inhibitor are above, and in most cases well above, 1.20 kg/m3 (2.0 lb/yd3). The high value for epoxy-coated bars again emphasizes the effects of local variations in chloride content near damaged areas on epoxy-coated bars.
The chloride contents at 96 weeks for concretes without corrosion inhibitors with w/c of 0.45 range from 4.8 to 17.2 kg/m3 (8.1 to 29.0 lb/yd3); with just one exception (ECR-4h-45), these values exceed 11 kg/m3 (18.5 lb/yd3) only for specimens containing bars coated with epoxies with increased adhesion and bars with multiple coatings. The chloride contents at 96 weeks for concretes with corrosion inhibitors range from 2.4 to 10.1 kg/m3 (4.1 to 17.1 lb/yd3). As observed in earlier studies, the chloride values exhibit considerable scatter within individual specimens as well as from specimen to specimen, with the latter demonstrated in the tables.(50)
The variation in chloride contents and corrosion performance observed in these tests provides insight into the variability in corrosion performance observed in the field, where bridge decks reinforced with uncoated bars have provided service lives that range from 4 to 40 years for bridges in the same environment. That variability may be due to differences in concrete quality, both local and global, which can significantly affect the rate of chloride penetration.
Average corrosion rates for the southern exposure specimens, which are based on losses after corrosion has initiated, are summarized in table 15. For bars without coatings, the corrosion rates are expressed in terms of the total bar area, and for bars with coatings, the corrosion rates are expressed in terms of the area exposed at holes through the coating. As noted in chapter 2, there are a number of specimens with epoxy-coated bars for which no corrosion was observed, meaning that the specimens did not exhibit a measureable corrosion rate over time. This may be true even though a net corrosion loss was recorded (see table 11 and table 12).
Table 15. Average corrosion rate (![]() m/year) based on losses after corrosion initiation for southern exposure specimens.
m/year) based on losses after corrosion initiation for southern exposure specimens.
| Bars Without Coatings-Corrosion Rate Based on Total Area | ||||||||
|---|---|---|---|---|---|---|---|---|
| Steel Designationa | Specimen | Average | Standard Deviation | |||||
| 1 | 2 | 3 | 4 | 5 | 6 | |||
Controls |
||||||||
Conv.-45 |
5.35 |
4.41 |
5.10 |
6.04 |
5.82 |
7.40 |
5.69 |
1.01 |
Conv.2-45 |
10.7 |
9.74 |
10.0 |
10.1 |
0.49 |
|||
Conv.-35 |
5.99 |
8.68 |
1.61 |
5.43 |
3.57 |
|||
Corrosion inhibitors in concrete |
||||||||
Conv.2(DCI)-45 |
7.81 |
5.11 |
7.09 |
6.67 |
1.40 |
|||
Conv.2(RH)-45 |
2.57 |
2.60 |
3.56 |
2.91 |
0.56 |
|||
Conv.2(HY)-45 |
0.791 |
1.03 |
1.92 |
1.25 |
0.60 |
|||
Bars With Coatings-Corrosion Rate Based on Exposed Area |
||||||||
Steel Designation |
4 holes |
10 holes |
Average |
Standard Deviation |
||||
1 |
2 |
3 |
1 |
2 |
3 |
|||
Controls |
||||||||
ECR-45 |
13.6 |
b |
b |
5.98 |
18.4 |
12.7 |
10.43 |
5.32 |
6.74c |
5.09c |
bc |
||||||
ECR-35 |
1.49 |
b |
2.35 |
1.92 |
0.61 |
|||
Epoxies with increased adhesion |
||||||||
ECR(Chromate) |
b |
13.0 |
18.1 |
1.18 |
11.6 |
20.5 |
12.9 |
7.48 |
ECR(DuPont) |
13.8 |
24.3 |
b |
4.72 |
7.79 |
11.2 |
12.4 |
7.51 |
ECR(Valspar) |
15.5 |
5.91 |
44.0 |
12.3 |
6.52 |
17.4 |
16.9 |
14.0 |
Corrosion inhibitors in concrete |
||||||||
ECR(DCI)-45 |
b |
9.36 |
b |
b |
11.8 |
2.33 |
7.81 |
4.90 |
ECR(DCI)-35 |
2.32 |
b |
1.16 |
1.74 |
0.82 |
|||
ECR(RH)-45 |
b |
b |
5.94 |
b |
11.3 |
b |
8.63 |
3.80 |
ECR(RH)-35 |
b |
0.558 |
b |
0.558 |
- |
|||
ECR(HY)-45 |
b |
b |
b |
b |
b |
0.674 |
0.674 |
- |
ECR(HY)-35 |
1.08 |
b |
b |
1.080 |
- |
|||
ECR(primer/Ca(NO2)2)-45 |
b |
3.66 |
22.0 |
6.56 |
24.4 |
6.39 |
12.6 |
9.79 |
ECR(primer/Ca(NO2)2)-35 |
b |
1.41 |
b |
1.41 |
- |
|||
Epoxies with increased adhesion plus calcium nitrite in concrete |
||||||||
ECR(Chromate)-DCI-45 |
b |
b |
10.3 |
10.3 |
- |
|||
ECR(DuPont)-DCI-45 |
b |
b |
b |
b |
- |
|||
ECR(Valspar)-DCI-45 |
b |
b |
5.97 |
5.97 |
- |
|||
MC |
5.55d |
22.7d |
36.9d |
6.57d |
23.1d |
7.52d |
31.6 |
26.2 |
19.6e |
29.2e |
13.1e |
65.9e |
80.7e |
68.8e |
|||
1 ![]() m = 0.0394 mil
m = 0.0394 mil
- No standard deviation.
Blank cells indicate no specimen tested.
a See table 1 for abbreviation definitions. 35 = concrete with w/c of 0.35,
45 = concrete with w/c of 0.45.
b No corrosion observed.
c Specimens 4, 5, and 6.
d Both layers penetrated.
e Only epoxy penetrated.
In the following sections, a description of the results for the southern exposure tests of the control specimens is followed by those for the multiple corrosion-protection systems. The chapter also covers a study of uncoated conventional reinforcement cast in concrete containing corrosion inhibitors.
Control Specimens
The control specimens for
this study consisted of conventional steel cast in concrete with w/c ratios
of 0.45 (Conv.-45) and 0.35 (Conv.-35), conventional ECR cast in concrete with
w/c of 0.45 with 4 holes (ECR-4h-45) or 10 holes (ECR-10h-45) through
the epoxy, and conventional ECR cast in concrete with w/c of 0.35 with 10 holes
through the epoxy (ECR-10h-35). The corrosion rates based on total area in
contact with the concrete are shown in figure 48. The figure shows that, as
seen in the rapid macrocell test, corrosion proceeds at a much higher rate for
uncoated than for coated reinforcement, with the latter corroding at well below
1 percent of the rate of the former, a rate that is about equal to the
ratio of the area exposed at the holes to the total area of the bars. The lower w/c ratio provides additional protection
to conventional steel, with significant corrosion starting at about 48 weeks
for the concrete with w/c of 0.35, compared to 24 weeks for the concrete with w/c of 0.45. The corrosion rate for the
Conv.-45 specimens reached a maximum of 7.2 ![]() m/year (0.28 mil/year) at 94
weeks, but generally varied between 6 and 7
m/year (0.28 mil/year) at 94
weeks, but generally varied between 6 and 7 ![]() m/year (0.24 and 0.28 mil/year) during the final 24 weeks of the test. The corrosion rate of the
Conv.-35 specimens reached a maximum of approximately 4.2
m/year (0.24 and 0.28 mil/year) during the final 24 weeks of the test. The corrosion rate of the
Conv.-35 specimens reached a maximum of approximately 4.2 ![]() m/year (0.17 mil/year)
at 87 weeks while exhibiting a nearly constant rate between 3.9 and 4.2
m/year (0.17 mil/year)
at 87 weeks while exhibiting a nearly constant rate between 3.9 and 4.2 ![]() m/year (0.15
and 0.17 mil/year) between week 83 and the end of the test.
m/year (0.15
and 0.17 mil/year) between week 83 and the end of the test.
Figure 48. Graph. Southern exposure test, average corrosion rates based on total area for conventional reinforcement and ECR.
1 ![]() m = 0.0394 mil
m = 0.0394 mil
Figure 49. Graph. Southern exposure test, average corrosion loss based on total area for conventional reinforcement and ECR.
1 ![]() m = 0.0394 mil
m = 0.0394 mil
Figure 50. Graph. Southern exposure test, average corrosion loss based on area exposed at holes through coating for ECR.
The corrosion losses for the epoxy-coated bars based on the
area exposed at the holes through
the coating are shown in figure 50. As for the conventional steel, the lower
w/c ratio provided additional corrosion protection, with losses at 96 weeks for
the ECR-10h-35 specimens equal to about 50 percent of the losses for the
ECR-10h-45 specimens. The losses based on exposed area for the ECR-4h-45
specimens are considerably higher (7.2 ![]() m (0.28 mil)), more than twice
those based on exposed area for the ECR-10h-45 specimens. The losses based on
total area, however, are nearly identical at
0.015 and 0.017
m (0.28 mil)), more than twice
those based on exposed area for the ECR-10h-45 specimens. The losses based on
total area, however, are nearly identical at
0.015 and 0.017 ![]() m (0.00059 and 0.00067 mil)
for the specimens with
4 and 10 holes, respectively. As shown in table 11, table 12, and table 15, the
scatter for the conventional ECR specimens is quite high, as it is for a
number of other systems. As a result, the difference in corrosion between
ECR-4h-45 and ECR-10h-45 is not statistically significant. The difference is statistically significant between
ECR-10h-45 and ECR-10h-35. The negative corrosion exhibited between
weeks 12 and 36 for the ECR-4h-45 specimens is the result of measurements of
very low currents caused by low levels of oxidation on the exposed regions of
the four bottom bars before corrosion
initiates on the two top bars, resulting in current flow that makes the bottom bars appear to be anodes. Once chloride reaches the top bars, the nature of the
corrosion reverses, which occurs at about
week 30 based on the average corrosion loss versus time relationship shown in figure 50. The flat regions on the corrosion loss curves may be the result
of corrosion products temporarily blocking the small exposed areas on the bars.
m (0.00059 and 0.00067 mil)
for the specimens with
4 and 10 holes, respectively. As shown in table 11, table 12, and table 15, the
scatter for the conventional ECR specimens is quite high, as it is for a
number of other systems. As a result, the difference in corrosion between
ECR-4h-45 and ECR-10h-45 is not statistically significant. The difference is statistically significant between
ECR-10h-45 and ECR-10h-35. The negative corrosion exhibited between
weeks 12 and 36 for the ECR-4h-45 specimens is the result of measurements of
very low currents caused by low levels of oxidation on the exposed regions of
the four bottom bars before corrosion
initiates on the two top bars, resulting in current flow that makes the bottom bars appear to be anodes. Once chloride reaches the top bars, the nature of the
corrosion reverses, which occurs at about
week 30 based on the average corrosion loss versus time relationship shown in figure 50. The flat regions on the corrosion loss curves may be the result
of corrosion products temporarily blocking the small exposed areas on the bars.
The corrosion potentials for the top and bottom mats of steel are shown in figure 51 and figure 52, respectively. For the top mat, the average corrosion potential for the ECR-10h-35 bars remained more positive than -0.350 V with respect to a CSE throughout the test, indicating a low probability of corrosion. The corrosion potentials dropped below -0.350 V at weeks 26, 51, 49, and 52 for Conv.-45, Conv.-35, ECR-4h-45, and ECR-10h-45, respectively.
Figure 51. Graph. Southern exposure test, corrosion potential of top mat for conventional reinforcement and ECR.
Figure 52. Graph. Southern exposure test, corrosion potential of bottom mat for conventional reinforcement and ECR.
The corrosion potentials for the bottom mat of reinforcement remained more positive than -0.350 V with respect to a CSE throughout the test for Conv.-35 and ECR-10h-35. The potential dropped below -0.350 V at weeks 33, 50, and 56 for Conv.-45, ECR-4h-45 and ECR-10h-45, respectively, indicating that chlorides penetrated to the level of the bottom mat for those specimens.
The values of mat-to-mat resistance for the five systems are shown in figure 53, which illustrates a key difference between systems with coated and uncoated bars. The resistance between the top and bottom steel bars was similar for Conv.-45 and Conv.-35 throughout the 96-week test period, ranging from low values of 126 and 166 ohms, respectively, at week 1 to high values of 588 ohms at week 85 for Conv.-45 and 586 ohms at week 72 for Conv.-35, with values rising for about the first 60 weeks and then leveling off. The values for the epoxy-coated bars also rose early in the test, leveling off somewhat earlier-between 42 and 50 weeks. The major difference from the uncoated bars, however, is the much higher resistance provided by the epoxy coating, with initial readings of 2,099, 742, and 924 ohms for ECR-4h-45, ECR-10h-45, and ECR-10h 35, respectively. The respective high resistance values were 13,247 ohms at week 36, 6,710 ohms at week 51, and 5,989 ohms at week 82. As observed for the uncoated bars, w/c ratio had little effect on the mat-to-mat resistance and the number of openings in the coating had a major effect, with the bars with 4 holes in the coating exhibiting more than twice the mat-to-mat resistance as those with 10 holes. A high mat-to-mat resistance represents a high resistance to ionic current and represents a major advantage to coated reinforcement.
Figure 53. Graph. Southern exposure test, mat-to-mat resistance for conventional reinforcement and ECR.
Epoxies with Improved Adhesion
Comparisons of the corrosion
losses for conventional ECR-4h-45 and ECR-10h-45 and the corresponding
specimens of ECR(Chromate), ECR(DuPont), and ECR(Valspar) based on total and
exposed area are shown in figure 54 and figure 55, respectively. The figures
demonstrate that increased adhesion between the epoxy and reinforcing steel provides
no benefits under the exposure conditions provided by these tests. In fact, by
the end of tests, all of the bars with the higher adhesion epoxies exhibited greater
average corrosion losses on the exposed area than the conventional ECR
specimens. At 96 weeks, the average chloride contents of the specimens containing bars with the higher adhesion epoxies
ranged from 13.6 to 17.2 kg/m3 (22.9 to 29.0 lb/yd3) compared with about 7.5
kg/m3 (12.7 lb/yd3) for the specimens containing
conventional epoxy-coated steel with 4 holes through the epoxy and for the
specimens containing conventional epoxy-coated reinforcement with 10
holes through the coating. The variation in corrosion losses exhibited in both
figures, however, is likely due to variations in
the chloride content along the surface of the individual bars. As shown in table
11 and table 12, the variability in test results can often be explained by a
very high reading on a single specimen. This is true for ECR(Chromate)-4h-45,
ECR(Chromate)-10h-45, ECR(Valspar)-4h-45, and ECR(Valspar)-10h-45. As shown in figure
56, a plot of corrosion potential for the top mats, the systems exhibited
average corrosion potential below -0.350 V by 45 weeks with the exception
of conventional ECR (ECR-4h-45), which remained above this value until week 50.
Figure 54. Graph. Southern exposure test, corrosion losses based on total area for conventional ECR and increased-adhesion ECR.
Figure 55. Graph. Southern exposure test, corrosion losses based on area exposed at holes through coating for conventional ECR and increased-adhesion ECR.
Figure56. Graph. Southern exposure test, corrosion potential of top mat for conventional ECR and increased-adhesion ECR.
ECR Used in Conjunction with Corrosion Inhibitors
Corrosion losses based on exposed area for conventional ECR cast in concrete without a corrosion inhibitor and cast in concrete with calcium nitrite, Rheocrete® 222+, and Hycrete™ are shown in figure 57, figure 58, and figure 59 for bars with 4 holes in the epoxy and concrete with w/c of 0.45, bars with 10 holes through the epoxy in concrete with w/c of 0.45, and bars with 10 holes cast in concrete with w/c of 0.35, respectively. The figures also include the results for conventional ECR with a primer containing microencapsulated calcium nitrite.
Figure 57. Graph. Southern exposure test, corrosion losses based on area exposed at holes through coating for conventional ECR and ECR with inhibitors with bars containing four holes and concrete with w/c = 0.45.
Figure 58. Graph. Southern exposure test, corrosion losses based on area exposed at holes through coating for conventional ECR and ECR with inhibitors with bars containing 10 holes and concrete with w/c = 0.45.
Figure 59. Graph. Southern exposure test, corrosion losses based on area exposed at holes through coating for conventional ECR and ECR with inhibitors with bars containing 10 holes and concrete with w/c = 0.35.
Figure 57 through figure 59 and table 11 through table 15 show that corrosion inhibitors improve the corrosion performance of ECR in uncracked concrete. They also show that a lower w/c ratio, which results in a lower chloride level in the concrete due to reduced permeability, enhances the performance of the corrosion inhibitors. This observation is especially apparent for ECR(primer/Ca(NO2)2). The large differences observed in this case are likely due to the limited quantity of nitrite, which is available only from the exposed primer where the epoxy is penetrated. This limited quantity of nitrite is consumed in a shorter period of time in concrete with a w/c ratio of 0.45 than in concrete with a w/c of 0.35 due to the higher chloride concentration at the bar surface for the higher w/c ratio concrete. In contrast, the quantity of nitrite available was considerably higher for all ECR(DCI) specimens because the calcium nitrite was added to the concrete. Overall, specimens containing a corrosion inhibitor exhibited the same or less corrosion than exhibited by the conventional ECR specimens with the single exception of the ECR(primer/Ca(NO2)2)-10h-45 specimens.
The corrosion potentials exhibited by the top mats for the test specimens are shown in figure 60 through figure 62. The figures indicate that most of the specimens containing a corrosion inhibitor experienced corrosion potentials more negative than -0.350 V with respect to a CSE during the course of the test. The exceptions were ECR(HY)-4h-45, ER(HY)-10h-45, and ECR(primer/Ca(NO2)2)-10h-35.
Figure 60. Graph. Southern exposure test, corrosion potential of top mat for conventional ECR with and without corrosion inhibitor with bars containing four holes and concrete with w/c = 0.45.
Figure 61. Graph. Southern exposure test, corrosion potential of top mat for conventional ECR with and without corrosion inhibitor with bars containing 10 holes and concrete with w/c = 0.45.
Figure 62. Graph. Southern exposure test, corrosion potential of top mat for conventional ECR with and without corrosion inhibitor with bars containing 10 holes and concrete with w/c = 0.35.
Epoxy Coating with Improved Adhesion Cast in Concrete Containing Calcium Nitrite
A limited number of specimens (four holes in the epoxy with w/c of 0.45) were tested for each of the three epoxies with improved adhesion cast in concrete containing calcium nitrite. As observed in the other tests with concrete containing corrosion
inhibitors, the bars with improved adhesion exhibited improved corrosion resistance in the presence of calcium nitrite, as shown in figure 63, and exhibited improved corrosion performance compared to conventional ECR in concrete with calcium nitrite with the exception of ECR(Valspar) after 60 weeks. At the conclusion of the tests, losses based on the area exposed at the holes through the epoxy ranged from 0.28 ![]() m (0.011 mil) for ECR(DuPont)-DCI-4h-45 to 8.62
m (0.011 mil) for ECR(DuPont)-DCI-4h-45 to 8.62 ![]() m (0.339 mil) for
ECR(Valspar)-DCI-4h-45. The scatter in the
data shown in table 12 indicates that these values did not differ in a statistically
meaningful way from each other. The corrosion potentials for the top
mats in these tests are shown in figure 64. The average corrosion potential
dropped below -0.350 V by the end of the test in all cases with the exception
of ECR(Valspar)-DCI-4h-45, which exhibited the highest corrosion losses in
spite of its relatively more positive corrosion potential.
m (0.339 mil) for
ECR(Valspar)-DCI-4h-45. The scatter in the
data shown in table 12 indicates that these values did not differ in a statistically
meaningful way from each other. The corrosion potentials for the top
mats in these tests are shown in figure 64. The average corrosion potential
dropped below -0.350 V by the end of the test in all cases with the exception
of ECR(Valspar)-DCI-4h-45, which exhibited the highest corrosion losses in
spite of its relatively more positive corrosion potential.
1 ![]() m = 0.0394 mil
m = 0.0394 mil
Figure 63. Graph. Southern exposure test, average corrosion losses based on area exposed at holes through coating for conventional ECR and ECR with and without increased adhesion and corrosion inhibitor.
Figure 64. Graph. Southern exposure test, corrosion potential of top mat for conventional ECR with and without corrosion inhibitor and increased-adhesion ECR with corrosion inhibitor.
Bars with Multiple Coatings
The corrosion losses for
MC bars are compared with those for conventional ECR in figure 65 and figure 66 for bars with 4 and 10 holes, respectively. The specimens with MC bars
consistently exhibited greater corrosion losses than those with conventional
ECR. The MC bars with both layers penetrated exhibited average corrosion losses
on the exposed area of 27.7 ![]() m (1.09 mil) (for 4 holes) and
115
m (1.09 mil) (for 4 holes) and
115 ![]() m
(4.53 mil) (for 10 holes) at the conclusion of the tests compared to values of
7.4 and 3.2
m
(4.53 mil) (for 10 holes) at the conclusion of the tests compared to values of
7.4 and 3.2 ![]() m (0.29 and 0.13 mil) for conventional
ECR. The respective values with only the epoxy penetrated were 15.9 and 17.4
m (0.29 and 0.13 mil) for conventional
ECR. The respective values with only the epoxy penetrated were 15.9 and 17.4 ![]() m (0.626 and
0.685 mil), as shown in figure 65, figure 66, and table 12.
m (0.626 and
0.685 mil), as shown in figure 65, figure 66, and table 12.
Figure 65. Graph. Southern exposure test, corrosion loss based on area exposed at holes through coating for conventional ECR and MC reinforcement with bars containing four holes.
Figure 66. Graph. Southern exposure test, corrosion loss based on area exposed at holes through coating for conventional ECR and MC reinforcement with bars containing 10 holes.
The average corrosion potentials for the top and bottom mat are shown in figure 67 and figure 68 for bars with 4 holes and in figure 69 and figure 70 for bars with 10 holes through the epoxy. The top mat corrosion potentials were similar for the cases in which both layers were penetrated and in which only the epoxy was penetrated, differing most widely during the first 10-20 weeks of the tests. For the top mats, the values were more negative than those for conventional ECR until the final 24 weeks of the tests for bars with 4 holes and the final 36 weeks for bars with 10 holes through the epoxy coating. The values for the MC bars ranged between -0.200 and -0.500 V between the beginning of the tests and week 10, stabilizing between -0.500 and -0.600 V after week 20. The autopsy results (described later) show that both the zinc coating and the underlying conventional reinforcement participated in corrosion by the end of the tests.
Figure 67. Graph. Southern exposure test, corrosion potential of top mat for conventional ECR and MC reinforcement with bars containing four holes.
Figure 68. Graph. Southern exposure test, corrosion potential of bottom mat for conventional ECR and MC reinforcement with bars containing four holes.
Figure 69. Graph. Southern exposure test, corrosion potential of top mat for conventional ECR and MC reinforcement with bars containing 10 holes.
Figure 70. Graph. Southern exposure test, corrosion potential of bottom mat for conventional ECR and MC reinforcement with bars containing 10 holes.
Conventional Steel with Corrosion Inhibitors
Although the corrosion inhibitors used in this study have been evaluated previously, it became clear as the study proceeded that the high level of corrosion protection provided by even damaged epoxy coatings made it difficult to distinguish between the performance of the three inhibitors.(51-56) With that in mind, the inhibitors were evaluated using southern exposure, cracked beam, and corrosion initiation tests containing uncoated conventional reinforcement to gain an improved understanding of their performance using the same test procedures as used to evaluate the multiple corrosion-protection systems in the this study. The properties of the concrete and the results of the southern exposure and corrosion initiation tests are reported here, and the results of the cracked beam tests are reported with the results of the other cracked beam tests.
The properties of the concrete in the corrosion initiation beam specimens are summarized in table 16. The somewhat lower strength exhibited by the concrete containing Rheocrete® 222+, 30.4 MPa (4,410 psi), and the greatly reduced strength of the concrete containing Hycrete™, 14.2 MPa (2,060 psi), compared to the strengths of concrete without a corrosion inhibitor and concrete containing calcium nitrite, 35.8 and 40.0 MPa (5,190 and 5,810 psi), respectively, were also observed in the field test specimens (see table 7).
Table 16. Concrete properties for southern exposure and cracked beam specimens with uncoated bars and corrosion inhibitor in the concrete.
| Specimen Designation | Slump, mm | Air Content, percent | Compressive Strengtha, MPa | Standard Deviation, MPa | Coefficient of Variation |
|---|---|---|---|---|---|
Conv.2 |
55 |
5.25 |
35.8 |
2.35 |
0.07 |
Conv.2(DCI) |
95 |
5 |
40.0 |
3.65 |
0.09 |
Conv.2(RH) |
50 |
4 |
30.4 |
4.45 |
0.15 |
Conv.2(HY) |
90 |
5.25 |
14.2 |
1.93 |
0.14 |
1 mm = 0.039 inches
1 MPa = 145 psi
a Average of eight cylinders cured in saturated limewater.
The southern exposure tests were performed using the second
heat of conventional steel cast in concrete
with a w/c ratio of 0.45. Figure 71 compares the corrosion rates of the
specimens without a corrosion
inhibitor with those with concrete containing Rheocrete® 222+,
calcium nitrite,
and Hycrete™, designated as specimens Conv.2-45, Conv.2(RH)-45, Conv.2(DCI)-45,
and Conv.2(HY)-45, respectively. The specimens without a corrosion
inhibitor exhibited the earliest corrosion initiation and highest corrosion
rate, which ranged between 8 and 15 ![]() m/year (0.3 and 0.59 mil/year)
from week 26 through the end of the test; the only exception occurred at week 34, where
the Conv.2(DCI)-45 specimens exhibited a higher corrosion rate. The
Conv.2(DCI)-45 specimens exhibited corrosion rates between 3.5 and 9.5
m/year (0.3 and 0.59 mil/year)
from week 26 through the end of the test; the only exception occurred at week 34, where
the Conv.2(DCI)-45 specimens exhibited a higher corrosion rate. The
Conv.2(DCI)-45 specimens exhibited corrosion rates between 3.5 and 9.5 ![]() m/year (0.14
and 0.37 mil/year) after week 33, while
the Conv.2(RH)-45 and Conv.2(HY)-45 specimens exhibited respective corrosion rates
of 2 to 4 and 0.5 to 2
m/year (0.14
and 0.37 mil/year) after week 33, while
the Conv.2(RH)-45 and Conv.2(HY)-45 specimens exhibited respective corrosion rates
of 2 to 4 and 0.5 to 2 ![]() m/year (0.08-0.2 and 0.02-0.08 mil/year)
between week 33 and the conclusion of the
test. The corrosion losses for the specimens are shown in figure 72. At 96
weeks, losses of 14.4, 8.4, 3.4, and 1.4
m/year (0.08-0.2 and 0.02-0.08 mil/year)
between week 33 and the conclusion of the
test. The corrosion losses for the specimens are shown in figure 72. At 96
weeks, losses of 14.4, 8.4, 3.4, and 1.4 ![]() m (0.567, 0.33, 0.13, and
0.055 mil) were observed for the Conv.2-45, Conv.2(RH)-45, Conv.2(DCI)-45, and
Conv.2(HY)-45 specimens, respectively.
m (0.567, 0.33, 0.13, and
0.055 mil) were observed for the Conv.2-45, Conv.2(RH)-45, Conv.2(DCI)-45, and
Conv.2(HY)-45 specimens, respectively.
Figure 71. Graph. Southern exposure test, average corrosion rates based on total area for conventional reinforcement in specimens without and with corrosion inhibitors.
1 ![]() m = 0.0394 mil
m = 0.0394 mil
Figure 72. Graph. Southern exposure test, average corrosion losses based on total area for conventional reinforcement in specimens without and with corrosion inhibitors.
The average corrosion potentials of the top bars with respect to CSE are shown in figure 73. The initially rising corrosion potentials of the top bars for all four systems indicate increasing passivity through week 14, at which point the specimens without a corrosion inhibitor and those containing calcium nitrite began to exhibit progressively more negative potentials, dropping below a value of -0.350 V at week 24. The Conv.2(RH)-45 and Conv.2(HY)-45 specimens continued to exhibit increasing passivity until weeks 23 and 26, respectively. The specimens with Rheocrete® and Hycrete™ in the concrete exhibited a negative spike in corrosion potential at week 34, which may be an aberration in the data. The specimens containing Rheocrete® dropped below a corrosion potential of -0.350 V at week 48 and remained there for the balance of the tests. Specimens containing Hycrete™ dropped below a corrosion potential of -0.350 V in week 48, exhibiting corrosion potentials between -0.299 and -0.388 V for the balance of test.
Figure 73. Graph. Southern exposure test, corrosion potential of top mat for conventional reinforcement in specimens without and with corrosion inhibitors.
The resistance between the top and bottom mats of steel, or mat-to-mat resistance, was measured on a weekly basis for all test specimens in this study. For most specimens, mat-to-mat resistance is not included in this report but is presented by Draper et al.(49) It is presented for this group of specimens because it represents a measure of the ion conductivity of the concrete and provides insight into how the inhibitors function.
The mat-to-mat resistance for the southern exposure specimens is presented in figure 74. It is noteworthy that the value of the resistance is nearly identical for the Conv.2-45, Conv.2(RH)-45, and Conv.2(DCI)-45 specimens throughout the test period, beginning at approximately 100 ohms, increasing through week 84 to a peak of approximately 600 ohms (860 ohms for the DCI specimens), and then dropping toward values between 300 and 600 ohms by week 96. In contrast, the specimens containing Hycrete™ exhibited progressively higher resistance throughout the test period, reaching a maximum value of 2,700 ohms at week 90, with values in excess of 1,175 ohms between weeks 78 and 96. The increase in resistivity from the reduction in concrete permeability provided by Hycrete™ played a key role in minimizing the macrocell corrosion measured in this test.
Figure 74. Graph. Southern exposure test, mat-to-mat resistance for conventional reinforcement in specimens without and with corrosion inhibitors.
Corrosion initiation tests are used to obtain a measure of the critical chloride corrosion threshold for corrosion-protection systems. The results of the tests for bare bars cast in concrete containing corrosion inhibitors are summarized in table 17. The initial tests were performed with the first heat of conventional steel (Conv.) in specimens containing Rheocrete®, DCI® s, and Hycrete™. Over the course of those tests, the values for the critical chloride threshold for the specimens containing Hycrete™ were observed to be exceptionally low, averaging 0.43 kg/m3 (0.72 lb/yd3), a value below that observed for conventional steel, which typically ranged from 0.60 to 1.20 kg/m3 (1 to 2 lb/yd3). To follow up, a second series of specimens was evaluated using Conv.2 steel cast in concrete without and with Hycrete™. The critical chloride corrosion threshold observed in the second series for Hycrete™ (Conv.2(HY)), 0.51 kg/m3 (0.86 lb/yd3), closely matches the value in the initial series. In addition to corrosion thresholds, table 17 shows the individual and average values of time to initiation and the corrosion rate and corrosion potential during the week in which corrosion was initially observed, along with the standard deviations for corrosion threshold. The values of standard deviation and coefficient of variation for each specimen represent the variation observed for individual samples within the specimen. The values of standard deviation and coefficient of variation for each group of specimens were calculated based on the individual specimen averages. This is why the coefficient of variation is consistently greater for the individual samples than for each group of samples.
Table 17. Corrosion initiation results for bare bars in concrete without and with corrosion inhibitors (values at time of initiation).
| Specimena | Time to Initiation, weeks |
Rate, |
Potentiala, V |
Averageb, kg/m3 |
Standard Deviation, kg/m3 |
|---|---|---|---|---|---|
Conv.2-1 |
16 |
1.50 |
-0.383 |
1.23 |
1.09 |
Conv.2-2 |
16 |
0.404 |
-0.339 |
0.88 |
0.67 |
Conv.2-3 |
28 |
0.922 |
-0.300 |
0.42 |
0.80 |
Conv.2-4 |
16 |
0.869 |
-0.309 |
1.45 |
1.44 |
Conv.2-5 |
- |
- |
- |
- |
- |
Conv.2-6 |
23 |
0.389 |
-0.229 |
0.54 |
0.41 |
Average |
19.8 |
0.90 |
0.44 |
||
Conv.(DCI)-1 |
43 |
0.945 |
-0.337 |
2.05 |
0.56 |
Conv.(DCI)-2 |
31 |
0.297 |
-0.293 |
1.59 |
0.40 |
Conv.(DCI)-3 |
20 |
1.166 |
-0.344 |
1.39 |
0.65 |
Conv.(DCI)-4 |
23 |
0.815 |
-0.331 |
1.63 |
0.33 |
Conv.(DCI)-5 |
25 |
0.511 |
-0.362 |
2.10 |
0.66 |
Conv.(DCI)-6 |
17 |
1.684 |
-0.376 |
1.19 |
0.38 |
Average |
26.5 |
1.66 |
0.36 |
||
Conv.(RH)-1 |
16 |
0.320 |
-0.301 |
1.27 |
0.65 |
Conv.(RH)-2 |
14 |
2.614 |
-0.421 |
0.57 |
0.39 |
Conv.(RH)-3 |
20 |
0.853 |
-0.357 |
0.94 |
0.41 |
Conv.(RH)-4 |
21 |
0.800 |
-0.397 |
1.23 |
0.54 |
Conv.(RH)-5 |
26 |
0.953 |
-0.404 |
2.13 |
1.04 |
Conv.(RH)-6 |
20 |
0.979 |
-0.457 |
1.77 |
0.79 |
Average |
19.5 |
1.32 |
0.56 |
||
Conv.(HY)-1 |
16 |
0.549 |
-0.320 |
0.33 |
0.26 |
Conv.(HY)-2 |
26 |
1.349 |
-0.391 |
0.24 |
0.08 |
Conv.(HY)-3 |
48 |
0.343 |
-0.314 |
0.54 |
0.74 |
Conv.(HY)-4 |
12 |
0.549 |
-0.348 |
0.41 |
0.30 |
Conv.(HY)-5 |
52 |
1.158 |
-0.344 |
0.71 |
0.50 |
Conv.(HY)-6 |
17 |
0.457 |
-0.299 |
0.37 |
0.32 |
Average |
28.5 |
0.43 |
0.17 |
||
Conv.2(HY)-1 |
58 |
0.137 |
-0.218 |
0.67 |
0.43 |
Conv.2(HY)-2 |
- |
- |
- |
- |
- |
Conv.2(HY)-3 |
68 |
0.899 |
-0.21 |
0.47 |
0.35 |
Conv.2(HY)-4 |
24 |
0.823 |
-0.294 |
0.34 |
0.25 |
Conv.2(HY)-5 |
42 |
2.87 |
-0.222 |
0.25 |
0.21 |
Conv.2(HY)-6 |
50 |
3.76 |
-0.362 |
0.69 |
0.33 |
Average |
48.4 |
0.51 |
0.31 |
1 ![]() m = 0.0394 mil
m = 0.0394 mil
1 kg/m3 =1.69 lb/yd3
- Initiation was missed.
a With respect to an SCE.
b Individual specimen averages and standard deviations based on 20
samples per specimen. Overall averages and standard deviations based on
specimen averages.
The specimens containing Hycrete™ exhibited the longest time to initiation, 28.5 and 48.4 weeks for the Conv.(HY) and Conv.2(HY) specimens, respectively, followed by the Conv.(DCI), Conv.(RH), and Conv.2 specimens at 26.5, 19.5, and 19.8 weeks, respectively. The conventional steel specimens exhibited an average critical chloride corrosion threshold of 0.90 kg/m3 (1.52 lb/yd3), matching earlier results at the University of Kansas using similar specimens but different heats of conventional steel.(50) The specimens containing Rheocrete®and DCI® S exhibited critical corrosion thresholds of 1.32 and 1.66 kg/m3 (2.22 and 2.80 lb/yd3), respectively.
To explain the very low corrosion threshold for the conventional steel in concrete containing Hycrete™, O'Reilly et al. used a pore press to extract pore solution from cement paste specimens without inhibitors and with each of the inhibitors used in this study.(44) As described in chapter 2, they observed a marked increase in sulfate content at both 1 and 7 days for cement pastes containing Hycrete™ and at 7 days for pastes containing Rheocrete®. Along with chlorides, sulfates can reduce the passivity of reinforcing steel and may explain the very low critical chloride corrosion threshold for Hycrete™ and the observation that Rheocrete® produces a corrosion threshold below that provided by calcium nitrite.(57)
The performance of the corrosion-protection systems in the cracked beam tests is presented in this section. The losses at 96 weeks based on total and exposed area on the ECR bars are summarized in table 18 and table 19. The average corrosion rates after corrosion initiation are summarized in table 20. Unlike the corrosion rates for the southern exposure specimens shown in table 15, corrosion was observed for all but one specimen, specimen 1 for ECR(HY)-45 with 10 holes through the epoxy.
Table 18.
Corrosion loss at 96 weeks (![]() m) for cracked beam specimens
based on total area.
m) for cracked beam specimens
based on total area.
| Steel Designationa | Specimen | Average | Standard Deviation | |||||
|---|---|---|---|---|---|---|---|---|
| 1 | 2 | 3 | 4 | 5 | 6 | |||
Controls |
||||||||
Conv.-45 |
17.56 |
8.53 |
7.29 |
15.40 |
15.16 |
14.46 |
13.06 |
4.15 |
Conv.2-45 |
44.39 |
22.74 |
22.62 |
29.92 |
12.54 |
|||
Conv.-35 |
11.48 |
6.02 |
7.51 |
8.34 |
2.82 |
|||
ECR-4h-45 |
0.04 |
0.07 |
0.02 |
0.07 |
0.04 |
0.01 |
0.04 |
0.02 |
ECR-10h-45 |
0.026 |
0.083 |
0.032 |
0.047 |
0.031 |
|||
ECR-10h-35 |
0.132 |
0.124 |
0.162 |
0.139 |
0.020 |
|||
Epoxies with increased adhesion |
||||||||
ECR(Chromate)-4h-45 |
0.066 |
0.058 |
0.099 |
0.074 |
0.022 |
|||
ECR(Chromate)-10h-45 |
0.026 |
0.140 |
0.480 |
0.216 |
0.236 |
|||
ECR(DuPont)-4h-45 |
0.124 |
0.137 |
0.054 |
0.105 |
0.045 |
|||
ECR(DuPont)-10h-45 |
0.128 |
0.127 |
0.297 |
0.184 |
0.098 |
|||
ECR(Valspar)-4h-45 |
0.172 |
0.071 |
0.009 |
0.084 |
0.082 |
|||
ECR(Valspar)-10h-45 |
0.081 |
0.039 |
0.254 |
0.125 |
0.114 |
|||
Corrosion inhibitors in concrete |
||||||||
Conv.2(DCI)-45 |
32.09 |
26.39 |
21.56 |
26.68 |
5.273 |
|||
Conv.2(RH)-45 |
24.58 |
18.26 |
22.63 |
21.82 |
3.236 |
|||
Conv.2(HY)-45 |
8.635 |
6.314 |
7.845 |
7.60 |
1.180 |
|||
ECR(DCI)-4h-45 |
0.025 |
0.048 |
0.007 |
0.026 |
0.021 |
|||
ECR(DCI)-10h-45 |
0.044 |
0.155 |
0.039 |
0.079 |
0.065 |
|||
ECR(DCI)-10h-35 |
0.124 |
0.095 |
0.449 |
0.223 |
0.197 |
|||
ECR(RH)-4h-45 |
0.062 |
0.314 |
0.047 |
0.141 |
0.150 |
|||
ECR(RH)-10h-45 |
0.240 |
0.134 |
0.138 |
0.171 |
0.060 |
|||
ECR(RH)-10h-35 |
0.096 |
0.302 |
0.136 |
0.178 |
0.109 |
|||
ECR(HY)-4h-45 |
0.010 |
0.005 |
0.092 |
0.036 |
0.049 |
|||
ECR(HY)-10h-45 |
0.002 |
0.116 |
0.062 |
0.060 |
0.057 |
|||
ECR(HY)-10h-35 |
0.144 |
0.159 |
0.278 |
0.194 |
0.073 |
|||
ECR(primer/Ca(NO2)2)-4h-45 |
0.016 |
0.008 |
0.028 |
0.017 |
0.010 |
|||
ECR(primer/Ca(NO2)2)-10h-45 |
0.152 |
0.059 |
0.084 |
0.098 |
0.048 |
|||
ECR(primer/Ca(NO2)2)-10h-35 |
0.416 |
0.315 |
0.589 |
0.440 |
0.139 |
|||
Bars with multiple coatings |
||||||||
MC(both layers penetrated)-4h-45 |
0.489 |
0.262 |
0.379 |
0.377 |
0.114 |
|||
MC(both layers penetrated)-10h-45 |
0.214 |
1.269 |
0.532 |
0.672 |
0.541 |
|||
MC(only epoxy penetrated)-4h-45 |
0.141 |
0.161 |
0.581 |
0.294 |
0.248 |
|||
MC(only epoxy penetrated)-10h-45 |
0.159 |
0.106 |
0.398 |
0.221 |
0.156 |
|||
1 ![]() m = 0.0394 mil
m = 0.0394 mil
Blank cells indicate no specimen tested.
a See table 1 for abbreviation definitions. 4h = bar with four holes
through epoxy, 10h = bar with 10 holes through epoxy. 35 = concrete with w/c = 0.35,
45 = concrete with w/c = 0.45.
Table 19. Corrosion loss at 96 weeks (![]() m) for cracked beam
specimens based on area exposed at holes through coating.
m) for cracked beam
specimens based on area exposed at holes through coating.
| Steel Designationas | Specimen | Average | Standard Deviation | |||||
|---|---|---|---|---|---|---|---|---|
| 1 | 2 | 3 | 4 | 5 | 6 | |||
Controls |
||||||||
ECR-4h-45 |
17.0 |
34.1 |
8.0 |
33.1 |
20.3 |
7.0 |
19.9 |
11.8 |
ECR-10h-45 |
5.0 |
16.0 |
6.1 |
9.0 |
6.0 |
|||
ECR-10h-35 |
25.3 |
23.8 |
31.1 |
26.7 |
3.8 |
|||
Epoxies with increased adhesion |
||||||||
ECR(Chromate)-4h-45 |
31.5 |
28.0 |
47.5 |
35.7 |
10.4 |
|||
ECR(Chromate)-10h-45 |
5.0 |
26.9 |
92.3 |
41.4 |
45.4 |
|||
ECR(DuPont)-4h-45 |
59.4 |
66.0 |
26.0 |
50.4 |
21.4 |
|||
ECR(DuPont)-10h-45 |
24.6 |
24.4 |
57.0 |
35.3 |
18.8 |
|||
ECR(Valspar)-4h-45 |
82.6 |
34.2 |
4.3 |
40.4 |
39.5 |
|||
ECR(Valspar)-10h-45 |
15.6 |
7.5 |
48.8 |
24.0 |
21.9 |
|||
Corrosion inhibitors in concrete |
||||||||
ECR(DCI)-4h-45 |
12.1 |
22.9 |
3.2 |
12.7 |
9.9 |
|||
ECR(DCI)-10h-45 |
8.4 |
29.8 |
7.6 |
15.3 |
12.6 |
|||
ECR(DCI)-10h-35 |
23.8 |
18.2 |
86.3 |
42.8 |
37.8 |
|||
ECR(RH)-4h-45 |
29.6 |
150.6 |
22.5 |
67.6 |
72.0 |
|||
ECR(RH)-10h-45 |
46.1 |
25.7 |
26.6 |
32.8 |
11.6 |
|||
ECR(RH)-10h-35 |
18.5 |
58.0 |
26.2 |
34.3 |
20.9 |
|||
ECR(HY)-4h-45 |
4.8 |
2.4 |
44.0 |
17.1 |
23.4 |
|||
ECR(HY)-10h-45 |
0.3 |
22.4 |
12.0 |
11.6 |
11.0 |
|||
ECR(HY)-10h-35 |
27.7 |
30.6 |
53.4 |
37.2 |
14.1 |
|||
ECR(primer/Ca(NO2)2)-4h-45 |
7.8 |
3.8 |
13.2 |
8.3 |
4.7 |
|||
ECR(primer/Ca(NO2)2)-10h-45 |
29.2 |
11.4 |
16.1 |
18.9 |
9.2 |
|||
ECR(primer/Ca(NO2)2)-10h-35 |
79.9 |
60.5 |
113.2 |
84.5 |
26.6 |
|||
Bars with multiple coatings |
||||||||
MC(both layers penetrated)-4h-45 |
234.9 |
125.8 |
182.1 |
181.0 |
54.6 |
|||
MC(both layers penetrated)-10h-45 |
41.1 |
243.7 |
102.1 |
129.0 |
104.0 |
|||
MC(only epoxy penetrated)-4h-45 |
64.9 |
76.0 |
278.8 |
139.9 |
120.4 |
|||
MC(only epoxy penetrated)-10h-45 |
30.5 |
20.7 |
76.4 |
42.5 |
29.7 |
|||
1 ![]() m = 0.0394 mil
m = 0.0394 mil
Blank cells indicate no specimen tested.
a See table 1 for abbreviation definitions. 4h = bar with four holes
through epoxy, 10h = bar with 10 holes through epoxy. 35 = concrete with w/c =
0.35, 45 = concrete with w/c = 0.45.
Table 20. Average corrosion rate (![]() m/year)
based on losses after corrosion initiation for cracked beam specimens.
m/year)
based on losses after corrosion initiation for cracked beam specimens.
| Bars Without Coatings-Corrosion Rate Based on Total Area | ||||||||
|---|---|---|---|---|---|---|---|---|
| Steel Designationa | Specimen | Average | Standard Deviation | |||||
| 1 | 2 | 3 | 4 | 5 | 6 | |||
Controls |
||||||||
Conv.-45 |
9.42 |
4.50 |
3.82 |
8.32 |
8.18 |
7.74 |
7.00 |
2.27 |
Conv.2-45 |
24.6 |
12.2 |
12.1 |
16.3 |
7.16 |
|||
Conv.-35 |
7.72 |
5.05 |
6.34 |
6.37 |
1.34 |
|||
Corrosion inhibitors in concrete |
||||||||
Conv.2(DCI)-45 |
17.5 |
14.4 |
11.6 |
14.5 |
2.96 |
|||
Conv.2(RH)-45 |
13.6 |
9.80 |
12.4 |
11.9 |
1.96 |
|||
Conv.2(HY)-45 |
4.91 |
3.44 |
4.16 |
4.17 |
0.74 |
|||
Bars With Coatings-Corrosion Rate Based on Exposed Area |
||||||||
Steel Designation |
4 holes |
10 holes |
Average |
Standard Deviation |
||||
1 |
2 |
3 |
1 |
2 |
3 |
|||
Controls |
||||||||
ECR-45 |
8.57 |
18.3 |
2.63 |
2.29 |
9.20 |
3.69 |
8.07 |
5.86 |
13.8c |
12.2c |
1.99c |
||||||
ECR-35 |
11.8 |
12.4 |
16.9 |
13.7 |
2.79 |
|||
Epoxies with increased adhesion |
||||||||
ECR(Chromate)-45 |
14.1 |
11.9 |
29.1 |
2.37 |
14.3 |
50.4 |
20.4 |
17.0 |
ECR(DuPont)-45 |
33.5 |
48.5 |
14.5 |
13.2 |
14.7 |
31.1 |
25.9 |
14.2 |
ECR(Valspar)-45 |
41.1 |
16.9 |
0.770 |
8.28 |
4.62 |
26.6 |
16.4 |
15.3 |
Corrosion inhibitors in concrete |
||||||||
ECR(DCI)-45 |
6.19 |
18.9 |
16.6 |
4.58 |
16.7 |
4.10 |
11.2 |
6.90 |
ECR(DCI)-35 |
13.1 |
27.6 |
47.2 |
29.3 |
17.1 |
|||
ECR(RH)-45 |
12.7 |
15.3 |
17.8 |
27.1 |
14.2 |
15.1 |
17.0 |
5.21 |
ECR(RH)-35 |
10.1 |
31.7 |
14.3 |
18.7 |
11.45 |
|||
ECR(HY)-45 |
1.87 |
6.98 |
25.5 |
b |
13.3 |
6.37 |
10.8 |
9.18 |
ECR(HY)-35 |
15.1 |
17.7 |
30.9 |
21.2 |
8.47 |
|||
ECR(primer/Ca(NO2)2)-45 |
2.38 |
13.5 |
5.74 |
15.6 |
6.02 |
9.19 |
8.73 |
5.03 |
ECR(primer/Ca(NO2)2)-35 |
43.6 |
32.9 |
61.6 |
46.0 |
14.5 |
|||
Bars with multiple coatings |
||||||||
MC |
36.8d |
44.7d |
169d |
16.2d |
10.5d |
39.7d |
68.6 |
51.9 |
129e |
68.7e |
98.7e |
21.8e |
132e |
55.5e |
|||
1 ![]() m = 0.0394 mil
m = 0.0394 mil
Blank cells indicate no specimen tested.
a See table 1 for abbreviation definitions. 35 = concrete with w/c =
0.35, 45 = concrete with w/c = 0.45.
b No corrosion observed.
c Specimens 4, 5, and 6.
d Both layers penetrated.
e Only epoxy penetrated.
Control Specimens
The average corrosion rates and corrosion losses based on the
total area of the reinforcing bars are shown
in figure 75 and figure 76,
respectively, for cracked beam specimens with conventional reinforcing steel
and conventional ECR steel. The specimens with ECR have 4 or 10 holes through the epoxy for the concrete with a w/c ratio of 0.45 and 10 holes through the
epoxy for concrete with a w/c ratio of 0.35. Because the simulated crack
provides direct access to the top reinforcing bars
for the 15 percent sodium chloride solution, significant corrosion rates, on
the order of 10 ![]() m/year (0.4 mil/year), were observed
early in the test for specimens containing conventional steel at both w/c ratios.
Throughout the test period, the lower w/c ratio appears to have provided some protection, likely the result of lower
concrete permeability, which reduces access of oxygen and moisture to
the cathode. At both w/c ratios, however, the corrosion rate is significant,
with average rates on the order of 6 to 9
m/year (0.4 mil/year), were observed
early in the test for specimens containing conventional steel at both w/c ratios.
Throughout the test period, the lower w/c ratio appears to have provided some protection, likely the result of lower
concrete permeability, which reduces access of oxygen and moisture to
the cathode. At both w/c ratios, however, the corrosion rate is significant,
with average rates on the order of 6 to 9 ![]() m/year (0.2 to 0.4 mil/year)
for specimens with w/c of 0.45 and 2 to 8
m/year (0.2 to 0.4 mil/year)
for specimens with w/c of 0.45 and 2 to 8 ![]() m/year (0.08 to 0.3 mil/year) after
week 10 for specimens with w/c of 0.35. The corrosion rates decreased from the
high initial values as a result of the accumulation of corrosion products
within the crack. The average macrocell corrosion rates shown in table 20 are
7.00 and 6.37
m/year (0.08 to 0.3 mil/year) after
week 10 for specimens with w/c of 0.35. The corrosion rates decreased from the
high initial values as a result of the accumulation of corrosion products
within the crack. The average macrocell corrosion rates shown in table 20 are
7.00 and 6.37 ![]() m/year (0.276 and 0.251
mil/year) for the Conv.-45 and Conv.-35 specimens, respectively.
m/year (0.276 and 0.251
mil/year) for the Conv.-45 and Conv.-35 specimens, respectively.
Figure 75. Graph. Cracked beam test, average corrosion rates based on total area of control specimens for conventional reinforcement and ECR.
Figure 76. Graph. Cracked beam test, average corrosion loss based on total area of control specimens for conventional reinforcement and ECR.
Occasionally, individual specimens exhibited large increases
in corrosion rate. This increase was due to the accumulated corrosion products
exerting enough stress on the concrete to widen the crack, again providing direct access of the sodium chloride solution to
the top reinforcing bar. Corrosion rates increased somewhat during the
last 12 weeks of the tests for specimens with both w/c ratios. Figure 76 and table 18 show that the
average corrosion losses were 13.1 and 8.3 ![]() m (0.516 and 0.33 mil) at
the end of the 96-week test. These values are below the nominal value of 25
m (0.516 and 0.33 mil) at
the end of the 96-week test. These values are below the nominal value of 25 ![]() m (0.98 mil)
required to crack concrete. However, by the end of the test, a number of
specimens produced a high enough quantity of corrosion products to cause severe
cracking, as shown in figure 77, which also allowed the sodium chloride solution
to reach the lower bars. The observed cracking was likely due to nonuniformity
in deposition of the corrosion products, which is evident in the section
describing the autopsy of the bench-scale specimens. Overall, figure 75, figure 76, and table 20 indicate
a small advantage for a lower w/c ratio for cracked concrete and a significant
reduction in corrosion loss provided by epoxy coating.
m (0.98 mil)
required to crack concrete. However, by the end of the test, a number of
specimens produced a high enough quantity of corrosion products to cause severe
cracking, as shown in figure 77, which also allowed the sodium chloride solution
to reach the lower bars. The observed cracking was likely due to nonuniformity
in deposition of the corrosion products, which is evident in the section
describing the autopsy of the bench-scale specimens. Overall, figure 75, figure 76, and table 20 indicate
a small advantage for a lower w/c ratio for cracked concrete and a significant
reduction in corrosion loss provided by epoxy coating.
Figure 77. Photo. Cracked beam specimen containing conventional reinforcing steel at end of 96-week test.
Corrosion losses as a function of exposed area are plotted versus time for the ECR specimens in figure 78. The bars with 10 holes through the epoxy cast in concrete with w/c of 0.35 (ECR-10h-35) exhibited two to three times the losses of the same bars cast in concrete with w/c of 0.45 (ECR-10h-45). The bars with four holes through the epoxy in concrete with w/c of 0.45 (ECR-4h-45) exhibited corrosion losses between those for the two other specimen types. The results represent the average of six specimens for ECR-4h-45 and three specimens for the others. For the epoxy-coated bars, there does not appear to be an advantage based on a reduced w/c ratio. The corrosion losses for the ECR bars based on exposed area are 1 to 4 times the average values observed for the uncoated conventional bars.
Figure 78. Graph. Cracked beam test, average corrosion loss based on area exposed at holes through coating for ECR.
Epoxies with Improved Adhesion
The total corrosion losses based on exposed area for the bars
coated with the improved adhesion epoxies are compared with losses for
conventional ECR in figure 79 and figure 80 for bars with 4 and 10 holes,
respectively. As observed in the southern exposure tests, these results
indicate that the improved adhesion epoxies provided no advantage with respect
to conventional ECR under severe exposure conditions. In fact, the corrosion
losses for bars with improved adhesion epoxies were at least 1.7 times those
for bars with conventional epoxy for both 4 holes (35.4 to 50.4 ![]() m (1.39 to
1.98 mil) versus 19.9
m (1.39 to
1.98 mil) versus 19.9 ![]() m (0.783 mil)) and 10 holes
(24.0 to 41.4
m (0.783 mil)) and 10 holes
(24.0 to 41.4 ![]() m (0.945 to 1.63 mil) versus 9
m (0.945 to 1.63 mil) versus 9 ![]() m
(0.4 mil)).
m
(0.4 mil)).
1 ![]() m = 0.0394 mil
m = 0.0394 mil
Figure 79. Graph. Cracked beam test, average corrosion loss based on area exposed at holes through coating for conventional ECR and increased-adhesion ECR with bars containing four holes.
Figure 80. Graph. Cracked beam test, average corrosion loss based on area exposed at holes through coating for conventional ECR and increased-adhesion ECR with bars containing 10 holes.
ECR Used in Conjunction with Corrosion Inhibitors
Corrosion losses for cracked beam specimens with conventional ECR cast in concrete with corrosion inhibitors or for ECR bars with primer containing microencapsulated calcium nitrate are shown in figure 81 and figure 82 for specimens with 4 and 10 holes through the epoxy on bars cast in concrete with w/c of 0.45 and in figure 83 for with 10 holes through the epoxy cast in concrete with w/c of 0.35. Unlike the results for intact concrete in the southern exposure test, the presence of a corrosion inhibitor did not provide an advantage in severely cracked concrete as represented by the cracked beam specimen, where chlorides have direct access to the reinforcing steel. Except for ECR (DCI)-4h-45 and ECR (primer/Ca(NO2)2)-4h-45, the corrosion losses are the same or greater for the specimens with a corrosion inhibitor in the concrete or in a primer below the coating than for the conventional ECR specimens.
1 ![]() m = 0.0394 mil
m = 0.0394 mil
Figure 81. Graph. Cracked beam test, average corrosion loss based on area exposed at holes through coating for conventional ECR with and without corrosion inhibitors with bars containing four holes and concrete with w/c = 0.45.
Figure 82. Graph. Cracked beam test, average corrosion loss based on area exposed at holes through coating for conventional ECR with and without corrosion inhibitors with bars containing 10 holes and concrete with w/c = 0.45.
Figure 83. Graph. Cracked beam test, average corrosion loss based on area exposed at holes through coating for conventional ECR with and without corrosion inhibitors with bars containing 10 holes and concrete with w/c = 0.35.
Bars with Multiple Coatings
The corrosion losses for
the bars with multiple coatings are compared with those for conventional ECR in figure 84 and figure 85 for bars with 4 and 10 holes through
the coatings, respectively. Both figures show that the highest corrosion losses
were attained by the MC bars with both layers
penetrated followed by those with only the epoxy layer penetrated and then by
conventional ECR. For the specimens with four holes in the epoxy
coating, the respective average losses based on exposed area were 181, 140, and
20 ![]() m
(7.13, 5.51, and 0.79 mil) at the conclusion of tests. For the specimens with
10 holes, the respective values were 129, 43, and 9
m
(7.13, 5.51, and 0.79 mil) at the conclusion of tests. For the specimens with
10 holes, the respective values were 129, 43, and 9 ![]() m (5.08, 1.7, and
0.4 mil) at the conclusion of tests. Corrosion losses less than 50
m (5.08, 1.7, and
0.4 mil) at the conclusion of tests. Corrosion losses less than 50 ![]() m (2 mil),
the thickness of the zinc coating, exhibited by the MC(only epoxy
penetrated)-10h-45 specimens may indicate that the coating was not penetrated.
However, as observed for the rapid macrocell specimens, the values shown do not
reflect the effects of microcell corrosion, which increases metal loss. Losses
greater than 50
m (2 mil),
the thickness of the zinc coating, exhibited by the MC(only epoxy
penetrated)-10h-45 specimens may indicate that the coating was not penetrated.
However, as observed for the rapid macrocell specimens, the values shown do not
reflect the effects of microcell corrosion, which increases metal loss. Losses
greater than 50 ![]() m (2 mil) indicate that the zinc
was penetrated, which was demonstrated when the bars were autopsied, as
discussed later in this chapter.
m (2 mil) indicate that the zinc
was penetrated, which was demonstrated when the bars were autopsied, as
discussed later in this chapter.
Figure 84. Graph. Cracked beam test, average corrosion loss based on area exposed at holes through coating for conventional ECR and MC reinforcement with bars containing four holes.
Figure 85. Graph. Cracked beam test, average corrosion loss based on area exposed at holes through coating for conventional ECR and MC reinforcement with bars containing 10 holes.
The corrosion potentials for the specimens are shown in figure 86 and figure 87 for bars with 4 holes and in figure 88 and figure 89 for bars with 10 holes. For both the MC and ECR bars, the top bars reached a potential of about -0.600 V and sustained that value throughout the test period while the corrosion potential of the bottom bars remained between -0.200 and -0.400 V for most of the test for the MC specimens with 4 holes through the epoxy and between -0.200 and -0.450 V for the MC specimens with 10 holes through the epoxy. The corrosion potential of the ECR specimens remain between -200 and -400 V for specimens with both 4 and 10 holes through the epoxy.
Figure 86. Graph. Cracked beam test, corrosion potential of top mat for conventional ECR and MC reinforcement with bars containing four holes.
Figure 87. Graph. Cracked beam test, corrosion potential of bottom mat for conventional ECR and MC reinforcement with bars containing four holes.
Figure 88. Graph. Cracked beam test, corrosion potential of top mat for conventional ECR and MC reinforcement with bars containing 10 holes.
Figure 89. Graph. Cracked beam test, corrosion potential of bottom mat for conventional ECR and MC reinforcement with bars containing 10 holes.
Conventional Steel with Corrosion Inhibitors
The corrosion losses for
the cracked beam specimens containing conventional steel cast in concrete with corrosion inhibitors and for the
control specimens without a corrosion inhibitor are qualitatively similar to those observed for the matching southern exposure specimens. As
shown in table 20 and figure 90, the highest average corrosion losses were exhibited
by the specimens without a corrosion inhibitor (Conv.2-45) (29.7 ![]() m (1.17 mil)
at 96 weeks), followed by the specimens containing calcium nitrite, Rheocrete® 222+, and Hycrete™ (Conv.2(DCI)-45, Conv.2(RH)-45, and Conv.2(HY)-45), with losses of 26.4, 21.7, and
7.5
m (1.17 mil)
at 96 weeks), followed by the specimens containing calcium nitrite, Rheocrete® 222+, and Hycrete™ (Conv.2(DCI)-45, Conv.2(RH)-45, and Conv.2(HY)-45), with losses of 26.4, 21.7, and
7.5 ![]() m
(1.04, 0.854, and 0.29 mil), respectively. Although qualitatively the
same, the average losses for the cracked beam specimens containing Rheocrete® and calcium nitrite were much closer to the average loss for the specimens
without a corrosion inhibitor than were the
average losses for the specimens containing Hycrete™, indicating that
Hycrete™ provided measurably better macrocell corrosion protection to bare bars
in cracked concrete than the other two inhibitors. All of the losses were significantly
higher than observed in the southern exposure tests. The corrosion potentials
for the top mats of steel are shown in figure 91, with all specimens exhibiting
an average potential more negative than -0.400 V at week 1 except the specimens
containing Hycrete™, which dropped below -0.400 V at week 6. Similar to the southern
exposure specimens, the cracked beam specimens containing Hycrete™ exhibited
significantly higher mat-to-mat corrosion resistance than the other specimens
beginning at about week 24 (see figure 92).
m
(1.04, 0.854, and 0.29 mil), respectively. Although qualitatively the
same, the average losses for the cracked beam specimens containing Rheocrete® and calcium nitrite were much closer to the average loss for the specimens
without a corrosion inhibitor than were the
average losses for the specimens containing Hycrete™, indicating that
Hycrete™ provided measurably better macrocell corrosion protection to bare bars
in cracked concrete than the other two inhibitors. All of the losses were significantly
higher than observed in the southern exposure tests. The corrosion potentials
for the top mats of steel are shown in figure 91, with all specimens exhibiting
an average potential more negative than -0.400 V at week 1 except the specimens
containing Hycrete™, which dropped below -0.400 V at week 6. Similar to the southern
exposure specimens, the cracked beam specimens containing Hycrete™ exhibited
significantly higher mat-to-mat corrosion resistance than the other specimens
beginning at about week 24 (see figure 92).
1 ![]() m = 0.0394 mil
m = 0.0394 mil
Figure 90. Graph. Cracked beam test, average corrosion losses based on the total area for conventional reinforcement in specimens containing corrosion inhibitors.
Figure 91. Graph. Cracked beam test, corrosion potential of top mat for conventional reinforcement in specimens containing corrosion inhibitors.
Figure 92. Graph. Cracked beam test, mat-to-mat resistance for conventional reinforcement in specimens containing corrosion inhibitors.
Linear Polarization Resistance Tests
Linear polarization resistance tests provide values of the total corrosion rate (microcell plus macrocell), often expressed as corrosion current density. For ease of comparison with the macrocell results presented in this chapter, the corrosion current densities have been converted to corrosion rates using the equations in figure 5 or figure 7 and integrated to obtain corrosion losses. As an example, the total corrosion losses for conventional steel (Conv.-45 and Conv.-35) and conventional ECR (ECR-4h-45, ECR-10h-45, and ECR-10h-35) in the southern exposure tests based on linear polarization resistance readings are shown in figure 93 and figure 94.
Figure 93. Graph. Linear polarization test results for southern exposure specimens, average corrosion loss based on total area for conventional reinforcement and conventional ECR.
Figure 94. Graph. Linear polarization test results for southern exposure specimens, average corrosion loss based on total area for conventional reinforcement and conventional ECR (different scale).
The total losses at 96 weeks for the southern exposure and cracked beam tests are summarized in table 21 based on both total and exposed area (as explained in chapter 2, each of these values represents a single specimen). For comparison, the average macrocell losses at 96 weeks presented in table 11, table 12, and table 20 are shown side-by-side with the total losses. As expected, the losses based on the linear polarization results are, in nearly all cases, higher than those obtained based on macrocell current. This is true in 33 out of 34 cases for the southern exposure tests and in 30 out of 31 cases for the cracked beam test. As observed for macrocell losses, total corrosion losses are noticeably higher for the cracked beam test than for the southern exposure test.
Table 21. Total and macrocell corrosion loss at 96 weeks (![]() m) for southern exposure
and cracked beam specimens expressed in terms of total bar area and area
exposed at holes.
m) for southern exposure
and cracked beam specimens expressed in terms of total bar area and area
exposed at holes.
| Steel Designationa | Based on Total Area | Based on Exposed Area | ||||||
|---|---|---|---|---|---|---|---|---|
| Southern Exposure | Cracked Beam | Southern Exposure | Cracked Beam | |||||
| Total | Macrocell | Total | Macrocell | Total | Macrocell | Total | Macrocell | |
Controls |
||||||||
Conv.-45 |
27.1 |
7.1 |
166.8 |
13.1 |
NA |
NA |
NA |
NA |
Conv.2-45 |
20.5 |
14.4 |
49.2 |
29.9 |
NA |
NA |
NA |
NA |
Conv.-35 |
2.50 |
2.121 |
130.8 |
8.34 |
NA |
NA |
NA |
NA |
ECR-4h-45 |
0.030 |
0.007 |
0.645 |
0.041 |
14.44 |
3.13 |
310.0 |
19.91 |
ECR-10h-45 |
0.143 |
0.017 |
0.500 |
0.047 |
27.44 |
3.21 |
96.06 |
9.04 |
ECR-10h-35 |
0.038 |
0.008 |
0.842 |
0.139 |
7.25 |
1.47 |
161.8 |
26.70 |
Epoxies with increased adhesion |
||||||||
ECR(Chromate)-4h-45 |
0.029 |
0.018 |
1.727 |
0.074 |
14.13 |
8.76 |
829.7 |
35.66 |
ECR(Chromate)-10h-45 |
0.281 |
0.067 |
0.550 |
0.216 |
54.07 |
12.90 |
105.7 |
41.40 |
ECR(DuPont)-4h-45 |
0.106 |
0.026 |
0.525 |
0.105 |
50.92 |
12.34 |
252.1 |
50.44 |
ECR(DuPont)-10h-45 |
0.287 |
0.046 |
1.883 |
0.184 |
55.22 |
8.90 |
361.7 |
35.30 |
ECR(Valspar)-4h-45 |
0.221 |
0.032 |
1.912 |
0.084 |
105.92 |
15.58 |
918.2 |
40.35 |
ECR(Valspar)-10h-45 |
0.450 |
0.063 |
1.714 |
0.125 |
86.43 |
12.02 |
329.2 |
23.95 |
Corrosion inhibitors in concrete |
||||||||
Conv.2(DCI)-45 |
12.15 |
8.599 |
132.8 |
26.68 |
NA |
NA |
NA |
NA |
Conv.2(RH)-45 |
4.613 |
3.398 |
62.12 |
21.82 |
NA |
NA |
NA |
NA |
Conv.2(HY)-45 |
2.611 |
1.549 |
27.383 |
7.598 |
NA |
NA |
NA |
NA |
ECR(DCI)-4h-45 |
0.056 |
0.004 |
0.788 |
0.026 |
26.82 |
1.79 |
378.6 |
12.72 |
ECR(DCI)-10h-45 |
0.256 |
0.012 |
1.288 |
0.079 |
49.08 |
2.23 |
247.3 |
15.26 |
ECR(DCI)-10h-35 |
0.020 |
0.007 |
0.203 |
0.223 |
3.83 |
1.29 |
38.90 |
42.75 |
ECR(RH)-4h-45 |
0.002 |
0.010 |
2.225 |
0.141 |
0.96 |
4.58 |
1069 |
67.59 |
ECR(RH)-10h-45 |
0.024 |
-0.002 |
1.164 |
0.171 |
4.55 |
-0.39 |
223.5 |
32.80 |
ECR(RH)-10h-35 |
0.018 |
0.003 |
0.654 |
0.178 |
3.40 |
0.65 |
125.6 |
34.25 |
ECR(HY)-4h-45 |
0.005 |
-0.002 |
0.357 |
0.036 |
2.25 |
-0.82 |
171.4 |
17.06 |
ECR(HY)-10h-45 |
0.013 |
0.002 |
0.880 |
0.060 |
2.52 |
0.37 |
169.1 |
11.55 |
ECR(HY)-10h-35 |
0.069 |
0.001 |
0.973 |
0.194 |
13.21 |
0.23 |
186.8 |
37.22 |
ECR(primer/Ca(NO2)2)-4h-45 |
0.033 |
0.014 |
0.902 |
0.017 |
15.77 |
6.72 |
433.0 |
8.28 |
ECR(primer/Ca(NO2)2)-10h-45 |
0.029 |
0.064 |
1.030 |
0.098 |
5.55 |
12.25 |
197.8 |
18.89 |
ECR(primer/Ca(NO2)2)-10h-35 |
0.008 |
0.002 |
2.034 |
0.440 |
1.54 |
0.42 |
390.8 |
84.50 |
Epoxies with increased adhesion plus calcium nitrite in concrete |
||||||||
ECR(Chromate)-DCI-4h-45 |
0.080 |
0.007 |
- |
- |
15.35 |
1.26 |
- |
- |
ECR(DuPont)-DCI-4h-45 |
0.010 |
0.000 |
- |
- |
1.95 |
-0.06 |
- |
- |
ECR(Valspar)-DCI-4h-45 |
0.004 |
0.012 |
- |
- |
0.70 |
2.29 |
- |
- |
Bars with multiple coatings |
||||||||
MC(both layers penetrated)-4h-45 |
0.931 |
0.058 |
1.436 |
0.377 |
447.3 |
27.70 |
690.0 |
181.0 |
MC(both layers penetrated)-10h-45 |
1.859 |
0.628 |
3.647 |
0.672 |
357.0 |
120.6 |
700.5 |
129.0 |
MC(only epoxy penetrated)-4h-45 |
0.803 |
0.033 |
3.769 |
0.294 |
385.9 |
15.88 |
1810.5 |
141.3 |
MC(only epoxy penetrated)-10h-45 |
0.681 |
0.090 |
1.657 |
0.221 |
130.7 |
17.36 |
318.2 |
42.36 |
1 ![]() m = 0.0394 mil
m = 0.0394 mil
NA = Not applicable
- No specimen.
a See table 1 for abbreviation definitions. 4h = bar with four holes through epoxy, 10h = bar with 10 holes through epoxy. 35 = concrete with w/c of 0.35, 45 = concrete with w/c of 0.45.
The results for total (linear polarization resistance) and macrocell corrosion are shown for the southern exposure tests in figure 95 and figure 96 (w/c = 0.45) and for the cracked beam tests in figure 97 (w/c = 0.45 and 0.35). Losses for conventional steel, including conventional steel cast in concrete with corrosion inhibitors, are based on total area, while losses for ECR are based on the area exposed at holes through the coating and represent the average for specimens with 4 and 10 holes. The figures demonstrate that corrosion losses for conventional reinforcement based on total area are of the same order of magnitude as those for ECR based on exposed area, but, as discussed for the bare-bar rapid macrocell tests, the average corrosion losses based on total area for uncoated bars are generally lower than those based on exposed area for epoxy-coated bars. The figures also demonstrate that, overall, the relative performance of the systems is similar whether based on microcell or macrocell corrosion current.
Figure 95. Graph. Southern exposure specimens, total versus macrocell corrosion loss based on total area for conventional reinforcement and area exposed at holes through coating for ECR with w/c = 0.45.
Figure 96. Graph. Southern exposure specimens, total versus macrocell corrosion loss based on total area for conventional reinforcement and area exposed at holes through coating for ECR with w/c = 0.45 (different scale).
1 ![]() m = 0.0394 mil
m = 0.0394 mil
Figure 97. Graph. Cracked beam specimens, total versus macrocell corrosion loss based on total area for conventional reinforcement and area exposed at holes through coating for ECR with w/c = 0.45 or 0.35.
Total losses were highest for the MC bars and significantly
lower for other systems in intact concrete, as shown in figure 95 and figure 96.
These figures do not show the results for the southern exposure specimens with
concrete with a w/c ratio of 0.35; if plotted, those results would appear in a
grouping with macrocell losses between 0.6 and 2.1 ![]() m (0.02 and 0.083 mil) and
total losses between 2.5 and 13.2
m (0.02 and 0.083 mil) and
total losses between 2.5 and 13.2 ![]() m (0.098 and 0.520 mil).
m (0.098 and 0.520 mil).
Figure 95 through figure 97 illustrate the relative performance of the systems, with the more effective systems exhibiting data points closer to the origin. Based on corrosion losses in the southern exposure and cracked beam tests as the measure of performance, all of the systems incorporating ECR appear to perform well in intact concrete, with the exception of the MC bars. In cracked concrete, all systems exhibited significantly higher losses and wider scatter in both total and macrocell corrosion, as shown in figure 97. When compared based on total area of steel, the systems involving conventional reinforcement both with and without a corrosion inhibitor did not perform as well as the systems with ECR or MC reinforcement.
Table 22 compares the average corrosion rates based on losses after corrosion initiation calculated using the linear polarization results with those calculated based on macrocell corrosion (see table 15 and table 20). The macrocell corrosion rates represent the individual specimens for which the linear polarization resistance readings were taken. As observed for corrosion losses, the corrosion rates based on the linear polarization results are, in nearly all cases, higher than those obtained based on macrocell current. This is true in 32 out of 34 cases for the southern exposure tests and in all 31 cases for the cracked beam test. Also similar to losses, corrosion rates are much higher for the cracked beam test than for the southern exposure test.
The total and macrocell corrosion rates are compared for the southern exposure tests in figure 98 and figure 99 (w/c = 0.45) and for the cracked beam tests in figure 100 (w/c = 0.45 and 0.35). Following the format used for figure 96 and figure 97, corrosion rates for uncoated bars are based on total area while the rates for coated bars are based on the area exposed at holes through the coating and represent the average for specimens with 4 and 10 holes. Observations based on corrosion rates are similar to those based on losses, with corrosion rates for conventional reinforcement based on total area somewhat lower but of the same order of magnitude as those for ECR based on exposed area. When based on total area, the systems with conventional reinforcement, with and without a corrosion inhibitor, do not perform as well as the systems with ECR or MC reinforcement.
Table 22. Average total and macrocell corrosion rates (![]() m/year) based on losses
after corrosion initiation for southern exposure and cracked beam specimens
expressed
in terms of total bar area and area exposed at holes.
m/year) based on losses
after corrosion initiation for southern exposure and cracked beam specimens
expressed
in terms of total bar area and area exposed at holes.
Steel Designationa |
Based on Total Area |
Based on Exposed Area |
||||||
Southern Exposure |
Cracked Beam |
Southern Exposure |
Cracked Beam |
|||||
Total |
Macrocell |
Total |
Macrocell |
Total |
Macrocell |
Total |
Macrocell |
|
Controls |
||||||||
Conv.-45 |
20.5 |
7.40 |
90.3 |
7.74 |
NA |
NA |
NA |
NA |
Conv.2-45 |
17.0 |
10.7 |
30.6 |
24.6 |
NA |
NA |
NA |
NA |
Conv.-35 |
2.07 |
1.61 |
73.03 |
6.34 |
NA |
NA |
NA |
NA |
ECR-4h-45 |
0.028 |
b |
0.562 |
0.004 |
13.2 |
b |
269.6 |
1.99 |
ECR-10h-45 |
0.152 |
0.066 |
0.358 |
0.019 |
29.2 |
12.7 |
68.8 |
3.69 |
ECR-10h-35 |
0.030 |
0.012 |
1.197 |
0.088 |
5.72 |
2.35 |
229.9 |
16.9 |
Epoxies with increased adhesion |
||||||||
ECR(Chromate)-4h-45 |
0.021 |
b |
1.008 |
0.029 |
10.3 |
b |
483.6 |
14.1 |
ECR(Chromate)-10h-45 |
0.199 |
0.006 |
0.368 |
0.012 |
38.2 |
1.18 |
70.6 |
2.37 |
ECR(DuPont)-4h-45 |
0.112 |
0.029 |
0.309 |
0.070 |
53.9 |
13.8 |
148.4 |
33.5 |
ECR(DuPont)-10h-45 |
0.242 |
0.025 |
1.261 |
0.069 |
46.5 |
4.72 |
242.2 |
13.2 |
ECR(Valspar)-4h-45 |
0.193 |
0.032 |
1.218 |
0.086 |
92.5 |
15.5 |
584.6 |
41.1 |
ECR(Valspar)-10h-45 |
0.399 |
0.064 |
1.116 |
0.043 |
76.7 |
12.3 |
214.3 |
8.28 |
Corrosion inhibitors in concrete |
||||||||
Conv.2(DCI)-45 |
9.79 |
7.81 |
106.6 |
17.5 |
NA |
NA |
NA |
NA |
Conv.2(RH)-45 |
3.82 |
2.57 |
48.34 |
13.6 |
NA |
NA |
NA |
NA |
Conv.2(HY)-45 |
1.82 |
0.791 |
18.2 |
4.91 |
NA |
NA |
NA |
NA |
ECR(DCI)-4h-45 |
0.045 |
b |
0.421 |
0.035 |
21.7 |
b |
202.3 |
16.6 |
ECR(DCI)-10h-45 |
0.227 |
0.012 |
0.754 |
0.021 |
43.5 |
2.33 |
144.7 |
4.10 |
ECR(DCI)-10h-35 |
0.022 |
0.006 |
0.239 |
0.246 |
4.28 |
1.16 |
46.0 |
47.2 |
ECR(RH)-4h-45 |
0.001 |
0.012 |
1.25 |
0.037 |
0.581 |
5.94 |
601.3 |
17.8 |
ECR(RH)-10h-45 |
0.015 |
b |
0.658 |
0.079 |
2.86 |
b |
126.3 |
15.1 |
ECR(RH)-10h-35 |
0.011 |
b |
0.920 |
0.074 |
2.09 |
b |
176.7 |
14.3 |
ECR(HY)-4h-45 |
0.002 |
b |
0.215 |
0.053 |
1.19 |
b |
103.0 |
25.5 |
ECR(HY)-10h-45 |
0.011 |
0.004 |
0.468 |
0.033 |
2.09 |
0.674 |
89.8 |
6.37 |
ECR(HY)-10h-35 |
0.049 |
b |
1.37 |
0.161 |
9.44 |
b |
263.9 |
30.9 |
ECR(primer/Ca(NO2)2)-4h-45 |
0.028 |
0.046 |
0.509 |
0.012 |
13.3 |
22 |
244.3 |
5.74 |
ECR(primer/Ca(NO2)2)-10h-45 |
0.037 |
0.033 |
0.608 |
0.048 |
7.04 |
6.39 |
116.7 |
9.19 |
ECR(primer/Ca(NO2)2)-10h-35 |
0.004 |
b |
2.80 |
0.321 |
0.741 |
b |
537.6 |
61.6 |
Epoxies with increased adhesion plus calcium nitrite in concrete |
||||||||
ECR(Chromate)-DCI-4h-45 |
0.036 |
0.021 |
- |
- |
17.1 |
10.3 |
- |
- |
ECR(DuPont)-DCI-4h-45 |
0.004 |
b |
- |
- |
2.12 |
b |
- |
- |
ECR(Valspar)-DCI-4h-45 |
0.001 |
b |
- |
- |
0.423 |
b |
- |
- |
Bars with multiple coatings |
||||||||
MC(both layers penetrated)-4h-45 |
0.572 |
0.027 |
0.809 |
0.206 |
274.5 |
13.1 |
388.1 |
98.7 |
MC(both layers penetrated)-10h-45 |
1.32 |
0.358 |
2.04 |
0.289 |
254 |
68.8 |
391.2 |
55.5 |
MC(only epoxy penetrated)-4h-45 |
0.518 |
0.077 |
2.12 |
0.352 |
248.8 |
36.9 |
1018.8 |
169 |
MC(only epoxy penetrated)-10h-45 |
0.506 |
0.039 |
2.33 |
0.207 |
97.2 |
7.52 |
448.2 |
39.7 |
1 ![]() m = 0.0394 mil
m = 0.0394 mil
NA = Not applicable; - No specimen.
a See table 1 for abbreviation definitions. 4h = bar with four holes
through epoxy, 10h = bar with 10 holes through epoxy.
35 = concrete with w/c of 0.35, 45 = concrete with w/c of 0.45.
b No corrosion observed.
1 ![]() m = 0.0394 mil
m = 0.0394 mil
Figure 98. Graph. Southern exposure specimens, average total and macrocell corrosion rates based on losses after corrosion initiation based on total area for conventional reinforcement and area exposed at holes through coating for coated reinforcement, w/c = 0.45.
1 ![]() m = 0.0394 mil
m = 0.0394 mil
Figure 99. Graph. Southern exposure specimens, average total and macrocell corrosion rates based on losses after corrosion initiation based on total area for conventional reinforcement and area exposed at holes through coating for coated reinforcement, w/c = 0.45 (different scale).
1 ![]() m = 0.0394 mil
m = 0.0394 mil
Figure 100. Graph. Cracked beam specimens, average total and macrocell corrosion rates based on losses after corrosion initiation based on total area for conventional reinforcement and area exposed at holes through coating for coated reinforcement, w/c = 0.45 or 0.35.
The results in table 22 are used in chapter 4 to estimate total corrosion rates as a function of macrocell corrosion rates for the field tests, for which linear polarization resistance data are not available.
The relative performance of the systems can be judged further based on the autopsies of the specimens, performed after completion of the tests and based on the performance of the field test specimens. As discussed in chapter 4, the tests demonstrated that the coated-bar systems under evaluation would serve well in practice.
Autopsy of Bench-Scale Test Specimens
Following the tests, the specimens were evaluated for staining and cracking and autopsied to observe the degree of corrosion on the reinforcing steel. With the exception of the cracked beam specimens containing conventional steel, little cracking or staining was observed on the surface of the bench-scale test specimens. Upon removal of the concrete, the degree of corrosion damage was observed.
Figure 101 illustrates the extent of corrosion damage at 96 weeks to conventional steel (Conv.) in the southern exposure tests. The two top bars (at the left of the figure) exhibited varying degrees of corrosion along their lengths. The four bottom bars exhibited little if any corrosion damage. In contrast, the cracked beam specimen containing conventional steel, shown previously in figure 77, exhibited stains on the top and sides as well as a crack that extended from the original simulated crack in the center top of the specimen. The cause of the crack extension is shown figure 102, where the top bar shows highly nonuniform but major corrosion with the volume of corrosion products clearly adequate to cause crack extension. The bottom bars exhibited corrosion, as well, especially the center bar in the figure.
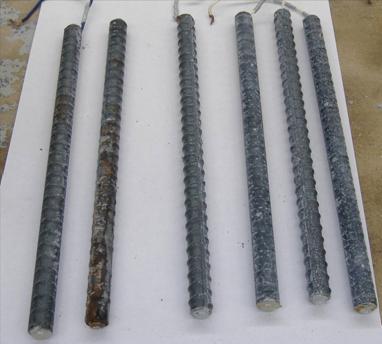
Figure 101. Photo. Conventional steel bars from southern exposure specimen after 96 weeks.
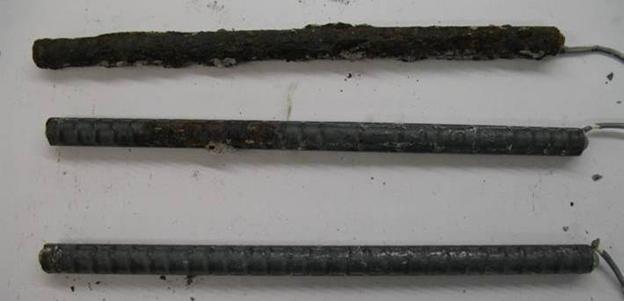
Figure 102. Photo. Conventional steel bars from cracked beam specimens after 96 weeks.
Upon removal of the concrete from epoxy-coated bars, the epoxy coating was observed to be intact on all specimens, although some specimens exhibited blisters, as shown in figure 103. This figure shows a top bar from a southern exposure specimen containing conventional ECR. Holes placed in the epoxy prior to the test are shown to the center left and right in the figure, while the blister in the epoxy is shown at the center. Corrosion products are apparent at both the left and the right penetrations.
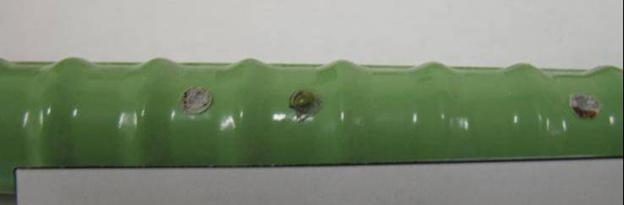
Figure 103. Photo. Conventional epoxy-coated bar from southern exposure specimen after 96 weeks.
To evaluate the bond between the epoxy and the steel, a radial 45-degree cut was made with a knife at the center of selected openings at the intentionally damaged areas. Following the same procedure described in chapter 2 for the cathodic disbondment tests, an attempt was made to lift the coating at these locations. If the bond between the coating and the steel was in good condition, the epoxy could not be removed.
The bar surface was inspected for corrosion products following disbondment. In most cases, the bar surface appeared black or dark brown, suggesting corrosion in the absence of oxygen. Within an hour, the color typically changed to orange or light brown as the corrosion products were exposed to oxygen.
The total area of coating disbondment was used to evaluate the bond between the epoxy coating and the steel. Figure 104 shows the bar from figure 103 shortly after disbondment at one of the penetrations. Figure 105 shows top and bottom bars after disbondment for bars cast in concrete containing calcium nitrite. The greater disbondment exhibited by the top bar compared to the bottom bar is typical. Corrosion products were present at the left penetration and in the disbonded region on the bar. Figure 106 shows a top bar in a southern exposure specimen cast with concrete containing Hycrete™. In this case, corrosion products were apparent at the left penetration, and the epoxy coating exhibited significant disbondment at the penetration near the center of the image but no disbondment at the penetration to the right of the image. Figure 107 illustrates a bar coated with an epoxy (ECR(DuPont)) that initially provided improved adhesion. The upper bar in the image, a top bar in the specimen, underwent complete disbondment while the lower bar in the image, a bottom bar in the specimen, underwent only partial disbondment. For the top bar, all three penetrations in the epoxy exhibited corrosion products, which were also apparent in the disbonded region. MC bars with holes through the epoxy only and with holes penetrating both the epoxy and zinc layers are shown in figure 108 and figure 109, respectively. Corrosion products were present at the points where the epoxy was penetrated. Both bars exhibited varying degrees of disbondment. In all cases, some corrosion products were observable within the disbonded region. For the MC bars, the zinc, the more active metal, was seen to preferentially corrode under the epoxy coating, thus protecting the underlying steel.
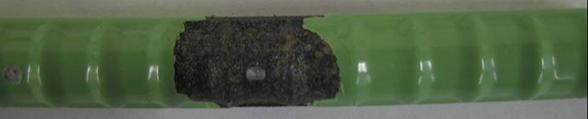
Figure 104. Photo. Conventional epoxy-coated bar from figure 103 after disbondment test.
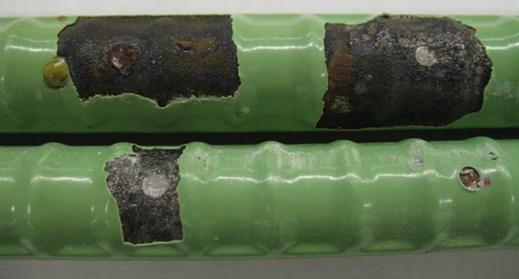
Figure 105. Photo. Conventional epoxy-coated top and bottom bars from southern exposure specimen containing calcium nitrite after 96 weeks.
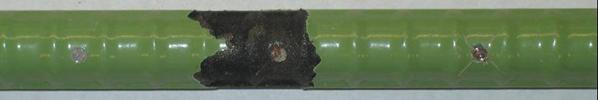
Figure 106. Photo. Conventional epoxy-coated top bar from southern exposure specimen containing Hycrete™ after 96 weeks.
Figure 107. Photo. DuPont™ high-adhesion epoxy-coated top and bottom bars from southern exposure specimen after 96 weeks.
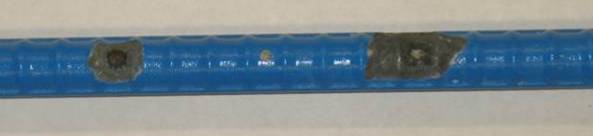
Figure 108. Photo. MC top bar with holes through epoxy only from southern exposure specimen after 96 weeks.
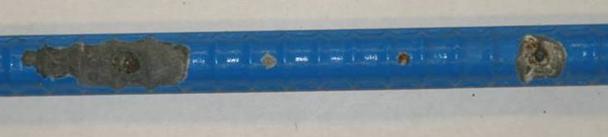
Figure 109. Photo. MC top bar with holes penetrating both epoxy and zinc from southern exposure specimen after 96 weeks.
In addition to visual inspection, the disbonded area on the bars was measured using a grid of 2.5‑mm (0.1‑inch) squares printed on a transparent plastic sheet superimposed on the disbonded region. For each southern exposure and cracked beam specimen, one bar each from the top and bottom mats was chosen to measure disbondment. Disbondment tests were performed at two locations on the upper surface of each bar. When the disbonded area extended a distance greater than 14.7 mm (0.58 inches) in all directions, the bar was said to exhibit total disbondment. Damage locations that exhibited total disbondment were assigned to disbonded area of 680 mm2 (1.05 in2), the approximate area of the circle with a 14.7-mm (0.58-inch) radius.
Figure 110 and figure 111 show the disbonded areas for bars in the southern exposure and cracked beam specimens, respectively, cast with concrete with a w/c ratio of 0.45. In the uncracked concrete, disbondment greater than 515 mm2 (0.8 in2) was observed on the top mat of steel for the conventional ECR specimens as well as for all bars with improved adhesion between the epoxy and the steel cast in concrete without an inhibitor, with a maximum values in excess of 680 mm2 (1.05 in2) for the ECR(DuPont) bars. Less disbondment was observed for the MC bars and for all bars cast in concrete containing corrosion inhibitors, including those with improved adhesion cast in concrete containing calcium nitrite. The bars in concrete containing Hycrete™ exhibited the least disbondment. Disbondment in the bottom mat was below 130 mm2 (0.2 in2) for all bars, with MC bars and epoxy-coated bars cast in concrete containing inhibitors showing less bottom mat disbondment than the control and improved adhesion bars.
In cracked concrete, a disbonded area greater than 515 mm2 (0.8 in2) was observed for the top bars in all specimens except MC bars, which exhibited an average disbonded area of approximately 355 mm2 (0.55 in2). ECR(Chromate) specimens exhibited total disbondment. All bottom-mat bars in the cracked beam specimens exhibited increased disbondment compared to bars in uncracked concrete with the exception of the MC bars, which exhibited somewhat less.
1 mm2 = 0.00155 in2
Figure 110. Graph. Disbondment results for southern exposure specimens.
1 mm2 = 0.00155 in2
Figure 111. Graph. Disbondment results for cracked beam specimens.
Figure 112 and figure 113 compare the disbondment of bars in southern exposure and cracked beam specimens cast in concrete with a w/c ratio of 0.35 with that for similar specimens cast with a w/c ratio of 0.45. As shown in figure 112, the average disbonded areas for bars in the southern exposure specimens with w/c of 0.35 ranged from 11 percent (ECR(RH)) to 76 percent (ECR(DCI)) of the values for the southern exposure specimens with w/c of 0.45. In contrast, figure 113 shows that little difference was observed for the cracked beam specimens as a function of w/c ratio, emphasizing both the negative impact of cracks on disbondment and the inability of a lower w/c ratio to limit disbondment in the presence of cracks.
1 mm2 = 0.00155 in2
Figure 112. Graph. Comparison of disbondment of top bars in southern exposure specimens cast in concrete with w/c = 0.35 and 0.45.
1 mm2 = 0.00155 in2
Figure 113. Graph. Comparison of disbondment of top bars in cracked beam specimens cast in concrete with w/c = 0.35 and 0.45.
The field tests provided a highly realistic evaluation of corrosion-protection systems. The test specimens were designed to match bridge decks. The key difference was the use of a 25‑mm (1‑inch) top cover, which provides earlier corrosion initiation than obtained with the 150-mm (3‑inch) top cover typically used in practice for bridge decks. Four specimens were used to evaluate each corrosion-protection system except those cast with the corrosion inhibitor calcium nitrite, for which six specimens were used.
As shown in table 7 in chapter 2, the field tests specimens were cast in nine batches. Half of the specimens were cast without cracks and half of the specimens contained simulated cracks over four of the seven top reinforcing bars. The coating on epoxy-coated bars was penetrated by 16 3.2-mm (0.125-inch)-diameter holes to simulate defects in the coating. Rock salt in solution or solid form was applied every 4 weeks to provide a salt application rate matching that used on bridge decks in Kansas, as described in chapter 2. At the conclusion of the tests (250 or 254 weeks after initial exposure), chloride samples were obtained from cores taken at the four corners of each specimen in batches 3 through 9. The chloride contents for those specimens at a depth of 25 mm (1 inch) are listed in table 23. The chloride content for the specimens in batch 1 was extrapolated from vacuum drill samples taken at 213 weeks. No data is available for batch 2.
Table 23. Average chloride content (kg/m3) at a depth of 25 mm (1 inch) at end of field tests.
| Batch | Specimena | Uncracked | Cracked |
|---|---|---|---|
1b |
Conv.-1, ECR-1, ECR(Valspar)-1 |
4.40 |
4.40 |
2 |
ECR(Chromate)-1, ECR(DuPont)-1, MC-1 |
- |
- |
3 |
Conv.-2 |
1.97 |
3.85 |
ECR-2 |
3.22 |
2.18 |
|
ECR(primer/Ca(NO2)2)-1 |
- |
- |
|
4 |
ECR(Chromate)-2 |
3.53 |
4.89 |
ECR(DuPont)-2 |
4.78 |
4.43 |
|
ECR(Valspar)-2 |
3.03 |
4.82 |
|
5 |
ECR(primer/Ca(NO2)2)-2 |
9.86 |
8.36 |
MC-2 |
8.92 |
8.78 |
|
6 |
ECR(DCI)-1 |
8.30 |
9.67 |
ECR(DCI)-2 |
7.73 |
9.03 |
|
7 |
ECR(DCI)-3 |
8.26 |
5.20 |
8 |
ECR(RH)-1 |
9.34 |
8.49 |
ECR(RH)-2 |
6.23 |
7.56 |
|
9 |
ECR(HY)-1 |
0.55 |
1.12 |
ECR(HY)-2 |
0.29 |
1.10 |
1 kg/m3 = 1.69 lb/yd3
- No data.
a See table 1 for abbreviation definitions.
b Extrapolated from vacuum drill samples taken at 213 weeks.
The chloride content at a depth of 25 mm (1 inch) is plotted
versus the w/c ratio in figure 114 for the seven batches for which data are
available not including the concrete in batch 9, which contained Hycrete™. Hycrete™ was excluded because, as observed for the
southern exposure tests, the chloride content of the specimens containing
Hycrete™ was very low (0.77 kg/m3 (1.30 lb/yd3)).
As expected, the figure shows a general trend of increasing chloride content
with increasing w/c ratio. The variation in w/c ratio between batches is the
result of variations
in the quality of the ready-mix concrete delivered for casting the specimens
and is typical of
the range of properties obtained in the field. Overall, the average chloride
contents differed markedly, ranging from 0.77 kg/m3 (1.30 lb/yd3)
for the concrete containing Hycrete™ to 2.81 kg/m3 (4.73 lb/yd3)
for batch 3 and 8.73 kg/m3 (14.7 lb/yd3) for batch 5 for
concretes without a corrosion inhibitor. Extreme values for individual
specimens ranged from a low of 0.29 kg/m3 (0.49 lb/yd3) for uncracked Hycrete™ specimen 2 to a high of
9.86 kg/m3 (16.6 lb/yd3) for uncracked ECR(primer/Ca(NO2)2)
specimen 2. The chloride contents for the individual specimens are shown
graphically in figure 115 and figure 116 for specimens without and with cracks,
respectively. Because the chloride samples were taken from the corners of the
specimens, the values of chloride content do not reflect the effect of the
cracks. They are best used as a measure of the permeability of the concrete.
Figure 114. Graph. Average chloride content at a depth of 25 mm (1 inch) versus w/c ratio at end of field tests.
1 kg/m3 = 1.69 lb/yd3
* Extrapolated from vacuum drill data taken at 213 weeks.
Figure 115. Graph. Average chloride content at a depth of 25 mm (1 inch) at end of field tests for uncracked field test specimens.
1 kg/m3 = 1.69 lb/yd3
* Extrapolated from vacuum drill data taken at 213 weeks.
Figure 116. Graph. Average chloride content at a depth of 25 mm (1 inch) at end of field tests for cracked field test specimens.
The corrosion losses based on the total area of the bar in contact with the concrete and on the exposed area at the holes in the epoxy are presented in table 24 and table 25 for specimens without cracks and in table 26 and table 27 for specimens with cracks. The data represent two or four bars per specimen, as shown in the tables. As noted on the tables, negative values of corrosion loss are excluded from the average values of loss.
Table 24. Corrosion loss at end of field tests (![]() m) based on total area
for specimens without simulated cracks.
m) based on total area
for specimens without simulated cracks.
| Steel Designationa | Exposure Time (weeks) | Test Bar | Averageb | Standard Deviation | |||
|---|---|---|---|---|---|---|---|
| 1 | 2 | 3 | 4 | ||||
Controls |
|||||||
Conv. (1) |
250 |
3.67 |
2.49 |
3.08 |
0.833 |
||
Conv. (2) |
254 |
0.142 |
1.17 |
0.657 |
0.728 |
||
ECR (1) |
250 |
0.024 |
0.069 |
0.046 |
0.032 |
||
ECR (2) |
254 |
0.016 |
0.008 |
-0.005c |
0.004 |
0.009 |
0.006 |
Bars with increased adhesion |
|||||||
ECR(Chromate) (1) |
250 |
0.015 |
0.013 |
0.014 |
0.001 |
||
ECR(Chromate) (2) |
254 |
0.047 |
-0.042c |
-0.006c |
0.025 |
0.036 |
0.016 |
ECR(DuPont) (1) |
250 |
0.028 |
0.014 |
0.021 |
0.010 |
||
ECR(DuPont) (2) |
254 |
0.016 |
0.007 |
0.011 |
0.037 |
0.018 |
0.013 |
ECR(Valspar) (1) |
250 |
0.009 |
0.024 |
0.016 |
0.010 |
||
ECR(Valspar) (2) |
254 |
0.025 |
-0.009c |
0.100 |
0.041 |
0.055 |
0.040 |
Corrosion inhibitors in concrete |
|||||||
ECR(DCI) (1) |
250 |
0.031 |
0.038 |
0.019 |
0.030 |
0.030 |
0.008 |
ECR(DCI) (2) |
254 |
0.062 |
0.097 |
0.045 |
0.017 |
0.055 |
0.033 |
ECR(DCI) (3) |
254 |
0.035 |
0.034 |
0.007 |
0.023 |
0.025 |
0.013 |
ECR(RH) (1) |
250 |
0.068 |
0.048 |
0.016 |
0.045 |
0.044 |
0.022 |
ECR(RH) (2) |
254 |
-0.003c |
-0.008c |
-0.004c |
0.029 |
0.029 |
- |
ECR(HY) (1) |
250 |
-0.001c |
0.003 |
0.011 |
0.047 |
0.020 |
0.023 |
ECR(HY) (2) |
254 |
0.022 |
0.017 |
0.033 |
0.025 |
0.024 |
0.007 |
ECR(primer/Ca(NO2)2) (1) |
250 |
0.000 |
0.020 |
0.033 |
0.028 |
0.027 |
0.007 |
ECR(primer/Ca(NO2)2) (2) |
254 |
0.070 |
0.030 |
0.024 |
0.046 |
0.042 |
0.020 |
Bars with multiple coatings |
|||||||
MC (1) |
250 |
0.024 |
0.023 |
0.024 |
0.001 |
||
MC (2) |
254 |
0.047 |
0.008 |
0.007 |
0.049 |
0.028 |
0.023 |
1 ![]() m = 0.0394 mil
m = 0.0394 mil
- No standard deviation.
Blank cells indicate that the test bar was not present.
a See table 1 for abbreviation definitions. All epoxy-coated bars
are penetrated with 16 surface holes.
b Based on top mat only.
c Excluded from average.
Table 25. Corrosion loss at end of field tests (![]() m) based on area
exposed at holes through coating for specimens without simulated cracks.
m) based on area
exposed at holes through coating for specimens without simulated cracks.
| Steel Designationa | Exposure Time (weeks) | Test Bar | Averageb | Standard Deviation | |||
|---|---|---|---|---|---|---|---|
| 1 | 2 | 3 | 4 | ||||
Controls |
|||||||
ECR (1) |
250 |
9.25 |
27.0 |
18.1 |
12.6 |
||
ECR (2) |
254 |
6.27 |
3.29 |
-2.04c |
1.62 |
3.73 |
2.36 |
Bars with increased adhesion |
|||||||
ECR(Chromate) (1) |
250 |
5.72 |
5.02 |
5.37 |
0.498 |
||
ECR(Chromate) (2) |
254 |
18.4 |
-16.5c |
-2.34c |
9.93 |
14.2 |
5.99 |
ECR(DuPont) (1) |
250 |
11.1 |
5.57 |
8.32 |
3.90 |
||
ECR(DuPont) (2) |
254 |
6.39 |
2.87 |
4.47 |
14.4 |
7.03 |
5.10 |
ECR(Valspar) (1) |
250 |
3.49 |
9.18 |
6.33 |
4.02 |
||
ECR(Valspar) (2) |
254 |
9.72 |
-3.49c |
38.9 |
16.0 |
21.5 |
15.4 |
Corrosion inhibitors in concrete |
|||||||
ECR(DCI) (1) |
250 |
12.2 |
14.8 |
7.57 |
11.9 |
11.6 |
3.00 |
ECR(DCI) (2) |
254 |
24.1 |
37.7 |
17.5 |
6.46 |
21.4 |
13.1 |
ECR(DCI) (3) |
254 |
13.8 |
13.3 |
2.59 |
9.00 |
9.66 |
5.18 |
ECR(RH) (1) |
250 |
26.6 |
18.7 |
6.06 |
17.6 |
17.3 |
8.47 |
ECR(RH) (2) |
254 |
-1.34c |
-3.12c |
-1.69c |
11.2 |
11.2 |
- |
ECR(HY) (1) |
250 |
-0.458c |
1.25 |
4.42 |
18.3 |
7.99 |
9.07 |
ECR(HY) (2) |
254 |
8.59 |
6.69 |
13.1 |
9.76 |
9.52 |
2.67 |
ECR(primer/Ca(NO2)2) (1) |
250 |
-0.141c |
7.73 |
12.9 |
11.0 |
10.5 |
2.62 |
ECR(primer/Ca(NO2)2) (2) |
254 |
27.1 |
11.6 |
9.53 |
17.9 |
16.5 |
7.91 |
Bars with multiple coatings |
|||||||
MC (1) |
250 |
9.54 |
8.81 |
9.17 |
0.515 |
||
MC (2) |
254 |
18.4 |
2.94 |
2.89 |
18.9 |
10.8 |
9.10 |
1 ![]() m = 0.0394 mil
m = 0.0394 mil
- No standard deviation.
Blank cells indicate that the test bar was not present.
a See table 1 for
abbreviation definitions. All epoxy-coated bars are penetrated with 16 surface
holes.
b Based on top mat only.
c Excluded from average.
Table 26. Corrosion loss at end of field tests (![]() m) based on total area
for specimens with simulated cracks.
m) based on total area
for specimens with simulated cracks.
| Steel Designationa | Exposure time (weeks) | Test Bar | Averageb | Standard Deviation | |||
|---|---|---|---|---|---|---|---|
| 1 | 2 | 3 | 4 | ||||
Controls |
|||||||
Conv. (1) |
250 |
2.26 |
6.71 |
4.49 |
3.14 |
||
Conv. (2) |
254 |
4.01 |
3.34 |
3.68 |
0.475 |
||
ECR (1) |
250 |
0.015 |
0.065 |
0.040 |
0.035 |
||
ECR (2) |
254 |
0.056 |
0.171 |
0.044 |
0.042 |
0.078 |
0.062 |
Bars with increased adhesion |
|||||||
ECR(Chromate) (1) |
250 |
0.039 |
0.030 |
0.035 |
0.006 |
||
ECR(Chromate) (2) |
254 |
0.099 |
0.066 |
0.051 |
0.061 |
0.069 |
0.021 |
ECR(DuPont) (1) |
250 |
0.026 |
0.050 |
0.038 |
0.017 |
||
ECR(DuPont) (2) |
254 |
0.048 |
0.029 |
0.066 |
0.234 |
0.094 |
0.095 |
ECR(Valspar) (1) |
250 |
0.071 |
0.177 |
0.124 |
0.075 |
||
ECR(Valspar) (2) |
254 |
0.023 |
0.064 |
0.018 |
0.153 |
0.064 |
0.062 |
Corrosion inhibitors in concrete |
|||||||
ECR(DCI) (1) |
250 |
0.043 |
0.065 |
0.079 |
0.072 |
0.065 |
0.015 |
ECR(DCI) (2) |
254 |
0.023 |
0.041 |
0.074 |
0.064 |
0.050 |
0.023 |
ECR(DCI) (3) |
254 |
0.105 |
0.124 |
0.004 |
0.020 |
0.063 |
0.060 |
ECR(RH) (1) |
250 |
0.073 |
0.084 |
0.038 |
0.059 |
0.063 |
0.020 |
ECR(RH) (2) |
254 |
0.066 |
0.057 |
0.073 |
0.074 |
0.068 |
0.007 |
ECR(HY) (1) |
250 |
0.044 |
0.019 |
0.008 |
-0.006c |
0.024 |
0.018 |
ECR(HY) (2) |
254 |
0.005 |
0.020 |
-0.006c |
-0.004c |
0.013 |
0.011 |
ECR(primer/Ca(NO2)2) (1) |
250 |
0.006 |
0.017 |
0.046 |
0.009 |
0.019 |
0.018 |
ECR(primer/Ca(NO2)2) (2) |
254 |
0.016 |
0.043 |
0.041 |
0.067 |
0.042 |
0.021 |
Bars with multiple coatings |
|||||||
MC (1) |
250 |
0.044 |
0.056 |
0.050 |
0.008 |
||
MC (2) |
254 |
0.074 |
0.061 |
0.074 |
0.021 |
0.057 |
0.025 |
1 ![]() m = 0.0394 mil
m = 0.0394 mil
Blank cells indicate that the test bar was not present.
a See table 1 for
abbreviation definitions. All epoxy-coated bars are penetrated with 16 surface
holes.
b Based on top mat only.
c Excluded from average.
Table 27. Corrosion loss at end of field tests (![]() m) based on area
exposed at holes through coating for specimens with simulated cracks.
m) based on area
exposed at holes through coating for specimens with simulated cracks.
Steel Designationa |
Exposure time (weeks) |
Test Bar |
Averageb |
Standard Deviation |
|||
|---|---|---|---|---|---|---|---|
1 |
2 |
3 |
4 |
||||
Controls |
|||||||
ECR (1) |
250 |
5.72 |
25.2 |
15.5 |
13.8 |
||
ECR (2) |
254 |
21.9 |
66.8 |
17.1 |
16.4 |
30.6 |
24.3 |
Bars with increased adhesion |
|||||||
ECR(Chromate) (1) |
250 |
15.3 |
11.7 |
13.5 |
2.52 |
||
ECR(Chromate) (2) |
254 |
38.7 |
25.9 |
19.9 |
23.7 |
27.1 |
8.16 |
ECR(DuPont) (1) |
250 |
10.2 |
19.6 |
14.9 |
6.64 |
||
ECR(DuPont) (2) |
254 |
18.7 |
11.3 |
25.6 |
91.4 |
36.8 |
36.9 |
ECR(Valspar) (1) |
250 |
27.8 |
69.2 |
48.5 |
29.3 |
||
ECR(Valspar) (2) |
254 |
8.9 |
24.9 |
7.06 |
59.6 |
25.1 |
24.4 |
Corrosion inhibitors in concrete |
|||||||
ECR(DCI) (1) |
250 |
16.8 |
25.3 |
30.7 |
28.1 |
25.2 |
6.02 |
ECR(DCI) (2) |
254 |
9.00 |
15.9 |
28.9 |
24.9 |
19.7 |
8.96 |
ECR(DCI) (3) |
254 |
40.9 |
48.5 |
1.48 |
7.96 |
24.7 |
23.4 |
ECR(RH) (1) |
250 |
28.3 |
32.7 |
14.8 |
23.0 |
24.7 |
7.70 |
ECR(RH) (2) |
254 |
25.9 |
22.4 |
28.4 |
28.7 |
26.4 |
2.92 |
ECR(HY) (1) |
250 |
17.2 |
7.31 |
3.31 |
-2.47c |
9.27 |
7.15 |
ECR(HY) (2) |
254 |
1.95 |
7.85 |
-2.24c |
-1.55c |
4.90 |
4.17 |
ECR(primer/Ca(NO2)2) (1) |
250 |
2.27 |
6.55 |
18.0 |
3.59 |
7.59 |
7.14 |
ECR(primer/Ca(NO2)2) (2) |
254 |
6.38 |
16.8 |
16.0 |
26.0 |
16.3 |
8.00 |
Bars with multiple coatings |
|||||||
MC (1) |
250 |
17.1 |
21.8 |
19.5 |
3.32 |
||
MC (2) |
254 |
28.9 |
23.8 |
28.7 |
8.24 |
22.4 |
9.75 |
1 ![]() m = 0.0394 mil
m = 0.0394 mil
Blank cells indicate that the test bar was not present.
a See table 1 for abbreviation definitions. All
epoxy-coated bars are penetrated with 16 surface holes.
b Based on top mat only.
c Excluded from average.
Control Specimens
As with the bench-scale tests, the control specimens for the
field tests consisted of conventional reinforcement and conventional ECR cast
in concrete without and with cracks. Due to the more realistic, milder exposure conditions obtained in the field, the
corrosion rates were about one-fourth those observed in the bench-scale
tests. The average corrosion losses based on exposed area for the control specimens without and with simulated
cracks over the top bars are shown in figure 117 over a period of 250 weeks. The losses for the conventional ECR
specimens are shown in figure 118. Uncracked specimens are denoted with
a "U" and cracked specimens are denoted with a "C" in the figures. The graphs show
that specimens with cracks began to corrode earlier and at a higher rate than
those with intact concrete and that the ECR bars corroded at a much slower rate
than conventional reinforcement. Based on total bar area, average losses at 250 weeks
ranged from 3.99 ![]() m (0.157 mil) for conventional
steel specimens with cracks and 1.86
m (0.157 mil) for conventional
steel specimens with cracks and 1.86 ![]() m (0.0732 mil) for conventional steel specimens without cracks to
less than 0.055
m (0.0732 mil) for conventional steel specimens without cracks to
less than 0.055 ![]() m (0.0022 mil) for ECR
specimens. Based on exposed area, the ECR specimens exhibited losses of 10.7
and 22.1
m (0.0022 mil) for ECR
specimens. Based on exposed area, the ECR specimens exhibited losses of 10.7
and 22.1 ![]() m (0.421 and 0.870 mil) at 250 weeks
for specimens without and with simulated cracks, respectively. As shown in figure 118, the specimens without
cracks exhibited negative corrosion between weeks 72 and 152, at which point
the net losses became positive. Based on the shape of the curve,
corrosion appears to have initiated, on average, at week 144. In contrast, the
specimens with simulated cracks exhibited corrosion initiation at week 76.
m (0.421 and 0.870 mil) at 250 weeks
for specimens without and with simulated cracks, respectively. As shown in figure 118, the specimens without
cracks exhibited negative corrosion between weeks 72 and 152, at which point
the net losses became positive. Based on the shape of the curve,
corrosion appears to have initiated, on average, at week 144. In contrast, the
specimens with simulated cracks exhibited corrosion initiation at week 76.
1 ![]() m = 0.0394 mil
m = 0.0394 mil
Figure 117. Graph. Field test, average corrosion loss based on total area for conventional reinforcement and ECR.
1 ![]() m = 0.0394 mil
m = 0.0394 mil
Figure 118. Graph. Field test, average corrosion loss based on exposed area for ECR.
The average corrosion potentials for the top and bottom bar mats are shown in figure 119 and figure 120, respectively, with the potentials cycling between high and low values as the moisture content and temperature conditions of the specimens varied. The top bars had average corrosion potentials more negative than -0.350 V with respect to a CSE with the exception of the ECR specimens without simulated cracks. As shown in figure 120, the corrosion potentials of the bars in the bottom mats remained above -0.350 V with the exception of the conventional steel specimens with cracks at week 112.
Figure 119. Graph. Field test, corrosion potential of top mat for conventional reinforcement and ECR.
Figure 120. Graph. Field test, corrosion potential of bottom mat for conventional reinforcement and ECR.
Epoxies with Improved Adhesion
The corrosion performance
of the bars with improved adhesion epoxies, ECR(Valspar), ECR(DuPont), and
ECR(Chromate), is compared to that of the conventional ECR in figure 121 and figure
122 based on exposed area for field test specimens without and with simulated
cracks, respectively. A comparison of the
two figures shows that the corrosion rate of the specimens with simulated
cracks was 3 to 5 times the value for specimens without cracks. The results
also indicate little difference in the performance of the specimens
based on average corrosion loss, although, as shown in table 24 through table 27,
significant scatter is evident between results for individual specimens for both uncracked and cracked
specimens. At 250 weeks, ECR(Valspar) exhibited the highest average
corrosion losses, 12.8 and 36.5 ![]() m (0.504 and 1.44 mil), while
ECR(DuPont) exhibited the lowest loss for uncracked specimens, 3.75
m (0.504 and 1.44 mil), while
ECR(DuPont) exhibited the lowest loss for uncracked specimens, 3.75 ![]() m (0.148 mil)
and ECR(Chromate) exhibited the lowest loss for cracked specimens, 20.1
m (0.148 mil)
and ECR(Chromate) exhibited the lowest loss for cracked specimens, 20.1 ![]() m (0.791 mil).
Considering the very low corrosion losses based on total bar area, however,
there is little practical difference in behavior as a function of the degree of adhesion between the epoxy coating and the
underlying steel. As observed for
the bench-scale specimens and in other studies, the results demonstrate that improved
performance in the cathodic disbondment test does not correlate with
improved corrosion performance.(16)
m (0.791 mil).
Considering the very low corrosion losses based on total bar area, however,
there is little practical difference in behavior as a function of the degree of adhesion between the epoxy coating and the
underlying steel. As observed for
the bench-scale specimens and in other studies, the results demonstrate that improved
performance in the cathodic disbondment test does not correlate with
improved corrosion performance.(16)
1 ![]() m = 0.0394 mil
m = 0.0394 mil
Figure 121. Graph. Field test, average corrosion losses based on area exposed at holes through coating for conventional and increased-adhesion ECR without simulated cracks.
1 ![]() m = 0.0394 mil
m = 0.0394 mil
Figure 122. Graph. Field test, average corrosion losses based on area exposed at holes through coating for conventional and increased-adhesion ECR with simulated cracks.
The average corrosion potentials for the top and bottom mats of reinforcement in specimens without cracks are shown in figure 123 and figure 124. None of the top bars exhibited a potential more negative than -0.350 V at any time during the test, and only one bottom mat, ECR(Chromate) at week 100, reached an average corrosion potential more negative than -0.350 V. In contrast, figure 125 and figure 126 show that all of the epoxy-coated bars in specimens with simulated cracks reached corrosion potentials more negative than -0.350 V by week 72. The corrosion potentials of the bottom mats of steel for the same specimens were generally more positive than -0.350 V, but at some point during the tests, all bottom mats reached average corrosion potentials below that value.
Figure 123. Graph. Field test, corrosion potential of top mat for conventional and increased-adhesion ECR without simulated cracks.
Figure 124. Graph. Field test, corrosion potential of bottom mat for conventional and increased-adhesion ECR without simulated cracks.
Figure 125. Graph. Field test, corrosion potential of top mat for conventional and increased-adhesion ECR with simulated cracks.
Figure 126. Graph. Field test, corrosion potential of bottom mat for conventional and increased-adhesion ECR with simulated cracks.
Overall, the corrosion potentials of the bottom and top mats of steel became progressively more positive during the last 50 weeks of the test, perhaps because the deposition of corrosion products at some of the penetrations limited access of oxygen and moisture. It is not clear that the changes in potential translated into a change in corrosion rate, although the corrosion rates (based on the slope of the corrosion loss curves) during the last 25 to 50 weeks are, in most cases, below the average rate of corrosion over the final 100 weeks of the test.
ECR Used in Conjunction with Corrosion Inhibitors
Average corrosion losses based on exposed area for conventional ECR cast in concrete without a corrosion inhibitor and cast in concrete with calcium nitrite, Rheocrete® 222+, and Hycrete™, as well as bars with microencapsulated calcium nitrite primer are shown in figure 127 and figure 128.
At 250 weeks for specimens
without simulated cracks, the ECR(HY) specimens exhibited the lowest average corrosion loss based on exposed
area, 8.2 ![]() m
(0.32 mil), while ECR(RH) exhibited the highest loss, 14.2
m
(0.32 mil), while ECR(RH) exhibited the highest loss, 14.2 ![]() m (0.559 mil).
Several bars exhibited negative corrosion values, with ECR(RH) exhibiting a negative
loss as late as week 172. Based on the slope of the corrosion loss curves,
however, it appears that all specimens were undergoing corrosion by week 124.
With the exception of specimens containing Hycrete™, the specimens containing
corrosion inhibitors exhibited chloride contents 1.5 to 2 times that exhibited
by the concrete in the specimens with conventional ECR (see table 23). The
difference is likely a function of the higher w/c ratios of the specimens
containing a corrosion inhibitor (see table 7).
m (0.559 mil).
Several bars exhibited negative corrosion values, with ECR(RH) exhibiting a negative
loss as late as week 172. Based on the slope of the corrosion loss curves,
however, it appears that all specimens were undergoing corrosion by week 124.
With the exception of specimens containing Hycrete™, the specimens containing
corrosion inhibitors exhibited chloride contents 1.5 to 2 times that exhibited
by the concrete in the specimens with conventional ECR (see table 23). The
difference is likely a function of the higher w/c ratios of the specimens
containing a corrosion inhibitor (see table 7).
As shown in figure 128,
the specimens with simulated cracks exhibited a wider range in corrosion loss than those without cracks. The ECR(HY)
specimens exhibited the lowest average corrosion loss at 250
weeks, 8.04 ![]() m (0.317 mil), based on
exposed area, followed by the ECR(primer/Ca(NO2)2) specimens
at 11.93
m (0.317 mil), based on
exposed area, followed by the ECR(primer/Ca(NO2)2) specimens
at 11.93 ![]() m
(0.4697 mil) (very close to the value observed in the ECR(primer/Ca(NO2)2) specimens without cracks) and then by the ECR,
ECR(DCI), and ECR(RH) specimens, with average losses of 22.1, 23.0, and 23.6
m
(0.4697 mil) (very close to the value observed in the ECR(primer/Ca(NO2)2) specimens without cracks) and then by the ECR,
ECR(DCI), and ECR(RH) specimens, with average losses of 22.1, 23.0, and 23.6 ![]() m (0.870, 0.906,
and 0.929 mil), respectively.
m (0.870, 0.906,
and 0.929 mil), respectively.
1 ![]() m = 0.0394 mil
m = 0.0394 mil
Figure 127. Graph. Field test, average corrosion losses based on area exposed at holes through coating for conventional ECR without and with corrosion inhibitors and without simulated cracks.
1 ![]() m = 0.0394 mil
m = 0.0394 mil
Figure 128. Graph. Field test, average corrosion losses based on area exposed at holes through coating for conventional ECR without and with corrosion inhibitors and with simulated cracks.
The corrosion potentials for specimens without simulated cracks are shown in figure 129 and figure 130, and the corrosion potentials for specimens with simulated cracks are shown in figure 131 and figure 132. For the specimens without simulated cracks, the corrosion potentials of the top mats of steel remained more positive than -0.350 V for ECR, ECR(DCI), ECR(HY), and ECR(RH) throughout the tests while dropping below -0.350 V for ECR(primer/Ca(NO2)2) for two readings during the 250-week test period. The corrosion potential of the bottom mat of reinforcement was more positive than -0.350 V in all cases. Once again, in contrast to uncracked concrete, the corrosion potentials in the top mats for all systems in specimens with simulated cracks were more negative than -0.350 V during the test. For the bottom mat, the corrosion potential was more negative than -0.350 V only for ECR(RH) and only between weeks 160 and 172.
Figure 129. Graph. Field test, corrosion potential of top mat for conventional ECR without and with corrosion inhibitors and without simulated cracks.
Figure 130. Graph. Field test, corrosion potential of bottom mat for conventional ECR without and with corrosion inhibitors and without simulated cracks.
Figure 131. Graph. Field test, corrosion potential of top mat for conventional ECR without and with corrosion inhibitors and with simulated cracks.
Figure 132. Graph. Field test, corrosion potential of bottom mat for conventional ECR without and with corrosion inhibitors and with simulated cracks.
Bars with Multiple Coatings
The corrosion losses for the bars with multiple coatings are compared
with those for conventional ECR in figure
133 and figure 134 for bars without and with simulated cracks over the
reinforcement, respectively. The hole through the coatings on the MC
bars in the field tests penetrated both the zinc
and the epoxy layers. Unlike the results observed for the bench-scale tests,
where the MC bars exhibited
significantly more corrosion than the conventional ECR bars, the corrosion
losses for the MC bars were slightly below those for the ECR bars in the field
test, with average corrosion losses at 250 weeks of 10.0 and 10.7 ![]() m (0.394 and
0.421 mil) for MC and ECR bars, respectively, in specimens without
cracks and 20.1 and 22.1
m (0.394 and
0.421 mil) for MC and ECR bars, respectively, in specimens without
cracks and 20.1 and 22.1 ![]() m (0.791 and 0.870 mil), respectively, for MC and ECR bars in specimens with simulated cracks over
the bars. The relative behavior of the MC bars in the field and
bench-scale tests suggests that MC reinforcement performs much like
conventional ECR under exposure conditions similar to those in bridge decks,
even providing an advantage since the
initial losses represent corrosion of the zinc coating rather than the
underlying steel, but will provide no significant advantage in cases
where the concrete is often saturated, such as in marine environments.
m (0.791 and 0.870 mil), respectively, for MC and ECR bars in specimens with simulated cracks over
the bars. The relative behavior of the MC bars in the field and
bench-scale tests suggests that MC reinforcement performs much like
conventional ECR under exposure conditions similar to those in bridge decks,
even providing an advantage since the
initial losses represent corrosion of the zinc coating rather than the
underlying steel, but will provide no significant advantage in cases
where the concrete is often saturated, such as in marine environments.
Figure 133. Graph. Field test, average corrosion losses based on area exposed at holes through coating for conventional ECR and MC reinforcement without simulated cracks.
1 ![]() m = 0.0394
mil
m = 0.0394
mil
Figure 134. Graph. Field test, average corrosion losses based on area exposed at holes through coating for conventional ECR and MC reinforcement with simulated cracks.
The corrosion potentials for specimens without and with cracks are shown in figure 135 through figure 138. The corrosion potentials were initially more negative than -0.350 V for the top mats of steel for MC bars in specimens both without and with simulated cracks and somewhat more negative (-0.500 V) for specimens with cracks than those without cracks (-0.400 V).
Figure 135. Graph. Field test, corrosion potential of top mat for conventional ECR without and with corrosion inhibitors and without simulated cracks.
Figure 136. Graph. Field test, corrosion potential of bottom mat for conventional ECR without and with corrosion inhibitors and without simulated cracks.
Figure 137. Graph. Field test, corrosion potential of top mat for conventional ECR without and with corrosion inhibitors and with simulated cracks.
Figure 138. Graph. Field test, corrosion potential of bottom mat for conventional ECR without and with corrosion inhibitors and with simulated cracks.
The top mat corrosion potential for specimens both without and with cracks became more positive toward the end of tests, reaching values in the range of -0.300 to -0.350 V. The corrosion potential of the bottom mats of steel started close to -0.350 V for specimens both without and with simulated cracks, rising to values more positive than -0.150 V by the end of the 250-week test. This behavior suggests that the zinc exposed at the penetrations through the coating dominated the behavior early in the test, but the effect diminished by the end of the test period, with the underlying steel dominating the behavior of the bottom mat.
The average corrosion rates based on losses after corrosion initiation are summarized in table 28 and table 29 for field test specimens without and with simulated cracks, respectively. The rates are expressed in terms of total area for bars without coatings and in terms of exposed area for bars with coatings. The rates shown in the tables provide a good representation of corrosion rates expected in bridge decks because both the exposure conditions and structural design of the specimens closely match those of bridge decks in Kansas.
Table 28. Average corrosion rate (![]() m/year)
based on losses after corrosion initiation for field test specimens without
simulated cracks.
m/year)
based on losses after corrosion initiation for field test specimens without
simulated cracks.
| Steel Designationa | Specimen | Bar | Average | Standard Deviation | |||
|---|---|---|---|---|---|---|---|
| 1 | 2 | 3 | 4 | ||||
Bars without coatings-corrosion rate based on total area |
|||||||
Controls |
|||||||
Conv. |
1 |
1.55 |
0.77 |
0.882 |
0.62 |
||
2 |
b |
0.322 |
|||||
Bars with coatings-corrosion rate based on exposed area |
|||||||
Controls |
|||||||
ECR |
1 |
9.86 |
10.1 |
5.68 |
4.21 |
||
2 |
0.587 |
4.90 |
b |
2.97 |
|||
Bars with increased adhesion |
|||||||
ECR(Chromate) |
1 |
4.86 |
2.50 |
4.83 |
3.35 |
||
2 |
10.4 |
b |
1.97 |
4.40 |
|||
ECR(DuPont) |
1 |
5.35 |
2.95 |
5.14 |
5.99 |
||
2 |
0.710 |
5.35 |
1.41 |
17.0 |
|||
ECR(Valspar) |
1 |
2.38 |
9.77 |
9.11 |
4.90 |
||
2 |
15.0 |
b |
12.0 |
6.39 |
|||
Corrosion inhibitors in concrete |
|||||||
ECR(DCI) |
1 |
3.58 |
3.69 |
1.64 |
2.73 |
4.26 |
2.81 |
2 |
6.62 |
10.3 |
4.95 |
1.41 |
|||
3 |
4.47 |
7.86 |
0.904 |
2.96 |
|||
ECR(RH) |
1 |
10.2 |
5.24 |
6.49 |
3.97 |
5.43 |
3.68 |
2 |
1.49 |
0.856 |
b |
9.72 |
|||
ECR(HY) |
1 |
1.82 |
b |
1.75 |
6.09 |
2.89 |
1.62 |
2 |
1.52 |
3.74 |
3.11 |
2.18 |
|||
ECR(primer/Ca(NO2)2) |
1 |
b |
1.89 |
4.25 |
2.60 |
4.49 |
2.95 |
2 |
10.3 |
3.78 |
2.36 |
6.22 |
|||
Bars with multiple coatings |
|||||||
MC |
1 |
5.54 |
6.58 |
6.31 |
3.39 |
||
2 |
11.9 |
6.35 |
1.29 |
6.68 |
|||
1 ![]() m = 0.0394 mil
m = 0.0394 mil
Blank cells indicate that the test bar was not present.
a See table 1 for abbreviation definitions.
b No corrosion observed.
Table 29. Average corrosion rate (![]() m/year) based on losses
after corrosion initiation for field test specimens with simulated cracks.
m/year) based on losses
after corrosion initiation for field test specimens with simulated cracks.
Steel Designationa |
Specimen |
Bar |
Average |
Standard Deviation |
|||
|---|---|---|---|---|---|---|---|
1 |
2 |
3 |
4 |
||||
Bars without coatings-corrosion rate based on total area |
|||||||
Controls |
|||||||
Conv. |
1 |
0.482 |
1.65 |
0.939 |
0.61 |
||
2 |
0.897 |
0.731 |
|||||
Bars with coatings-corrosion rate based on exposed area |
|||||||
Controls |
|||||||
ECR |
1 |
2.91 |
10.3 |
8.13 |
7.82 |
||
2 |
5.76 |
22.6 |
4.58 |
5.72 |
|||
Bars with increased adhesion |
|||||||
ECR(Chromate) |
1 |
5.06 |
5.79 |
8.94 |
8.65 |
||
2 |
25.6 |
6.43 |
6.31 |
11.4 |
|||
ECR(DuPont) |
1 |
3.79 |
5.72 |
6.50 |
4.05 |
||
2 |
10.8 |
2.30 |
12.8 |
7.10 |
|||
ECR(Valspar) |
1 |
3.76 |
11.6 |
7.64 |
4.93 |
||
2 |
7.19 |
16.5 |
8.46 |
1.99 |
|||
Corrosion inhibitors in concrete |
|||||||
ECR(DCI) |
1 |
3.20 |
4.97 |
8.67 |
8.22 |
5.79 |
3.60 |
2 |
1.62 |
10.1 |
7.52 |
5.51 |
|||
3 |
0.634 |
0.500 |
7.95 |
10.6 |
|||
ECR(RH) |
1 |
9.92 |
8.34 |
6.07 |
7.74 |
8.38 |
1.64 |
2 |
11.2 |
8.38 |
7.68 |
7.78 |
|||
ECR(HY) |
1 |
6.12 |
2.06 |
12.0 |
b |
4.32 |
4.31 |
2 |
2.12 |
2.28 |
b |
1.36 |
|||
ECR(primer/Ca(NO2)2) |
1 |
9.28 |
2.22 |
4.75 |
b |
4.65 |
2.13 |
2 |
1.78 |
4.25 |
3.90 |
6.40 |
|||
Bars with multiple coatings |
|||||||
MC |
1 |
5.64 |
10.9 |
8.11 |
5.29 |
||
2 |
1.47 |
5.89 |
6.40 |
14.2 |
|||
1 ![]() m = 0.0394 mil
m = 0.0394 mil
Blank cells indicate that the test bar was not present.
a See table 1 for abbreviation definitions.
b No corrosion observed.
The average mat-to-mat resistance results for the field test specimens are shown in figure 139 though figure 145. Uncracked specimens are denoted with a "U" and cracked specimens are denoted with a "C" in the figures. As observed in figure 53 for the southern exposure specimens, the high resistance provided by the epoxy coating was also apparent for the field test specimens, as shown in figure 139, which compares mat-to-mat resistance for conventional reinforcement and conventional ECR in specimens without and with simulated cracks. The highest resistances were exhibited by ECR in concrete containing corrosion inhibitors Rheocrete® and Hycrete™, as shown in figure 142 and figure 143.
Figure 139. Graph. Field test, mat-to-mat resistance for conventional reinforcement and ECR.
Figure 140. Graph. Field test, mat-to-mat resistance for conventional and increased-adhesion ECR without simulated cracks.
Figure 141. Graph. Field test, mat-to-mat resistance for conventional and increased-adhesion ECR with simulated cracks.
Figure 142. Graph. Field test, mat-to-mat resistance for conventional ECR without and with corrosion inhibitors and without simulated cracks.
Figure 143. Graph. Field test, mat-to-mat resistance for conventional ECR without and with corrosion inhibitors and with simulated cracks.
Figure 144. Graph. Field test, mat-to-mat resistance for conventional ECR and MC reinforcement without simulated cracks.
Figure 145. Graph. Field test, mat-to-mat resistance for conventional ECR and MC reinforcement with simulated cracks.
For all bar types, the mat-to-mat resistance rose over time, reached a peak, and then declined or, in a few cases, leveled off. The times at which each bar type reached the peak resistance differ, but a similarity between resistances in specimens without and with cracks for the same bar type is clear. Causes for the decrease in the resistance may include deterioration of concrete, increase in ionic conductivity resulting from the increased chloride content, and for the coated bars systems, disbondment or other damage to the coating. The figures illustrating corrosion loss versus time for the field test specimens indicate little change in the corrosion rates in the latter stages of the tests, suggesting that decreases in mat-to-mat resistance or any damage accompanying the decreases did not result in an increase in corrosion rate for these specimens.
At the conclusion of the field tests at 250 or 254 weeks, specimens were evaluated for staining and cracking and autopsied to evaluate the nature of any corrosion on the reinforcing steel following the same procedures used for the southern exposure and cracked beam specimens. Epoxy-coated bars were evaluated for disbondment. As previously described, specimens in batches 3 through 9 were cored to measure the chloride content at the end of the tests.
The specimens both without and with simulated cracks
containing conventional reinforcing steel exhibited staining and cracking of
the concrete, as shown in figure 146 through figure 149. The age at crack
initiation for each bar instrumented to measure corrosion was estimated from
photos of each specimen taken approximately annually beginning at the third
year of testing. The age at cracking was assumed to be the average of the
specimen age in the last photograph where no cracking was observed above the
test bar and the specimen age in the first photograph where cracking was observed.
The values for the four field test specimens containing conventional steel are
listed in table
30. Also, as shown in the figures, the cracks were primarily parallel to the top reinforcing bars. This
cracking occurred in spite of the fact that the average macrocell corrosion loss did
not exceed 6.7 ![]() m (0.26 mil) on any individual
bar, a value that is below 25
m (0.26 mil) on any individual
bar, a value that is below 25 ![]() m (0.98 mil), the corrosion loss typically needed to crack
concrete with 25 mm (1 inch) of cover over the reinforcing
steel.(44) An explanation is provided for conventional steel specimens without and with simulated cracks in figure
150 and figure 151, which show that
some of the top bars had corrosion losses well above 25
m (0.98 mil), the corrosion loss typically needed to crack
concrete with 25 mm (1 inch) of cover over the reinforcing
steel.(44) An explanation is provided for conventional steel specimens without and with simulated cracks in figure
150 and figure 151, which show that
some of the top bars had corrosion losses well above 25 ![]() m (0.98 mil)
and that the corrosion products were not uniformly distributed over the surface of the bars. In reference to the latter
point, a visual inspection of the conventional reinforcement from the field
test specimens at the end of testing indicated that corrosion covered only
about one-third of the total of bar area in uncracked concrete and about
40 percent of the total bar area in cracked concrete. Thus, although the
average corrosion losses based on macrocell corrosion remained well below 25
m (0.98 mil)
and that the corrosion products were not uniformly distributed over the surface of the bars. In reference to the latter
point, a visual inspection of the conventional reinforcement from the field
test specimens at the end of testing indicated that corrosion covered only
about one-third of the total of bar area in uncracked concrete and about
40 percent of the total bar area in cracked concrete. Thus, although the
average corrosion losses based on macrocell corrosion remained well below 25 ![]() m
(0.98 mil), enough of the bar
surface underwent corrosion adequate to crack the concrete. In addition, the
losses given in table 24 and table 26 represent macrocell losses rather than
total losses, which, as discussed with the linear polarization resistance
results for the bench-scale tests, are several times greater than the macrocell
losses. This information is used in chapter 4 to estimate the time to cracking
on bridge decks. As illustrated in figure 152 and figure 153, none of the field test specimens containing coated
reinforcement exhibited cracking of the concrete.
m
(0.98 mil), enough of the bar
surface underwent corrosion adequate to crack the concrete. In addition, the
losses given in table 24 and table 26 represent macrocell losses rather than
total losses, which, as discussed with the linear polarization resistance
results for the bench-scale tests, are several times greater than the macrocell
losses. This information is used in chapter 4 to estimate the time to cracking
on bridge decks. As illustrated in figure 152 and figure 153, none of the field test specimens containing coated
reinforcement exhibited cracking of the concrete.
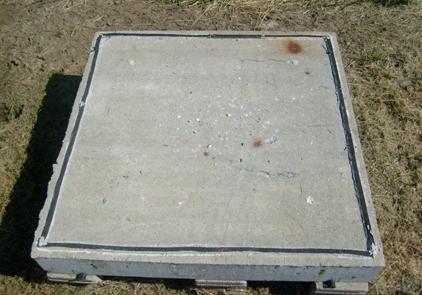
Figure 146. Photo. Field test specimen without simulated cracks containing conventional reinforcing steel at 250 weeks.
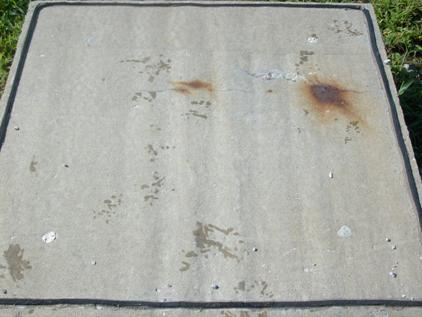
Figure 147. Photo. Field test specimen without simulated cracks containing conventional reinforcing steel at 254 weeks.
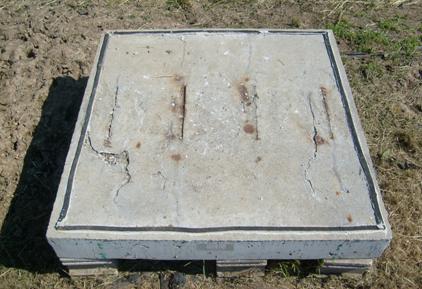
Figure 148. Photo. Field test specimen with simulated cracks containing conventional reinforcing steel at 250 weeks.
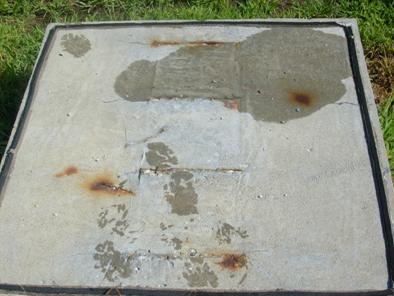
Figure 149. Photo. Field test specimen with simulated cracks containing conventional reinforcing steel at 254 weeks.
Table 30. Estimated time to cracking for instrumented bars on field test specimens containing conventional steel.
| Specimen-Bara | Estimated Time to Cracking (weeks) |
|---|---|
Conv. (1)-U-1 |
227 |
Conv. (1)-U-2 |
183 |
Conv. (2)-U-1b |
- |
Conv. (2)-U-2 |
222 |
Conv. (1)-C-1 |
227 |
Conv. (1)-C-2c |
- |
Conv. (2)-C-1 |
171 |
Conv. (2)-C-2 |
171 |
a Number in parentheses is specimen
number (U = specimen without simulated cracks; C = specimen with simulated
cracks; final number is bar number.)
b No cracking observed.
c Cracking occurred prior to first photo.
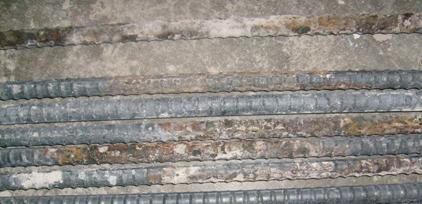
Figure 150. Photo. Top bars from field test specimen without simulated cracks containing conventional reinforcing steel at 254 weeks.
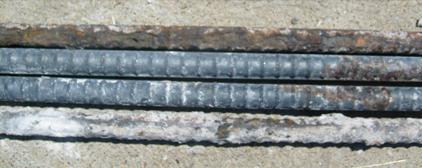
Figure 151. Photo. Top bars from field test specimen with simulated cracks containing conventional reinforcing steel at 250 weeks.
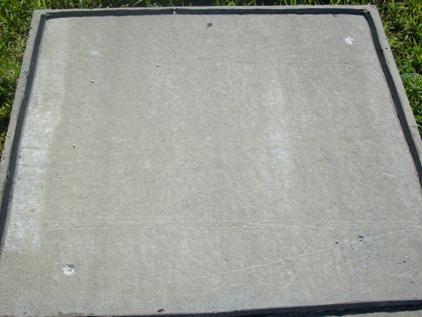
Figure 152. Photo. Field test specimen without simulated cracks containing conventional epoxy-coated steel at 254 weeks.
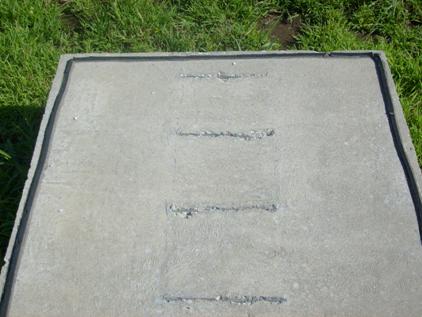
Figure 153. Photo. Field test specimen with simulated cracks containing conventional epoxy-coated steel at 254 weeks.
The only other observation of interest relative to the appearance of the concrete deals with the specimens cast with corrosion inhibitor Hycrete™. Those specimens uniformly exhibited scaling of the upper surface for specimens both without and with simulated cracks, as shown in figure 154 and figure 155. This result suggests that additional work is needed to establish criteria to preclude a loss of durability when Hycrete is used.
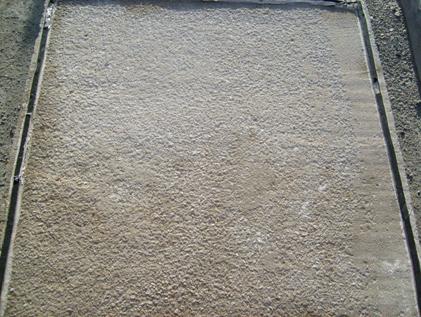
Figure 154. Photo. Field test specimen without simulated cracks containing conventional ECR and Hycrete™ corrosion inhibitor at 250 weeks.
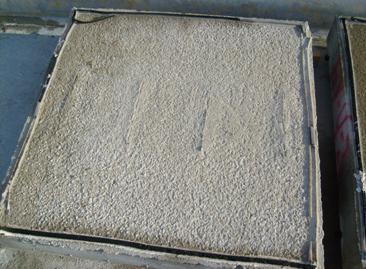
Figure 155. Photo. Field test specimen with simulated cracks containing conventional ECR and Hycrete™ corrosion inhibitor at 254 weeks.
All bars were removed from the specimens, and the outermost epoxy-coated bars were evaluated for disbondment, including all top and bottom bars in specimens without cracks and all electrically connected top and bottom bars in specimens with cracks. Disbondment was checked at two points on the upper side of each bar using the procedures described for the bench-scale specimens. In the description that follows, bars that were electrically connected between the top and bottom mats are distinguished from those that were electrically isolated.
Figure 156 and figure 157 show bars following the disbondment tests. Figure 156 shows bars coated with conventional reinforcement cast in concrete containing Rheocrete®, and figure 157 shows bars coated with the high-adhesion DuPont™ coating. The figures are typical of observations made in the field test specimens for all types of ECR and demonstrate that corrosion occurred both at the points where the epoxy was penetrated and under the epoxy coating. Figure 158 shows disbondment results for an MC bar, with a loss of the zinc coating under the epoxy and subsequent corrosion of the steel.
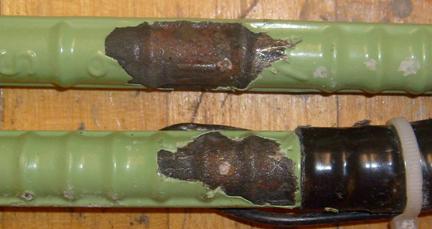
Figure 156. Photo. Conventional epoxy-coated top bars from field test specimen containing Rheocrete® 222+ corrosion inhibitor without simulated cracks after 254 weeks.
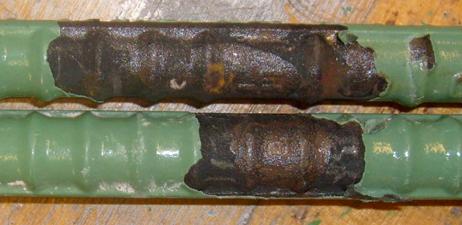
Figure 157. Photo. High adhesion DuPont™ epoxy-coated top bars from field test specimen with simulated cracks after 250 weeks.
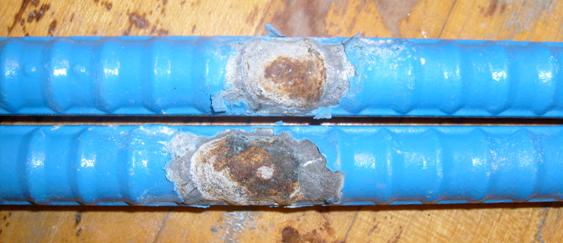
Figure 158. Photo. MC top bars from field test specimen with simulated cracks after 250 weeks.
The average values of disbondment for the electrically connected top and bottom bars for specimens without and with simulated cracks over the reinforcement are shown in figure 159 and figure 160, respectively. For specimens without cracks, the average values of disbondment for individual specimens with the same corrosion protection systems were quite similar in a number of cases and quite different in others. Specifically, conventional ECR, ECR(HY), ECR(Valspar), ECR(DuPont), and ECR(Chromate) exhibited low values of disbondment for the top bars for both specimens. In contrast, ECR(primer/Ca(NO2)2), ECR(DCI), ECR(RH), and MC bars exhibited significantly higher disbondment for some but not all of the specimens. The scatter is, in all likelihood, typical of what would be observed in bridge decks. ECR(primer/Ca/NO2)2 specimens 1 and 2 and ECR specimen 2 exhibited the highest disbondment among bottom bars, at 127, 102, and 110 mm2 (0.20, 0.16, and 0.17 in2), respectively, but the bottom bars in most specimens exhibited significantly less disbondment and, in many cases, no disbondment was observed.
1 mm2 = 0.00155 in2
Figure 159. Graph. Disbondment results for electrically connected bars in field test specimens without simulated cracks.
1 mm2 = 0.00155 in2
Figure 160. Graph. Disbondment results for electrically connected bars in field test specimens with simulated cracks.
Figure 160 shows that, as with the cracked beam specimens, the field test specimens with simulated cracks over the reinforcement exhibited significantly more disbondment than the specimens without simulated cracks. All specimens had average top bar disbondment values in excess of 317 mm2 (0.49 in2), and all groups except conventional ECR and ECR(primer/Ca/NO2)2 had at least one specimen with average disbondment in excess of 606 mm2 (0.94 in2). One specimen for ECR(DCI), ECR(RH), ECR(Valspar), and ECR(DuPont) and both bars for ECR(HY) exhibited total disbondment of the top bars. As observed in the cracked beam specimens, MC reinforcement exhibited very low disbondment on the bottom mat of steel.
Figure 161 compares the disbondment for top bars in specimens without cracks that are electrically connected with adjacent bars that are electrically isolated. Without exception, the electrically isolated bars exhibited less disbondment and, in most cases, much less disbondment than the bars that were electrically connected. This bodes well for ECR because epoxy-coated bars are electrically isolated in the vast majority of cases in bridge decks.
As observed with respect to the drop in mat-to-mat resistance toward the end of the test period, disbondment does not appear to have affected the corrosion rate of the field test specimens.
1 mm2 = 0.00155 in2
Figure 161. Graph. Comparison of disbondment values for electrically connected and electrically isolated bars in field test specimens without simulated cracks.

