U.S. Department of Transportation
Federal Highway Administration
1200 New Jersey Avenue, SE
Washington, DC 20590
202-366-4000
Federal Highway Administration Research and Technology
Coordinating, Developing, and Delivering Highway Transportation Innovations
| REPORT |
| This report is an archived publication and may contain dated technical, contact, and link information |
| Publication Number: FHWA-HRT-12-022 Date: May 2012 |
Publication Number: FHWA-HRT-12-022 Date: May 2012 |
Scour mechanisms have been frequently studied, including by Ettema, Dargahi, Roulund et al., Zhao and Huhe, Dey and Raikar, Unger and Hager, Kirkil et al., and Veerappadevaru et al. (See references 21–30.) Since pressure gradient is responsible for all flow and scour phenomena (including bed shear stress) around piers, this section qualitatively explains scour mechanisms in terms of pressure gradient through the flow-structure interaction, the flow-sediment interaction, and the sediment-structure interaction.
Flow interacts with a pier in multiple ways. First, a vertical stagnation flow is divided into an up‑flow and down-flow jet on the leading face of the pier, as shown in figure 18. Point 1 is the stagnation point between the up-flow and down-flow jets. It is defined as the point of maximum energy from the approach flow at the pier face. Energy at the pier face is the sum of the hydrostatic and kinetic components at any given depth of the approach flow. The down-flow component is directed to the bed. The up-flow component moves toward the level of the approach flow water surface (point 2) and creates a bore wave that increases the water surface elevation at the face of the pier to point 3.
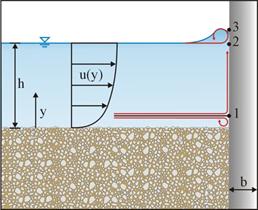
Figure 18. Illustration. Side view of flow-structure interactions in initial scour phase.
In shallow water, the hydrostatic component of the total energy at the pier face is small compared to the kinetic component, resulting in a stagnation point near the water surface and a significant down-flow jet. Scour under this condition is called “shallow water scour.” In deep water, the hydrostatic component is greater and, when combined with the kinetic component, tends to create a much more even pressure field at the face of the pier, with the stagnation point closer to the bed and milder up-flow and down-flow jets. Scour under this condition is more weakly related to depth and is called “deep water scour.” The scour mechanism treated in this research is intermediate to these extremes.
The second interaction between the structure and the flow field is the creation of two boundary layer flows along the upstream pier perimeter, as shown in figure 19. Assuming the boundary layer flows are fully developed, pressure can be approximated by Bernoulli's equation.
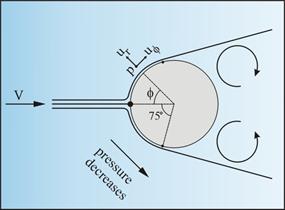
Figure 19. Illustration. Plan view of flow-structure interactions in initial scour phase.
Applying Prandtl's boundary layer theory in conjunction with Bernoulli's equation provides the equation shown in figure 20, as given by Julien.(31)
![]()
Figure 20. Equation. Bernoulli equation with Prandtl boundary layer theory.
Where:
γ = Water specific weight, lb/ft3.
y = Distance from bed, ft.
p = Pressure, lb/ft2.
ρ = Density of water, slug/ft3.
ur = Potential velocity in the radial direction, ft/s.
uø = Potential velocity in the tangential direction, ft/s .
The radial and tangential velocities are given in figure 21 and figure 22, respectively.
![]()
Figure 21. Equation. Radial velocity.
![]()
Figure 22. Equation. Tangential velocity.
Where:
u(y) = Approach velocity at depth, y, ft/s.
Ø = Angle from the leading edge.
R = Radius of pier, ft.
r = Distance from the pier center (r > R), ft.
Inserting the equations in figure 21 and figure 22 into the equation in figure 20 and simplifying results in the equation in figure 23.
![]()
Figure 23. Equation. Modified Bernoulli equation.
Further modification to solve for pressure gradient in the ø-direction results in figure 24.
![]()
Figure 24. Equation. Pressure gradient.
The result indicates that ∂p/∂ø ≤ 0 for 0 degrees ≤ ø ≤ 90 degrees, or the flow-structure interaction results in a favorable pressure gradient in the ø -direction in the upstream region of the pier. Note that when applying the equation in figure 24 to beds, a slipping velocity or a theoretical bed is applied so that velocity distribution, u, ≠ 0 ft/s.
The equation in figure 24 is used to describe scour initiation and bed shear stress around piers. First, the pressure gradient is zero at the stagnation point where ø = 0 degrees and r = R, meaning that no sediments move downstream at the leading edge at the beginning of scour if the asymmetrical shape of natural sediments is neglected. Second, the maximum pressure gradient occurs at ø = ±45 degrees and r = R, meaning that scour begins in the upstream flanks of the pier.
This analysis qualitatively agrees with literature data. Hjorth observed that at ø = 45 degrees, the maximum bed shear stress occurs, which corresponds to the maximum pressure gradient if momentum conservation is considered.(32) Dargahi observed that the scouring begins after 25 s at either side of the cylinder at about ±45 degrees.(23) Roulund et al. calculated that at ø = 45–70 degrees, the maximum bed shear stress occurs.(24) Furthermore, Unger and Hager reported that scour starts at ø = 75 degrees, which is within the range described by White for laminar separation points ø = 71–83 degrees), where pressure suddenly changes to result in the maximum pressure gradient on the flow line.(27,33)
At the separation points, vortex shedding occurs, forming a wake flow region. The wake flow region is filled with vortices governed by the conservation of vorticity, as described by Kundu and shown in figure 25.(34)
![]()
Figure 25. Equation. Conservation of vorticity.
Where:
D/Dt = Material derivative.
Ω = Vorticity vector, s-1.
∇2 = Laplace operator.
∇ = Vector differential operator.
u = Velocity vector, ft/s.
ν = Kinematic viscosity, ft/s2.
The first term on the right side represents the rate of change of vorticity due to stretching and tilting of vortex lines (or tubes). The second term represents the rate of change due to diffusion of vorticities. As shown in figure 26, after parent vortices are created by vortex shedding, the velocity gradients in the three directions stretch and tilt the vortex lines so that the fluid particles spin faster (a ballerina effect) downstream and upward. Bernoulli's equation states that pressure decreases as velocity increases, so pressure in the wake region decreases downstream and upward. In other words, favorable pressure gradients form near the downstream of the pier and along a vortex line upward, immediately moving sediments downstream through bed load and suspended load. This is confirmed by Dargahi's observation that the first scour appears in the wake of the cylinder.(23)
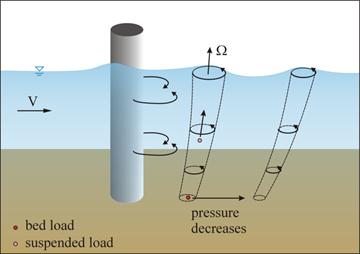
Figure 26. Illustration. Vortex processes in wake flow region.
The vertical stagnation flow is interpreted by the equation in figure 20. Referring to figure 18, Bernoulli's equation between the approach flow (ø = 0, r = ∝) and the pier leading edge (ø = 0, r = R) is shown in figure 27.
![]()
Figure 27. Equation. Application of Bernoulli's equation.
This reduces to the equation in figure 28 as follows:
![]()
Figure 28. Equation. Reduction of Bernoulli equation.
Further simplification is achieved when velocity distribution, u, is approximated by the one-seventh power law, as shown in figure 29.
![]()
Figure 29. Equation. 1/7th power law.
Substituting the equation in figure 29 into the equation in figure 28 yields a revised relation for the pressure, as shown in figure 30 as follows:

Figure 30. Equation. Stagnation point pressure.
At the stagnation point, the maximum pressure is experienced (∂p/∂y = 0), and the ratio of the depth in the flow field, y, to the total approach depth, h, is given by a function of the Froude number, F, as seen in figure 31 as follows:
![]()
Figure 31. Equation. Ratio for stagnation depth.
If the Froude number equals 0.5, the stagnation point ratio, y/h, is approximately equal to 1 percent, meaning that the stagnation point (point 1 in figure 18) is close to the bed and that only a small part of the approach flow contributes to the down-flow jet in the scour initiation. A large part turns up, forming the up-flow jet and the backwater surface (bore) wave. Near the water surface, the flow moves from point 2 to 3 because pressure at point 2 from the equation in figure 28 is larger than that at point 3 (atmospheric pressure).
The flow-sediment interaction results from the flow-structure interaction, where pressure gradient determines sediment movement. When the down-flow jet impacts the sediment bed, another stagnation point occurs where the maximum pressure deflects water to upstream of the pier, forming a micro-horseshoe vortex (see figure 18). Unger and Hager observed that such a vortex is usually too weak to initiate scour.(27) Note that this stagnation flow does not return to the perimeter initially because ∂p/∂ø = 0, as determined from the equation in figure 24.
Referring to figure 32, once scour begins at ø = 45–75 degrees, a series of events is set in motion. The favorable pressure gradient along the perimeter of the pier pushes the adjacent sediment downstream so that scour grows backward to the stagnation point from both sides. Meanwhile, the favorable pressure gradient resulting from the tornado-like vortices pushes wake region sediment downstream through the bed and suspended load, as shown in figure 26, to a low pressure zone where large vortices are broken into small eddies by viscosity resulting in deposition (see figure 32). The decay of the vortices into small eddies is represented by the second term in the equation in figure 25. A scour ring results around the pier to trap the micro-horseshoe vortex that is divided in two along the perimeter. The combination of the horseshoe vortices and the favorable pressure gradient in the ring accelerates scour development. Simultaneously, the combination of the horseshoe vortex and the shedding vortices enhances the scour and transport potential in the wake region.
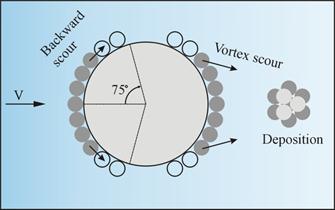
Figure 32. Illustration. Plan view of initial scour phase.
As the scour hole grows, the approach velocity profile is redistributed, as shown in figure 33, so that stagnation point 1 on the pier's leading face shifts up.(27) As a result, the down-flow jet becomes stronger, as do the horseshoe vortices, causing a rapidly (logarithmically) accelerating scour process. (See references 12, 13, and 21–23.) Once the stagnation point on the leading face moves sufficiently close to the water surface, the down-flow jet and horseshoe vortices stabilize. Further scour potential is reduced until an equilibrium scour hole is attained in the form of an inverted frustum, with the upstream side slope approximating the sediment static repose angle and the maximum scour depth at the front face of the pier. Determination of the precise location of the stagnation point requires accurate approach velocity profiles and streamline equations, which are beyond the scope of this qualitative analysis.
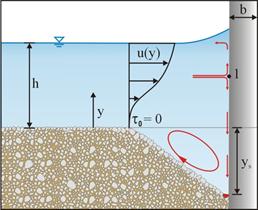
Figure 33. Illustration. Side view of equilibrium phase of scour.
The sediment-structure interaction is analyzed by considering hydrodynamic forces on individual particles. For qualitative analysis, it is assumed that the feedback of sediment particles on the flow and pressure fields is neglected, and the average pressure difference between the upstream and downstream surface is considered. Figure 34 shows the definition sketch for this analysis.
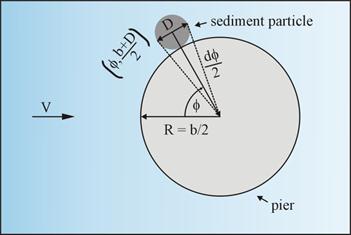
Figure 34. Illustration. Hydrodynamic force of sediment particle.
For a sediment particle located at [ø, (b + D/2] (with D representing the sediment size), the pressure gradient at the center of the particle is given by application of the equation in figure 24, resulting in the equation in figure 35.
![]()
Figure 35. Equation. Pressure gradient at particle.
This relationship indicates that for a given pier diameter, b, pressure gradient decreases with increasing D. For very large values of D or for particles located far from the pier, no pressure gradient exists, and, therefore, no scour occurs. Approximating dø = D [(b + D/2], the pressure difference between the upstream and downstream face is given by the equation in figure 36.
![]()
Figure 36. Equation. Pressure difference.
The hydrodynamic force, F, on a particle is then approximated by the equation in figure 37.
![]()
Figure 37. Equation. Hydrodynamic force.
The negative sign is used to indicate a favorable pressure gradient for scour. Given D, F increases with b, meaning scour increases with b. Considering that the sediment submerged weight (W = (ρs - ρ)gπD3/6)resists scour, the local scour potential is described as shown in figure 38.
![]()
Figure 38. Equation. Scour potential.
Here, u ∝ V was used, and D/b represents the sediment-structure interaction. The equation in figure 38 establishes that the ratio D/b affects scour in the pier flanks where Ø ≠ 0. However, the effect of D/b can be neglected in practice because D/b << 1, as shown in previous research.(11)
The equation in figure 38 also establishes that D/b does not affect the scour depth at the leading face where Ø = 0. This observation does not support the use of f3 in the equation in figure 10. Therefore, the equation in figure 17 is simplified to the equation in figure 39.
![]()
Figure 39. Equation. Scour depth scale relation.
In summary, the following apply along the perimeter of the pier:
The flow-sediment-structure interaction provides a framework for understanding complex three-dimensional (3D) scour processes. If the primary concern is the equilibrium scour depth at the leading edge of the pier, the problem is simplified. As shown in figure 33, the flow collides with the leading face of the pier and generates a down-flow jet. The scour depth, ys, increases with the area blocking the flow as shown in figure 40, where α represents a positive exponent.
![]()
Figure 40. Equation. Scour depth and blocking area.
The equation in figure 40 implies that ys = 0 ft if bh = 0 ft, which is physically reasonable.
Analyzing equilibrium scour depth as a balancing of forces the down-flow jet with velocity, Vj, applies a lateral hydrodynamic force (Fl ∝ρVj2Dj2 to the sediment Dj (see figure 41). This force, similar to lift, results from the pressure over the asymmetrical surface of natural sediments and drives the sediment to move, while the submerged sediment weight, W, resists scour through friction, Ff∝W .
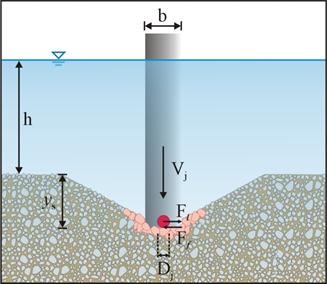
Figure 41. Illustration. Upstream view of equilibrium scour.
Here, Vj ∝ V was used. This equation is similar to the equation in figure 38 but results from the down-flow jet.
Experiments reported by Richardson and Davis showed that Dj is approximately D90 sediment size where 90 percent of the sediment is finer by weight.(2) Since represents (D84/D16)0.5, σ2 can be said to equal (D84/D50)(D50/D16). Assuming a gradation (partially based on the log-normal distribution) where (D84/D50) = (D50/D16) = (D95/D84), then D84 = σD50 and D95 = σ2D50. D90 may then be approximated as σ3/2D50. The previous equation then becomes the equation shown in figure 42.
![]()
Figure 42. Equation. Relative force strength with D50.
This implies the existence of the relationship shown in figure 43.

Figure 43. Equation. Scour depth.
Combining the equations in figure 40 and figure 43 yields the equation in figure 44.

Figure 44. Equation. Scour depth with scaling parameter.
To achieve dimensional homogeneity, the exponent, α, must be 0.5, as shown in figure 45.

Figure 45. Equation. Dimensionless scour depth.
This relationship defines the scaling factor for scour depth as the square root of the product of pier diameter and approach flow depth consistent with the equations in figure 17 and figure 39, with λ = 0.5. It also defines the dimensionless scour depth as a function of H and σ, consistent with the equation in figure 9.
The hyperbolic tangent function is selected, as it was for the equation in figure 12, to represent the function shown in figure 46.

Figure 46. Equation. Dimensionless pier scour.
Where:
Hcp = Critical Hager number for pier scour.
σcp = Non-uniformity coefficient for Hcp.
Implicit in the development of the critical Hager number is the assumption of uniform sediments so that σcp = 1. According to Hager and Oliveto, Hcp is determined by the equation in figure 47.(18)

Figure 47. Equation. Critical Hager number for pier scour.
Where:
B = Channel width, ft.
Hc = Critical particle Hager number based on the Shields diagram.
The critical particle Hager number is estimated from figure 48.

Figure 48. Equation. Critical particle Hager number.
Where:
D* = Dimensionless sediment size defined as [(ρs/ρ - 1) · g/ν2]1/3·D50.
Rh = Hydraulic radius, ft.
For a small Hager number (H) or weak a scour, the equation in figure 46 is approximated by the equation in figure 49.

Figure 49. Equation. Approximation for weak scour.
This relationship suggests that ys is proportional to H2 if Hcp is neglected. Since H is a function of V, then ys is proportional to V2. This agrees with Oliveto and Hager's observation that the scour depth increases with the approach flow velocity, approximately following the square relation.(12)
For a large value of H or strong scour, the equation in figure 46 is approximated by the equation in figure 50.
![]()
Figure 50. Equation. Approximation for strong scour.
This relationship corresponds to the maximum potential scour depth and is similar to the equation in figure 3. The relationships developed in this chapter are validated and refined with the data described in chapter 4.