U.S. Department of Transportation
Federal Highway Administration
1200 New Jersey Avenue, SE
Washington, DC 20590
202-366-4000
Federal Highway Administration Research and Technology
Coordinating, Developing, and Delivering Highway Transportation Innovations
| REPORT |
| This report is an archived publication and may contain dated technical, contact, and link information |
| Publication Number: FHWA-HRT-12-022 Date: May 2012 |
Publication Number: FHWA-HRT-12-022 Date: May 2012 |
The development and testing of the concepts in this report are supported by laboratory and field pier scour data. The laboratory data include testing performed specifically for this study at the Federal Highway Administration (FHWA) J. Sterling Jones Hydraulics Laboratory located at the Turner-Fairbank Highway Research Center (TFHRC) as well as data collected at CSU and provided by Molinas.(35) Field data from the United States Geological Survey (USGS) are also used in this study.(36,37)
When considering laboratory and field data jointly, the question of scale is assessed to determine if the same or similar phenomena are captured in the data. In particular, the assessment investigates if the same range of flow, structure, and sediment interaction are captured. Four non-dimensional ratios are summarized in table 1: (1) flow depth to pier width (h/b), (2) pier width to median material size (b/D50), (3) flow depth to median material size (h/D50), and (4) Froude number.
Table 1. Similitude comparison of data sources.
| Ratio | Measure | TFHRC | CSU | USGS (2004) | USGS (2011) |
|---|---|---|---|---|---|
| h/b | Minimum | 1.4 | 1.0 | 1.0 | 0.5 |
| Median | 2.2 | 1.8 | 2.1 | 1.9 | |
| Maximum | 6.1 | 11.2 | 5.2 | 5.4 | |
| b/D50 | Minimum | 37 | 35 | 11 | 6 |
| Median | 131 | 240 | 13 | 19 | |
| Maximum | 311 | 393 | 14 | 95 | |
| h/D50 | Minimum | 222 | 353 | 11 | 4 |
| Median | 333 | 435 | 28 | 33 | |
| Maximum | 444 | 532 | 58 | 272 | |
| Froude number | Minimum | 0.20 | 0.10 | 0.21 | 0.19 |
| Median | 0.24 | 0.19 | 0.47 | 0.45 | |
| Maximum | 0.27 | 0.28 | 0.68 | 1.14 |
The h/b values are consistent between the four data sources, with the median values narrowly varying between 1.8 in the CSU lab data and 2.2 in the TFHRC lab data. However, the bed material size is much smaller in the two lab data sources (TFHRC and CSU) compared with the two USGS field data sources. Median values of both the b/D50 and h/D50 ratios are roughly a factor of 10 higher in the field data, meaning the sediment is relatively smaller in the laboratory data. With respect to the flow field, as represented by the Froude number, the two lab datasets exhibit generally lower Froude numbers than the two field datasets.
For this study, the focus is on non-uniform sediments because alluvial sediments are usually composed of a mixture of different sizes of sands and gravels. Previous researchers, including Landers and Mueller, Kranck et al., and Purkait, have proposed that there is a strong tendency for river sediments to follow a log-normal size distribution.(38–40) In contrast, other researchers, including Barndorff-Nielsen, Flenley et al., and Fieller et al., have demonstrated that other distributions, such as the log-skew-Laplace and log-hyperbolic distributions, fit some natural sediment samples better than the log-normal distribution.(41–43) Hajek et al. attributes the differences in the observations of parametric distribution fit to differences in the sediment sampling strategy, measuring, and statistical analysis.(44)
Most natural sediments show an approximate log-normal distribution only through the middle part of the distribution, with long tails in both the coarse and fine fractions. The sediment is characterized by the median grain size D50 and a non-uniformity parameter known in literature as the non-uniformity coefficient, σ. This coefficient is defined as the square root of the ratio of D84 to D16. The presence of coarse material in sediment mixtures is characterized by D90 or D95.
The objective of the experiments was to collect pier scour data under controlled flow conditions for a set of graded and uniform sediment mixtures used as bed material and circular pier models in a flume. The experiments were conducted at the J. Sterling Jones Hydraulics Laboratory located at TFHRC in McLean, VA.
The facilities, instrumentation, experimental setup, and procedure are described in the following subsections.
The experimental flume is a tilting water recirculating laboratory facility. The flume is 6 ft wide, 1.8 ft deep, and 70 ft long, with transparent glass side walls to facilitate flow visualization. It has a stainless steel bottom whose slope was fixed at 0.52 percent for all experiments. A schematic drawing of the flume is presented in figure 51. The numbers in the figure identify the following: (1) pump, (2) magnetic flow meter, (3) stilling basin, (4) honeycomb flow straightener, (5) flow direction, (6) coarse bed material, (7) sediment bed (test section), (8) circular pier structure, and (9) tailgate.
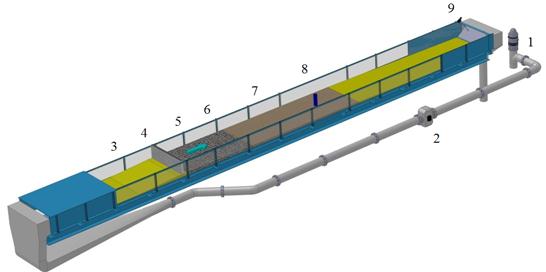
Figure 51. Illustration. FHWA tilting flume.
The structure's skeleton is composed of U-shaped lateral steel frames supported on box-sectioned longitudinal girders. A walkway is provided on one side of the structure. Water is supplied to the flume by a circulation system with a ground sump of 7,420 ft3 and a pump with a maximum capacity of 10.6 ft3/s. The flow is introduced to an upstream head box equipped with a screen and filter. Rapid development of the fully turbulent boundary layer is achieved through an upstream ramp followed by a honeycomb mesh as a flow straightener and an upstream transition zone composed of a layer of coarse sediments carefully placed on the flume bed to provide excess friction. A wave suppressor ensures accomplishment of the previous concerns. The flow depth is regulated through a computer-operated downstream adjustable tailgate.
A uniform 6-inch layer of the test bed material is evenly spread along the full length of the test section (17.4 ft long by 6 ft wide) and starts after the transition zone. A recess where the pier model is positioned is deep enough to model local scour to a depth of 15.7 inches, as shown in figure 52. In order to facilitate drainage of the test section after the experiments, a 1.2-inch-diameter polyvinyl chloride (PVc) pipe was embedded at the bottom of the recess section.

Figure 52. Illustration. Test section with sediment recess at the pier location.
In addition to a manually moving carriage, the flume is instrumented with an automated three-axis positioning system, shown in figure 53, with traversing capability for the entire length, width, and height of the flume and a resolution of 0.0394 inches. This carriage can position probes at any location within the test section to make point measurements for flow velocities using an acoustic Doppler velocimeter (ADV) and bed bathymetry using a laser distance sensor.
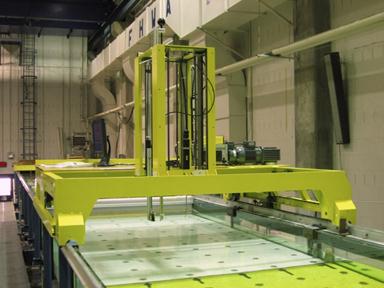
Figure 53. Photo. Automated flume carriage in the J. Sterling Jones Hydraulics Laboratory.
For the pier scour experiments, five cylindrical PVc piers with an outside diameter varying from 0.11 to 0.46 ft were used. For all runs, the piers were placed at the center line of the flume and 23.6 ft from the honeycomb. The largest pier diameter was chosen based on the flume cross section to minimize side-wall effects.
Experimental runs were performed using two types of sediments, a near uniform sediment with D50 of 0.018 and 0.035 inches and a mixed sediment with D50 of 0.039 and 0.079 inches. The uniform materials were not used for this study. Table 2 provides a summary of the bed material parameters for the mixed sediment materials.
Table 2. Properties of bed materials tested at TFHRC.
| Property | Material ID | |
|---|---|---|
| M-1 | M-2 | |
| Material type | Mixed | Mixed |
| σ | 2.5 | 2.1 |
| D16 (inches) | 0.015 | 0.009 |
| D50 (inches) | 0.035 | 0.018 |
| D84 (inches) | 0.091 | 0.037 |
| D90 (inches) | 0.118 | 0.047 |
| D95 (inches) | 0.157 | 0.059 |
| D99 (inches) (sediment size where 99 percent of the sediment is finer by weight | 0.236 | 0.091 |
The relative size of the bed material for comparison with other lab studies and field data may be expressed in two ratios: (1) pier width to D50 and (2) flow depth to D50. For the mixed sediment materials, the first ratio ranged from 37 to 311 with a median of 131, and the second ratio ranged from 222 to 444 with a median of 333.
To ensure a maximum clear-water pier scour, all approach velocities in the test section were set below the critical velocity, Vc, for D50 according to the method proposed by Neill.(45) The upstream velocity was then chosen in the range of 0.93Vc to 0.97Vc with a constant flow depth, h, equal to 0.66 ft, measured with two ultrasonic sensors placed upstream and downstream along the test section. This resulted in the operating discharge. The discharge was monitored with an electromagnetic flowmeter. An ADV was used for each run to measure point flow velocities at different cross sections along the flume in order to define optimal upstream velocities and validate clear-water flow conditions.
Bathymetric data were collected for each test bed using a point laser distance sensor shown in figure 54 and figure 55. A LabVIEW™ virtual instrument was programmed for data acquisition and instrument control. First, the initial bed level was mapped right after the sediment bed was leveled prior to the test run. Then, the final bed with the scour hole region was measured after the water was drained and the run was completed. Approximately 2,000 bathymetry points were collected for each pier model for each test. The resulting bathymetry change is calculated as the difference between the initial and final bed elevations.
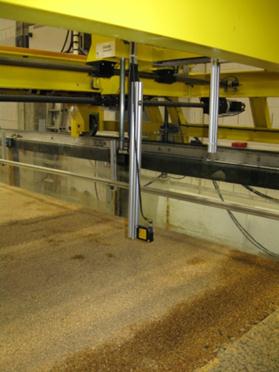
Figure 54. Photo. Automated point laser distance sensor (side view).
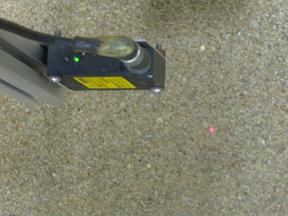
Figure 55. Photo. Automated point laser distance sensor (top view).
Prior to each run, the sediment bed was leveled and compacted with a flat wood plate attached to the manual carriage mounted on the side walls of the tilting flume. The wood plate was the same width as the flume. After the sediment bed was leveled, the pier was carefully placed in the test section. The next step was to map the initial sediment bed bathymetry in the test section around each pier with a point laser distance sensor installed in the automated carriage.
The total size of the mapped bed varied based on the pier diameter with a mesh grid of 0.79 by 0.79 inches. The tailgate was closed, and the flume was slowly filled with water and allowed to sit for approximately 1 h to provide time for air trapped in the sediment to escape. Each test was run for 24 h until equilibrium scour was reached. The pier structure, sediment, and flow conditions for each test are summarized in table 3.
Table 3. Summary of pier scour tests conducted at TFHRC.
| Test ID | D50(inches) | Gradation, σ |
Pier diameter, b (ft) | Flow, Q (ft3/s) | Flow Depth, h (ft) | Upstream Velocity, V (ft/s) | Bed Slope (percent) | Froude Number | Flow duration, t (h) |
|---|---|---|---|---|---|---|---|---|---|
| T-1 | 0.035 | 2.5 | 0.46 | 4.6 | 0.66 | 1.25 | 0.52 | 0.27 | 24 |
| T-2 | 0.035 | 2.5 | 0.37 | 4.6 | 0.66 | 1.25 | 0.52 | 0.27 | 24 |
| T-3 | 0.035 | 2.5 | 0.29 | 4.6 | 0.66 | 1.25 | 0.52 | 0.27 | 24 |
| T-4 | 0.035 | 2.5 | 0.20 | 4.6 | 0.66 | 1.25 | 0.52 | 0.27 | 24 |
| T-5 | 0.035 | 2.5 | 0.11 | 4.6 | 0.66 | 1.25 | 0.52 | 0.27 | 24 |
| T-6 | 0.018 | 2.1 | 0.46 | 3.4 | 0.66 | 0.92 | 0.52 | 0.20 | 24 |
| T-7 | 0.018 | 2.1 | 0.37 | 3.4 | 0.66 | 0.92 | 0.52 | 0.20 | 24 |
| T-8 | 0.018 | 2.1 | 0.29 | 3.4 | 0.66 | 0.92 | 0.52 | 0.20 | 24 |
| T-9 | 0.018 | 2.1 | 0.20 | 3.4 | 0.66 | 0.92 | 0.52 | 0.20 | 24 |
| T-10 | 0.018 | 2.1 | 0.11 | 3.4 | 0.66 | 0.92 | 0.52 | 0.20 | 24 |
Vertical velocity profiles were measured at different cross sections along the test section, and water depths upstream and downstream of the pier were monitored with ultrasonic sensors. At the end of each run, the flume was slowly drained in order to prevent post-run disturbances to the bed and scour hole around the pier. Photos of the scour hole around each pier were taken. A sample result of a test after 24 h is shown in figure 56. The 3D scour hole was mapped using the laser distance sensor, and the collected data were processed with LabVIEWTM. Finally, the dried sediment armored layers formed around the piers were carefully sampled for a sieve analysis using U.S. standard sieves to obtain the particle size distribution of the armor layers.
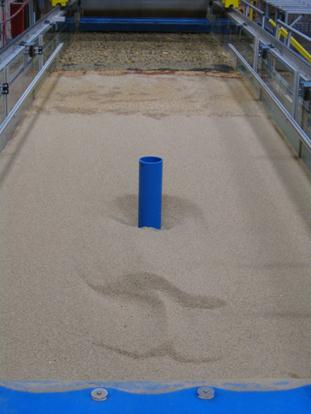
Figure 56. Photo. Bed bathymetry after a pier scour test.
The experimental results were based on 3D scour mapping recordings from the sand recess. They are presented in 3D visualizations, longitudinal profiles, and maximum scour depths. The results show that the deepest scour depth was located at the upstream face of the pier, where the strongest down-flow jet occurs. Figure 57 shows the result of a pier scour test with a graded sediment for D50 = 0.018 inches, V = 0.92 ft/s, and water depth h = 0.66 ft. Figure 58 shows a close-up photo of the same test showing the armoring layer. A tabulation of experimental results is provided in table 6 in the appendix.
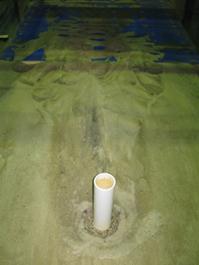
Figure 57. Photo. Result of a pier scour test with a graded sediment.
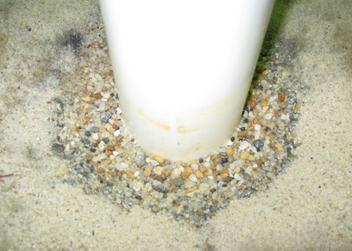
Figure 58. Photo. Result of a pier scour test showing the armoring layer.
Data collected at CSU by Molinas were used in this study.(35) Table 4 summarizes the properties of the bed material parameters. Table 7 in the appendix summarizes the results of the test runs.
Table 4. Bed material properties for CSU experiments.
| Property | Material ID | ||
|---|---|---|---|
| MA-1A | MA-2D | MH-1 | |
| σ | 2.4 | 3.4 | 2.2 |
| D16 (inches) | 0.012 | 0.009 | 0.009 |
| D50 (inches) | 0.030 | 0.030 | 0.022 |
| D84 (inches) | 0.072 | 0.104 | 0.043 |
| D90 (inches) | 0.083 | 0.126 | 0.051 |
| D95 (inches) | 0.093 | 0.165 | 0.063 |
| D99 (inches) | 0.189 | 0.315 | 0.091 |
In total, 171 tests were conducted, but only 70 were used in this study because they met the following criteria:
The relative size of the bed material for comparison with other lab studies and field data may be expressed in two ratios: (1) pier width to D50 and (2) flow depth to D50. For the CSU bed materials, the first ratio ranged from 35 to 393 with a median of 240, and the second ratio ranged from 353 to 532 with a median of 435.
In 2004, Chase and Holnbeck reported field data for pier scour at bridges in Montana, Maryland, and Virginia, and in 2011, Holnbeck reported field data from bridges in Montana.(36,37) Both studies were performed by USGS, and the data are provided in the appendix. All observations are indicative of clear-water scour where approach velocity is less than or equal to critical velocity.
The 2004 bed material ranged in size for D50 from 2.2 to 4.3 inches with a gradation ranging from 1.5 to 2.1. This dataset included 22 separate observations; however, it did not include estimates for D16, which is needed to calculate gradation. As an approximation, gradation was estimated as the ratio of D95 to D50 raised to the reciprocal of 1.645.
As before, the relative size of the bed material for comparison with other lab studies and field data may be expressed in two ratios: (1) pier width to D50 and (2) flow depth to D50. For the first ratio, values ranged from 11 to 14 with a median of 13, and the second ratio ranged from 11 to 58 with a median of 28.
The 2011 data from Montana provide a wider range of bed material characteristics than the 2004 data, with D50 ranging from 0.4 to 4.3 inches and gradations ranging from 1.5 to 4.1. A total of 89 observations are included in this dataset.
The relative size ratios (pier width to D50 and flow depth to D50) also displayed a larger range than the 2004 data. The first ratio ranged from 6 to 95 with a median of 19, and the second ratio ranged from 4 to 272 with a median of 33.