U.S. Department of Transportation
Federal Highway Administration
1200 New Jersey Avenue, SE
Washington, DC 20590
202-366-4000
Federal Highway Administration Research and Technology
Coordinating, Developing, and Delivering Highway Transportation Innovations
 |
| This report is an archived publication and may contain dated technical, contact, and link information |
|
Publication Number: FHWA-HRT-11-021®
Date: April 2011® |
According to NAPA, the current annual U.S. production of new asphalt pavement material is approximately 500 million tons per year, which includes about 60 million tons of reclaimed material that is reused or recycled directly into pavements.(12) As of 2007, about 40 million tons of RAP is reused or recycled into other pavement-related applications every year for a total use of over 100 million tons of RAP each year. This is an increase from 72 million tons of RAP used each year in the early 1990s. Since most reclaimed asphalt is reused or recycled, asphalt pavement has the highest recycling rate by percentage among recycled materials.
A survey was sent to FHWA division offices to seek information regarding RAP usage by each State transportation department. In total, 18 out of 52 division offices responded, and 17 of the 18 respondents indicated that the use of RAP is optional and depends on the contractor to propose its use based on economic considerations and material availability.
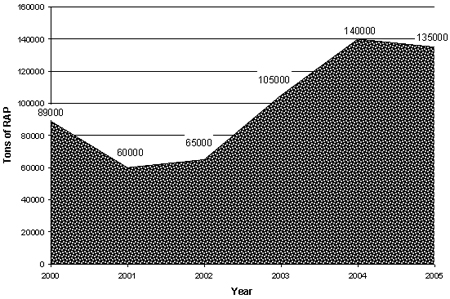
Survey responses confirmed that the use of RAP is primarily driven by the costs of materials and transportation. As stated previously, the most economical use of RAP is in asphalt mixtures where the full benefit of the RAP binder and aggregate is utilized. Most States do not track the amount of RAP used or the cost savings. Only 3 of the 18 respondents indicated that they track the amount of RAP used. A primary challenge in tracking the amount of RAP used is that HMA is not bid based on its components or whether or not it contains RAP; rather, it is bid as a material itself. The New Jersey Department of Transportation tracked the approximate quantities of RAP used. It found a significant increase in the amount of RAP used from 2003–2005, as compared to 2002 (see figure 3). Similarly, other respondents noted increases in the use of RAP (8 out of 18, or about 45 percent), and some noted that contractors requested approval of mixtures with higher percentages of RAP (i.e., more than 25 percent RAP).
Figure 3. Graph. Approximate tons of RAP used in recycled asphalt in New Jersey per year.
In 2007, a survey was conducted by the North Carolina Department of Transportation (NCDOT) on behalf of RAP ETG and sponsored by the AASHTO Subcommittee on Materials. The survey asked the following questions regarding RAP use:
Survey responses were collected from all 50 States as well as Ontario, Canada. The survey showed that the majority of State transportation department specifications allowed the use of RAP in HMA mixtures. The 2007 average national usage rate was estimated to be 12 percent. RAP was typically permitted in subsurface, base, and shoulder mixtures but may have been restricted in surface/wearing courses. Very few States allowed little or no RAP due to concerns regarding performance.
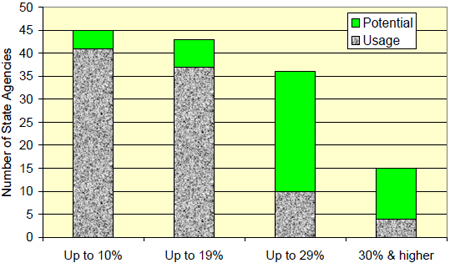
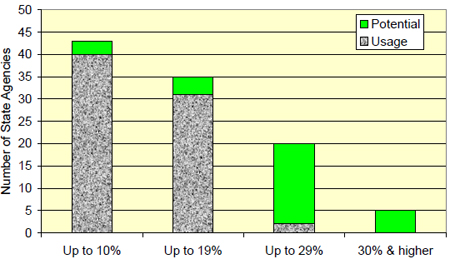
The survey data also indicated the potential for increasing the amount of RAP used across the United States. Figure 4 and figure 5 show the number of State transportation departments that used and permitted a given amount of RAP in the intermediate and surface layers in 2007. There was the potential for more State transportation departments to use up to the amount of RAP that their specifications permitted. For example, in figure 4, only 10 State transportation departments used up to 29 percent RAP in the intermediate layer. However, according to their specifications, there was the potential for over 35 State transportation departments to use up to 29 percent RAP. Similarly, less than 5 State transportation departments used up to 29 percent RAP in the surface layer, while there was the potential for 20 State transportation departments to do so (see figure 5). The data indicated that the maximum amount of RAP that was permitted was not being used on a nationwide basis.
Figure 4. Graph. Usage and potential of various RAP percentages in the intermediate layer.
Figure 5. Graph. Usage and potential of various RAP percentages in the surface layer.
A survey of U.S. States conducted by the Materials Engineering and Research Office of the Ministry of Transportation of Ontario, Canada, (MTO) further confirmed the 2007 NCDOT survey results. MTO found that for base and binder courses, 20–50 percent RAP was typically permitted. Permitted levels of RAP were higher in base courses and for light traffic roadways, as compared to medium or heavy traffic roadways. Some States commented that although high amounts of RAP were permitted, contractors typically did not submit mix designs for amounts greater than 25 percent.
Generally, State transportation departments allow between 10 and 20 percent RAP for medium and heavy traffic levels for surface courses. Medium traffic level roads are designed for 3–30 million equivalent single axle loads (ESALs) for a 20-year design. Heavy traffic roads have greater than 30 million ESALs for a 20-year design. For light traffic roads, slightly more RAP is typically allowed in surface courses, and light traffic levels have fewer than 3 million design ESALs for a 20-year design. About 20 percent of the State transportation departments do not allow RAP in surface courses with heavy traffic. Additionally, according to the MTO survey, two State transportation departments did not permit RAP in surface courses and indicated several reasons, such as poor past experiences, lack of expertise/confidence in using RAP in the surface course, and the use of surface mixes with specific aggregate requirements (i.e., frictional characteristics), that may preclude the use of RAP.
Updated Survey Results and Progress
In 2009, another similar survey was conducted by NCDOT on behalf of AASHTO and RAP ETG. The survey asked the following questions:
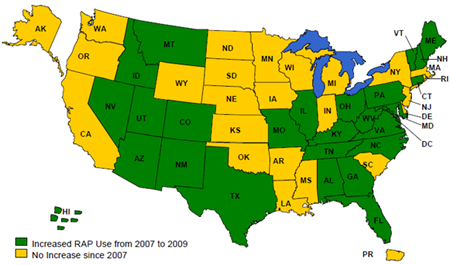
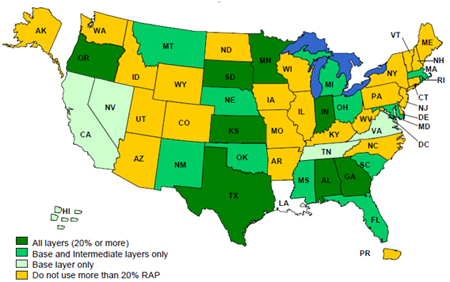
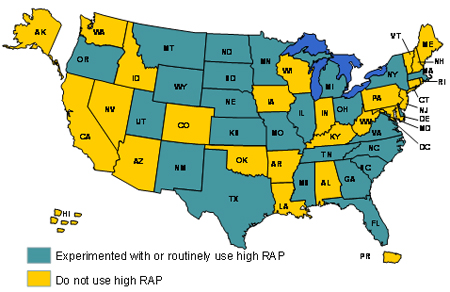
Figure 6 shows that about half of all States reported increased RAP usage from 2007–2009. Approximately half (23) of the State transportation departments reported experimenting with or routinely using high RAP. While many State transportation departments increased the amount of RAP used in HMA, the use of high RAP mixtures is still not common. As shown in figure 7, many State transportation departments permit more than 25 percent RAP in HMA layers; however, fewer than half of the States actually use more than 20 percent RAP in HMA layers (see figure 8).
Figure 6. Map. States with increased RAP use since 2007.
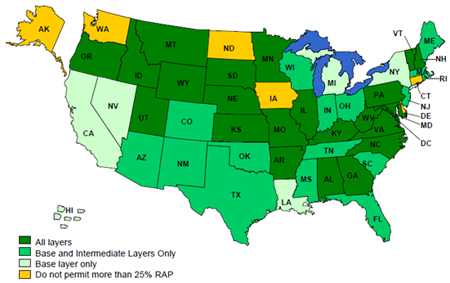
Figure 7. Map. States that permit more than 25 percent RAP in HMA layers.
Figure 8. Map. States that use more than 20 percent RAP in HMA layers.
The majority of State transportation departments requires mixtures that incorporate RAP to meet all conventional mix design requirements. However, most State transportation departments place restrictions on the amount of RAP used overall as well as in certain mix types and pavement layers. Conditions may be placed on the asphalt binder grade, aggregate type, and nominal maximum aggregate size for use with RAP. The majority of respondents to a survey conducted by the Ohio Department of Transportation (ODOT) indicated there are no special requirements for high RAP mixtures beyond normal mix design procedures. About half of the States have experimented with high RAP or routinely use high RAP mixes (see figure 9).
Figure 9. Map. States that use more than 20 percent RAP in HMA layers.
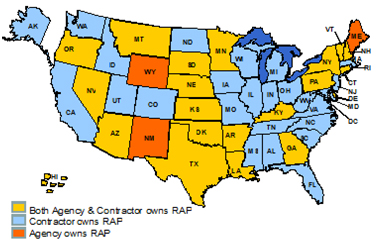
Many States specify RAP ownership with the contractor retaining RAP the majority of the time (see figure 10). In 20 States, both the State transportation department and the contractor retain ownership of RAP. Only three State transportation departments retain complete ownership of RAP for other applications. RAP ownership depends on the State transportation department's specifications, the individual contract requirements, and utilization by the State transportation department's maintenance departments.
Figure 10. Map. Ownership of RAP by State highway agency.
Average RAP use is estimated at 12 percent in HMA in the United States. Less than half of State transportation departments use more than 20 percent RAP; however, based on State transportation department specifications, it is possible for States to use up to 30 percent RAP in the intermediate and surface layers of pavements. Currently, it is unknown why over half of the country uses less than 20 percent RAP in HMA.
Despite similarities between producing virgin asphalt mixtures and RAP asphalt mixtures, there are still challenges for maximizing RAP use and routinely using high RAP. According to AASHTO M 323, the current binder selection guidelines for RAP mixtures were formulated based on the assumption that complete blending occurs between the virgin and RAP binders.(13) It is understood that the amount of blending that occurs between the virgin and RAP binder is somewhere between complete blending and no blending at all; however, there is no direct method available to accurately determine the amount of blending that occurs. Currently, researchers are performing ongoing studies to develop methods to determine if proper blending has occurred by using mixture properties such as dynamic modulus to estimate blended binder properties and to compare estimate blended binder properties to measured binder properties.(14,15)
For high RAP mixtures, blending charts can be used to properly determine the virgin binder grade. They can also be used to optimize the amount of RAP used if the virgin binder grade is known. However, blending charts require expensive, time-consuming binder extraction and recovery procedures that use hazardous solvents, which is followed by testing of the recovered binder. Consequently, many State transportation departments are reluctant to permit RAP content that require this testing. Additionally, many contractors are not equipped to perform binder extractions and recoveries or the subsequent binder tests. In general, State transportation departments are concerned with the consistency of RAP materials and whether mixtures with high RAP are inferior and fail earlier than virgin mixtures. In some instances, State transportation departments place limitations on the amount of RAP that can be used based on previous bad experiences with RAP. According to the 2007 NCDOT survey, the four most common factors preventing the use of additional RAP are as follows:
In the 2009 NCDOT survey, participants were asked to identify major concerns and obstacles that limit or preclude the use of RAP in HMA. The two concerns cited most often regarded the quality of the blended virgin and RAP binder qualities, especially for high RAP mixes and polymer modified binders, and stiffening of the mix from high RAP quantities and resulting cracking performance. Several States were concerned that the use of RAP with polymer-modified binders may reduce the quality of the polymer-modified virgin binder. Furthermore, high RAP may affect binder properties resulting in an "overly stiff" mix that may experience low-temperature cracking. There was also concern that an overly stiff mix may not be as resilient and may crack prematurely for pavements experiencing high deflections.
The most common barriers among State transportation departments are as follows:
The most common barriers among contractors are as follows:
In the past 2 years, several surveys regarding the use of RAP in asphalt mixtures have been compiled. Table 1 presents the survey description, organization, date, and number of responses for each survey summarized in this report.
Table 1. Surveys on RAP usage.
| Survey Description | Organization | Date | Number of Responses |
|---|---|---|---|
FHWA Division Office Pavement Engineers |
FHWA |
2007 |
18 |
FHWA/AASHTO RAP ETG survey |
NCDOT |
July 2007 and August 2009 |
51 |
Summary of States extending RAP usage |
ODOT |
September 2008 |
29 |
RAP usage survey |
Materials Engineering and Research Office MTO |
November 2008 |
33 |
Nuclear asphalt content (AC) gauge use on HMA mixtures containing RAP |
Colorado Department of Transportation (CDOT) |
January 2008 |
29 |
RAP survey |
South Carolina Department of Transportation (SCDOT) |
April 2009 |
25 |
Fractionation is the act of processing and separating RAP into at least two sizes, typically a coarse fraction (+1/2 or +3/8 inches (+12.5 or +9.5 mm)) and a fine fraction (-1/2 or -3/8 inches (-12.5 or -9.5 mm)). According to a survey conducted by ODOT in September 2008 that compiled responses from 29 States, 3 States (South Carolina, Texas, and Alabama) have specifications for fractionating RAP, and 3 States (Ohio, Wisconsin, and Illinois) are currently drafting specifications for fractionating RAP. These six States allow higher amounts of RAP if it has been fractionated. For example, in the Texas specification, unfractionated RAP is limited to 10, 20, and 30 percent by surface, intermediate, and base layers, respectively. However, by special provision, fractionated RAP is allowed at up to 20, 30, and 40 percent in those same layers. In the 2009 survey conducted by NCDOT, 10 State transportation departments reported requiring fractionation. These 10 states are Arizona, Georgia, Illinois, Kansas, North Carolina, Ohio, Texas, Utah, Wisconsin, and Washington, DC. Wisconsin allows an increase of 5 percent binder replacement for surface mixes if fractionation is used. Some States consider crushing and screening RAP over a single screen as fractionation, which is incorrect.
One of the reasons fractionation is required is that it is believed to improve the consistency of RAP. However, data gathered by NCAT in 2008 and 2009 from contractors across the United States showed that fractionated RAP stockpiles were no more consistent than processed unfractionated RAP stockpiles.(16) Therefore, State transportation departments are not advised to invoke a method specification for RAP management. Instead, they should develop an end-result specification for RAP stockpiles that requires routine QC testing of RAP and establishes limits for variability.
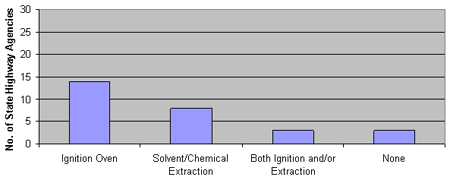
The most common method for determining the AC in a sample of RAP is to use the ignition oven method specified in AASHTO T 308.(17) A CDOT survey compiled in January 2008 includes responses from 29 State transportation departments and shows that almost half of them used the ignition oven to determine the AC of the RAP fraction for mix design purposes. About 30 percent of the respondents used solvent or chemical extraction, while 3 out of the 29 States used both solvent extraction and the ignition oven. The results are provided in figure 11.
Figure 11. Graph. Quantification of the use of different methods for determining the AC of RAP mixtures.
Mix Design Methods for RAP Mixes
The Superpave® performance grade (PG) binder and volumetric mix design system has become the most widely accepted design system for asphalt mixtures in the United States. According to a survey conducted in 2008 by the Materials Engineering and Research Office MTO, Superpave® is the most common method of mixture design used in the United States for RAP mixes, including those that contain over 20 percent RAP. In total, 25 out of 33 State transportation department respondents use the Superpave® method exclusively or some variation of the Superpave® mix design procedure (i.e., agency-modified Superpave® mix design). Six of the twenty-five also utilize the Marshall or Hveem mix design procedure for certain mix types. According to the MTO survey, four State transportation departments do not use the Superpave® mix design procedure—California and Nevada use the Hveem method for mix design, and Rhode Island and Tennessee use the Marshall method exclusively.
The current Superpave® specification for selecting the virgin asphalt binder grade based on a given RAP percentage is provided in table 2 of AASHTO M 323.(13) Most State transportation departments use this specification. However, 12 out of 33 respondents have raised the lower percent RAP limit for selecting a softer virgin binder grade from 15 to 20 percent or to 25 percent in a few cases. States that have raised the lower limit from 15 percent are Alaska, Colorado, Florida, Illinois, Indiana, Kentucky, Maryland, Michigan, Minnesota, North Carolina, Nebraska, New Jersey, South Dakota, and Washington.
The majority of State transportation departments do not place restrictions on the use of RAP in certain plant types. However, in some cases, there are more restrictions when RAP is used in batch plants. According to the ODOT survey of 29 States, 5 State transportation departments place restrictions on the amount of RAP used by plant type. For example, South Carolina does not allow more than 15 percent RAP to be used in a batch plant with a hot elevator. Georgia and New Hampshire limit batch plants to 25 percent RAP but allow up to 30 and 40 percent RAP in drum plants. Massachusetts allows up to 40 percent RAP in a drum plant but limits the amount of RAP used in a batch plant to 20 percent.
The majority of State transportation departments responding to a survey conducted by SCDOT and compiled in April 2009 reported no use of WMA; however, as of 2009, WMA projects (i.e., State, private, or local projects) have been constructed in over 40 States. In total, 8 out of 24 State transportation departments are not currently specifying WMA. Additionally, CDOT and the Virginia Department of Transportation do not allow RAP in WMA mixes. According to the NCDOT survey compiled in August 2009, 12 State transportation departments utilized WMA technologies in conjunction with increased RAP contents. These 12 State transportation departments are Alabama, Delaware, Florida, Illinois, Indiana, Mississippi, Nebraska, New Jersey, Ohio, South Carolina, Tennessee, and Texas. As of 2009, at least 14 State transportation departments have adopted specifications to accommodate WMA. Five States (Alabama, Florida, Illinois, Kentucky, and Texas) do not have any differences in allowances for using RAP in WMA mixes compared to using RAP in HMA mixes. Two States (Ohio and South Carolina) have modified their specifications to allow more RAP in WMA. For example, Ohio's recently modified specification allows the use of more RAP before a softer grade of binder is required when using the water injection WMA process. South Carolina allows producers to use up to 10 percent more fractionated RAP in WMA before changing the binder grade. A WMA best practices guide and Web site is available from NAPA, which includes information on using WMA and RAP.(18,19)
According to the 2009 SCDOT survey, the majority of State transportation departments that responded (18 out of 23) do not pay for asphalt binder separately from the asphalt mixture. Arkansas pays for liquid binder as a separate pay item; however, residual binder in RAP is paid for at the same price as the contract unit bid price for virgin binder. In Colorado, two out of six regions pay for binder separate. However, these regions are rural where RAP capabilities are limited. In Georgia, an index for asphalt binder is paid based on the job mix formula (JMF), and the asphalt binder in the RAP is accounted for in the mix design process. In North Carolina, the asphalt cement is indexed based on the total percent asphalt cement in JMF. The binder from RAP is included in the total binder index; however, in May 2009, North Carolina planned to start indexing based on virgin asphalt cement only. In Utah, there is a separate pay item for liquid binder for open-graded surface courses only. All other HMA products are paid by the mix ton, and RAP is accounted for in the bidding process.