U.S. Department of Transportation
Federal Highway Administration
1200 New Jersey Avenue, SE
Washington, DC 20590
202-366-4000
Federal Highway Administration Research and Technology
Coordinating, Developing, and Delivering Highway Transportation Innovations
| REPORT |
| This report is an archived publication and may contain dated technical, contact, and link information |
|
| Publication Number: FHWA-HRT-17-049 Date: October 2017 |
Publication Number: FHWA-HRT-17-049 Date: October 2017 |
This chapter discusses roughness changes at the test sections in each SPS-1 project and presents the change in MIRI and CLIRI as well as the rate of change of MIRI and CLIRI at each test section.
The change in MIRI and CLIRI at each test section was computed by deducting the IRI obtained at the time when the section was first profiled with the K.J. Law T-6600 profiler from the IRI obtained for the last profile date used for analysis. Figure 36 and figure 37 show box plots for the changes in MIRI and CLIRI, respectively, observed for the test sections in each SPS-1 project. Figure 38 is a bar chart that shows the average time span over which IRI data were collected at the sections in each SPS-1 project.

Figure 36. Graph. Box plots showing change in MIRI at test sections in each SPS-1 project.

Figure 37. Graph. Box plots showing change in CLIRI at test sections in each SPS-1 project.

Figure 38. Graph. Average time span over which IRI data have been collected at sections in SPS-1 projects.
A box plot is a simple graphical representation that shows the distribution of data. For each SPS‑1 project, the box plot shows the distribution of the change in IRI values for the test sections located in the SPS-1 project. The horizontal line located within the box shows the median of the data. The bottom of the box shows the value of the first quartile of the data (i.e., 25th percentile value), while the top of the box shows the value of the third quartile of the data (i.e., 75th percentile value). The height of the box is equal to the interquartile distance (IQD), which is the difference between the third and the first quartile of the data. The whiskers in the plot at the top and the bottom (i.e., the horizontal lines at the top and the bottom) show the range of the data. A data point that is more than 1.5 times the IQD from the median is defined as an outlier. An outlier is shown as a circle above or below the whiskers.
The bar graph is provided to show the average time span over which data were collected at each SPS-1 project because the change in MIRI and CLIRI could depend on the monitored period. For example, for identical subgrade, traffic, and environmental conditions, a test section monitored over a longer time should show a greater change in MIRI and CLIRI than a test section monitored over a shorter time.
The change in MIRI as well as CLIRI observed at the SPS-1 projects varied. For example, the change in MIRI observed for the sections at the Montana SPS-1 project was much larger than the change in MIRI observed at the Louisiana SPS-1 project, even though the Louisiana project had been monitored over a longer period. Overall, the test sections at the Florida, New Mexico, and Wisconsin SPS-1 projects showed a greater change in CLIRI compared with the other SPS‑1 projects.
Evaluation of the IRI versus time plots for the SPS-1 sections showed a linear trend in IRI progression for a majority of the sections except for a few of the weak sections that showed an exponential trend for increase in IRI at the latter years. Because a majority of the sections showed a linear trend for IRI increase, a linear regression analysis between IRI and pavement age was performed on all sections to estimate the rate of increase of MIRI and CLIRI. The box plots in figure 39 and figure 40 show the distribution of the rate of change of MIRI and CLIRI, respectively, obtained for the test sections in each SPS-1 project.

Figure 39. Graph. Rate of change of MIRI at test sections in each SPS-1 project.

Figure 40. Graph. Rate of change of CLIRI at test sections in each SPS-1 project.
Table 49 shows the median value for the rate of change of MIRI and CLIRI of all test sections in each SPS-1 project. This table also shows the following information for each SPS-1 project: environmental zone, subgrade type, and average time span over which data were collected for all three paths (i.e., wheelpaths and center of the lane).
Table 49. Median values of rate of change of MIRI and CLIRI for SPS-1 projects.
| Project Location |
Environmental Zone |
Subgrade Type |
Average Time Span over which Center of the Lane Data Were Collected (Years) |
Rate of Change of IRI (Inches/mi/Year) |
|
|---|---|---|---|---|---|
| MIRI | CLIRI | ||||
| Alabama | WNF | Fine-grained | 7.0 | 0.47 | 0.19 |
| Arizona | DF | Coarse-grained | 6.8 | 3.41 | 0.66 |
| Arkansas | WNF | Coarse-grained | 9.6 | 2.22 | 0.97 |
| Delaware | WNF | Coarse-grained | 9.0 | 0.26 | 0.75 |
| Florida | WNF | Coarse-grained | 15.1 | 1.55 | 1.65 |
| Iowa | WF | Fine-grained | 3.7 | 5.36 | 2.58 |
| Kansas | WF | Coarse-grained | 4.2 | 2.48 | 0.82 |
| Louisiana | WNF | Fine-grained | 14.2 | 0.82 | 1.18 |
| Michigan | WF | Fine-grained | 5.0 | 2.42 | 1.47 |
| Montana | DF | Coarse-grained | 11.7 | 1.81 | 1.35 |
| Nebraska | WF | Fine-grained | 3.1 | 0.26 | 1.79 |
| Nevada | DF | Coarse-grained | 10.4 | −0.03 | 0.08 |
| New Mexico | DNF | Fine-grained | 9.2 | 4.19 | 4.58 |
| Ohio | WF | Fine-grained | 7.1 | 3.31 | 1.69 |
| Oklahoma | WNF | Coarse-grained | 12.7 | 0.80 | 0.19 |
| Texas | WNF | Coarse-grained | 3.0 | −0.12 | 0.04 |
| Virginia | WNF | Coarse-grained | 11.4 | 0.66 | 0.34 |
| Wisconsin | WF | Coarse-grained | 10.3 | 1.85 | 1.69 |
In some SPS-1 projects, the time span over which IRI data were available for individual test sections in the SPS-1 project was different. This occurred because maintenance or rehabilitation was conducted that affected the IRI at a test section or because the section was deassigned from the LTPP Program. As described previously, for each SPS-1 project, an average time span over which data were collected was computed by averaging the time spans for which data were available for individual test sections. Table 50 shows the SPS-1 projects divided into four categories based on the average time span over which data were available at the project. All category 1 and category 2 SPS-1 projects had coarse-grained subgrade except for the Louisiana project, which had a fine-grained subgrade.
Table 50. SPS-1 projects categorized according to the availability of data.
| Category | Average Time Span over which Center of the Lane Data Were Available (Years) |
SPS-1 Project |
|---|---|---|
| 1 | 12–16 | Florida, Louisiana, Oklahoma |
| 2 | 10–12 | Montana, Nevada, Virginia, Wisconsin |
| 3 | 6–10 | Alabama, Arizona, Arkansas, Delaware, New Mexico, Ohio, Iowa, Kansas, Michigan, Nebraska, Texas |
| 4 | Less than 6 |
In this chapter, the changes in IRI at SPS-1 projects are presented under each category shown in table 50. The changes in MIRI as well as CLIRI are presented for the test sections in each SPS-1 project. The IRI changes for the test sections in each SPS-1 project are presented graphically as bar charts that show the change in IRI as well as the rate of increase of IRI. The change in IRI was computed by deducting the IRI at the last profile date used for analysis from the IRI obtained when the section was first profiled with the K.J. Law T-6600 profiler. The rate of increase of IRI was the value obtained from the regression analysis.
The structural strengths of test sections in an SPS-1 project were different from each other. The structural number (SN) of each test section was computed by using the following layer coefficients: asphalt concrete—0.42, asphalt-treated base—0.35, permeable asphalt-treated base—0.14, and aggregate base—0.14. The computed SN values are shown in table 51. This table also shows the test sections in a project ranked from 1 through 12, with 1 being the section with the lowest SN and 12 being the test section with the highest SN.
Table 51. Test sections in SPS-1 projects ranked from weakest to strongest based on SN.
| SN Rank from Weakest (1) to Strongest (12) |
Section Number |
AC Thickness (Inches) |
Material Type | Thickness (Inches) |
SN | ||
|---|---|---|---|---|---|---|---|
| Layer | Layer | ||||||
| 2 | 3 | 2 | 3 | ||||
| 1 | 7 | 4 | PATB | DGAB | 4 | 4 | 2.80 |
| 2 | 2 | 4 | DGAB | — | 12 | — | 3.36 |
| 3 | 5 | 4 | ATB | DGAB | 4 | 4 | 3.64 |
| 4 | 1 | 7 | DGAB | — | 8 | — | 4.06 |
| 5 | 3 | 4 | ATB | — | 8 | — | 4.48 |
| 6 | 8 | 7 | PATB | DGAB | 4 | 8 | 4.62 |
| 7 | 10 | 7 | ATB | PATB | 4 | 4 | 4.90 |
| 8 | 11 | 4 | ATB | PATB | 8 | 4 | 5.04 |
| 9 | 9 | 7 | PATB | DGAB | 4 | 12 | 5.18 |
| 10 | 6 | 7 | ATB | DGAB | 8 | 4 | 6.30 |
| 11 | 12 | 4 | ATB | PATB | 12 | 4 | 6.44 |
| 12 | 4 | 7 | ATB | — | 12 | — | 7.14 |
| 1 | 13 | 4 | DGAB | — | 8 | — | 2.80 |
| 2 | 20 | 4 | PATB | DGAB | 4 | 8 | 3.36 |
| 3 | 22 | 4 | ATB | PATB | 4 | 4 | 3.64 |
| 4 | 21 | 4 | PATB | DGAB | 4 | 12 | 3.92 |
| 5 | 19 | 7 | PATB | DGAB | 4 | 4 | 4.06 |
| 6 | 14 | 7 | DGAB | — | 12 | — | 4.62 |
| 7 | 17 | 7 | ATB | DGAB | 4 | 4 | 4.90 |
| 8 | 18 | 4 | ATB | DGAB | 8 | 4 | 5.04 |
| 9 | 15 | 7 | ATB | — | 8 | — | 5.74 |
| 10 | 16 | 4 | ATB | — | 12 | — | 5.88 |
| 11 | 23 | 7 | ATB | PATB | 8 | 4 | 6.30 |
| 12 | 24 | 7 | ATB | PATB | 12 | 4 | 7.70 |
| —Indicates not applicable. | |||||||
When presenting the IRI change and rate of increase of IRI in the bar graphs in this report, the test sections are shown according to increasing SN of the test sections.
This section describes roughness development at category 1 SPS-1 projects, which are the projects located in Florida, Louisiana, and Oklahoma.
The climatic and subgrade properties and annual thousands of ESALs (KESALs) for the Florida SPS-1 project are shown in table 52. The time period over which center of the lane data were available at the test sections in this project is shown in table 53. All test sections in this project had data for the same time duration. Figure 41 shows the change in IRI at the test sections over the monitored period, while figure 42 shows the rate of change of IRI at the test sections. The change in MIRI was greater than the change in CLIRI at six test sections. Over the 15.1 years that the sections were monitored, the rate of increase of IRI was less than 2 inches/mi/year at 10 test sections for MIRI and at 8 test sections for CLIRI.
Table 52. Climatic and subgrade properties and traffic level for the Florida SPS-1 project.
| Property | Parameter | Value |
|---|---|---|
| Climatic | Climatic region | WNF |
| Annual precipitation (inches) | 56 | |
| Wet days per year | 168 | |
| Intense precipitation days per year | 35 | |
| Mean annual temperature (°F) | 74 | |
| Days above 90 °F per year | 87 | |
| Days below 32 °F per year | 1 | |
| FI (°F days/year) | 0 | |
| Freeze-thaw cycles per year | 1 | |
| Subgrade | Subgrade category | Coarse-grained |
| Percent material passing through No.200 sieve | 17.9 | |
| Percent silt | 13.3 | |
| Percent clay | 4.6 | |
| Traffic | Average annual KESALs | 562 |
Table 53. Availability of IRI data for the Florida SPS-1 project.
| Section Numbers |
Age of Pavement (Years) | Time Span for Center of the Lane Data (Years) |
|
|---|---|---|---|
| When First Center of the Lane Data Collected |
When Last Center of the Lane Data Collected |
||
| 1–12 | 1.2 | 16.3 | 15.1 |

Figure 41. Graph. Change in IRI at test sections in the Florida SPS-1 project.

Figure 42. Graph. Rate of change of IRI at test sections in the Florida SPS-1 project.
The climatic and subgrade properties and annual KESALs at the Louisiana SPS-1 project are shown in table 54. The time period over which center of the lane data were available at the test sections in this project is shown in table 55. All test sections in this project had data for the same time duration. Figure 43 shows the change in IRI at the test sections over the monitored period, while figure 44 shows the rate of change of IRI at the test sections. The change in MIRI was greater than the change in CLIRI at only one test section. Over the 14.2 years that the sections were monitored, the rate of increase of IRI was less than 1 inch/mi/year at 11 sections for MIRI and 3 sections for CLIRI. The rate of increase of CLIRI was less than 2 inches/mi/year at 11 test sections. There was no distress along the center of the lane that could have contributed to the increase in CLIRI at the test sections in this project. It appears that the increase in CLIRI was caused by the change in the profile resulting from movements of the subsurface layers (i.e., shrink or swell of the subgrade). Along the wheelpaths, traffic might have smoothed out this effect, which might be the reason the change in CLIRI was more than the change in MIRI.
Table 54. Climatic and subgrade properties and traffic level for the Louisiana SPS-1 project.
| Property | Parameter | Value |
|---|---|---|
| Climatic | Climatic region | WNF |
| Annual precipitation (inches) | 58 | |
| Wet days per year | 162 | |
| Intense precipitation days per year | 36 | |
| Mean annual temperature (°F) | 69 | |
| Days above 90 °F per year | 76 | |
| Days below 32 °F per year | 11 | |
| FI (°F days/year) | 2 | |
| Freeze-thaw cycles per year | 11 | |
| Subgrade | Subgrade category | Fine-grained |
| Percent material passing through No. 200 sieve | 94.4 | |
| Percent silt | 69.5 | |
| Percent clay | 24.9 | |
| Plasticity index | 20 | |
| Traffic | Average annual KESALs | 83 |
Table 55. Availability of IRI data for the Louisiana SPS-1 project.
| Section Numbers |
Age of Pavement (Years) | Time Span for Center of the Lane Data (Years) |
|
|---|---|---|---|
| When First Center of the Lane Data Collected |
When Last Center of the Lane Data Collected |
||
| 13–24 | 0.4 | 14.6 | 14.2 |

Figure 43. Graph. Change in IRI at test sections in the Louisiana SPS-1 project.

Figure 44. Graph. Rate of change of IRI at test sections in the Louisiana SPS-1 project.
The climatic and subgrade properties and annual KESALs at the Oklahoma SPS-1 project are shown in table 56. The time periods over which center of the lane data were available at the test sections in this project are shown in table 57. Center of the lane data were available over a period of 9.4 years for two test sections and over a period of 13.3 years for 10 test sections. Figure 45 shows the change in IRI at the test sections over the monitored period, while figure 46 shows the rate of change of IRI at the test sections. The change in MIRI was greater than the change in CLIRI at all test sections. The rate of increase of MIRI was less than 2 inches/mi/year at 11 sections and less than 1 inch/mi/year at 7 test sections. The rate of increase of CLIRI was less than 1 inch/mi/year for all test sections.
Table 56. Climatic and subgrade properties and traffic level for the Oklahoma SPS-1 project.
| Property | Parameter | Value |
|---|---|---|
| Climatic | Climatic region | WNF |
| Annual precipitation (inches) | 32 | |
| Wet days per year | 96 | |
| Intense precipitation days per year | 20 | |
| Mean annual temperature (°F) | 62 | |
| Days above 90 °F per year | 89 | |
| Days below 32 °F per year | 72 | |
| FI (°F days/year) | 99 | |
| Freeze-thaw cycles per year | 67 | |
| Subgrade | Subgrade category | Coarse-grained |
| Percent material passing through No. 200 sieve | 36.9 | |
| Percent silt | 23.2 | |
| Percent clay | 13.7 | |
| Traffic | Average annual KESALs | 62 |
Table 57. Availability of IRI data for the Oklahoma SPS-1 project.
| Section Numbers |
Age of Pavement (Years) | Time Span for Center of the Lane Data (Years) |
|
|---|---|---|---|
| When First Center of the Lane Data Collected |
When Last Center the of Lane Data Collected |
||
| 13, 22 | 0.4 | 9.8 | 9.4 |
| 14–24 | 0.4 | 13.7 | 13.3 |

Figure 45. Graph. Change in IRI at test sections in the Oklahoma SPS-1 project.

Figure 46. Graph. Rate of change of IRI at test sections in the Oklahoma SPS-1 project.
This section describes roughness development at category 2 SPS-1 projects, which are the projects located in Montana, Nevada, Virginia, and Wisconsin.
The climatic and subgrade properties and annual KESALs at the Montana SPS-1 project are shown in table 58. The time period over which center of the lane data were available at the test sections in this project is shown in table 59. All test sections in this project had data for the same time duration. Figure 47 shows the change in IRI at the test sections over the monitored period, while figure 48 shows the rate of change of IRI at the test sections. The change in MIRI was greater than the change in CLIRI at six test sections. The rate of increase of IRI was less than 2 inches/mi/year at seven sections for MIRI and at nine sections for CLIRI.
Table 58. Climatic and subgrade properties and traffic level for the Montana SPS-1 project.
| Property | Parameter | Value |
|---|---|---|
| Climatic | Climatic region | DF |
| Annual precipitation (inches) | 14 | |
| Wet days per year | 101 | |
| Intense precipitation days per year | 6 | |
| Mean annual temperature (°F) | 46 | |
| Days above 90 °F per year | 19 | |
| Days below 32 °F per year | 158 | |
| FI (°F days/year) | 940 | |
| Freeze-thaw cycles per year | 124 | |
| Subgrade | Subgrade category | Coarse-grained |
| Percent material passing through No. 200 sieve | 25.7 | |
| Percent silt | 18.5 | |
| Percent clay | 7.2 | |
| Traffic | Average annual KESALs | 141 |
Table 59. Availability of IRI data for the Montana SPS-1 project.
| Section Numbers |
Age of Pavement (Years) | Time Span for Center of the Lane Data (Years) |
|
|---|---|---|---|
| When First Center of the Lane Data Collected |
When Last Center of the Lane Data Collected |
||
| 13–24 | 0.1 | 11.8 | 11.7 |

Figure 47. Graph. Change in IRI at test sections in the Montana SPS-1 project.

Figure 48. Graph. Rate of change of IRI at test sections in the Montana SPS-1 project.
The climatic and subgrade properties and annual KESALs at the Nevada SPS-1 project are shown in table 60. The time periods over which center of the lane data were available at the test sections in this project are shown in table 61. As shown in this table, the period over which test sections in this project were monitored varied. Figure 49 shows the change in IRI at the test sections over the monitored period, while figure 50 shows the rate of change of IRI at the test sections. The change in IRI at sections 2, 7, and 9 was much greater than the change in IRI at the other test sections. The change in IRI at the other test sections was less than 15 inches/mi for both MIRI and CLIRI, and the rate of change of IRI for these sections was less than 1 inch/mi/year for MIRI as well as CLIRI.
Table 60. Climatic and subgrade properties and traffic level for the Nevada SPS-1 project.
| Property | Parameter | Value |
|---|---|---|
| Climatic | Climatic region | DF |
| Annual precipitation (inches) | 10 | |
| Wet days per year | 77 | |
| Intense precipitation days per year | 3 | |
| Mean annual temperature (°F) | 51 | |
| Days above 90 °F per year | 76 | |
| Days below 32 °F per year | 167 | |
| FI (°F days/year) | 351 | |
| Freeze-thaw cycles per year | 158 | |
| Subgrade | Subgrade category | Coarse-grained |
| Percent material passing through No. 200 sieve | 45.1 | |
| Percent silt | 35.7 | |
| Percent clay | 9.4 | |
| Traffic | Average annual KESALs | 419 |
Table 61. Availability of IRI data for the Nevada SPS-1 project.
| Section Numbers |
Age of Pavement (Years) | Time Span for Center of the Lane Data (Years) |
|
|---|---|---|---|
| When First Center of the Lane Data Collected |
When Last Center of the Lane Data Collected |
||
| 2, 3, 5 | 1.6 | 8.6 | 7 |
| 8, 12 | 1.6 | 11 | 9.4 |
| 1 | 1.3 | 13.8 | 12.5 |
| 4, 6, 7, 9, 10, 11 | 1.6 | 13.8 | 12.2 |

Figure 49. Graph. Change in IRI at test sections in the Nevada SPS-1 project.

Figure 50. Graph. Rate of change of IRI at test sections in the Nevada SPS-1 project.
The climatic and subgrade properties and annual KESALs at the Virginia SPS-1 project are shown in table 62. The time periods over which center of the lane data were available at the test sections in this project are shown in table 63. As shown in this table, the period over which test sections in this project were monitored varied. Figure 51 shows the change in IRI at the test sections over the monitored period, while figure 52 shows the rate of change of IRI at the test sections. The change in MIRI was greater than the change in CLIRI at seven test sections. The rate of increase of IRI was less than 1 inch/mi/year at nine sections for both MIRI and CLIRI.
Table 62. Climatic and subgrade properties and traffic level for the Virginia SPS-1 project.
| Property | Parameter | Value |
|---|---|---|
| Climatic | Climatic region | WNF |
| Annual precipitation (inches) | 45 | |
| Wet days per year | 143 | |
| Intense precipitation days per year | 29 | |
| Mean annual temperature (°F) | 58 | |
| Days above 90 °F per year | 39 | |
| Days below 32 °F per year | 89 | |
| FI (°F days/year) | 92 | |
| Freeze-thaw cycles per year | 86 | |
| Subgrade | Subgrade category | Coarse-grained |
| Percent material passing through No. 200 sieve | 43.1 | |
| Percent silt | 30.7 | |
| Percent clay | 12.4 | |
| Traffic | Average annual KESALs | 210 |
Table 63. Availability of IRI data for the Virginia SPS-1 project.
| Section Numbers |
Age of Pavement (Years) | Time Span for Center of the Lane Data (Years) |
|
|---|---|---|---|
| When First Center of the Lane Data Collected |
When Last Center of the Lane Data Collected |
||
| 13 | 4.6 | 8.4 | 3.8 |
| 12–23 | 4.6 | 17.4 | 12.8 |
| 24 | 4.6 | 10.5 | 5.9 |

Figure 51. Graph. Change in IRI at test sections in the Virginia SPS-1 project.

Figure 52. Graph. Rate of change of IRI at test sections in the Virginia SPS-1 project.
The climatic and subgrade properties and annual KESALs at the Wisconsin SPS-1 project are shown in table 64. The time period over which center of the lane data were available at the test sections in this project is shown in table 65. All test sections in this project had data for the same time duration. Figure 53 shows the change in IRI at the test sections over the monitored period, while figure 54 shows the rate of change of IRI at the test sections. The change in MIRI was greater than the change in CLIRI at seven test sections. In this project, many test sections that were structurally stronger showed a greater increase in IRI than sections that were structurally weaker. The rate of increase of IRI was less than 2 inches/mi/year at seven test sections for MIRI and at eight test sections for CLIRI.
Table 64. Climatic and subgrade properties and traffic level for the Wisconsin SPS-1 project.
| Property | Parameter | Value |
|---|---|---|
| Climatic | Climatic region | WF |
| Annual precipitation (inches) | 32 | |
| Wet days per year | 156 | |
| Intense precipitation days per year | 16 | |
| Mean annual temperature (°F) | 43 | |
| Days above 90 °F per year | 3 | |
| Days below 32 °F per year | 173 | |
| FI (°F days/year) | 1613 | |
| Freeze-thaw cycles per year | 99 | |
| Subgrade | Subgrade category | Coarse-grained |
| Percent material passing through No. 200 sieve | 9.6 | |
| Percent silt | 7.1 | |
| Percent clay | 2.5 | |
| Traffic | Average annual KESALs | 331 |
Table 65. Availability of IRI data for the Wisconsin SPS-1 project.
| Section Numbers |
Age of Pavement (Years) | Time Span for Center of the Lane Data (Years) |
|
|---|---|---|---|
| When First Center of the Lane Data Collected |
When Last Center of the Lane Data Collected |
||
| 14–24 | 0.1 | 10.6 | 10.5 |

Figure 53. Graph. Change in IRI at test sections in the Wisconsin SPS-1 project.

Figure 54. Graph. Rate of change of IRI at test sections in the Wisconsin SPS-1 project.
This section describes roughness development at category 3 SPS-1 projects, which are the projects located in Alabama, Arizona, Arkansas, Delaware, New Mexico, and Ohio.
The climatic and subgrade properties and annual KESALs at the Alabama SPS-1 project are shown in table 66. The time periods over which center of the lane data were available at the test sections in this project are shown in table 67. Only two IRI values were available for section 7, which had been monitored for only 0.6 years. Section 2 had data over a 3.7-year period, while the other sections had data over a 7.8-year period. Figure 55 shows the change in IRI at the test sections over the monitored period, while figure 56 shows the rate of change of IRI at the test sections. Section 7 is not shown in either of these plots. Section 2, which was the weakest section, showed a large change in MIRI compared with other test sections. The change in MIRI was greater than the change in CLIRI at 10 test sections. The rate of increase of IRI was less than 1 inch/mi/year at 9 test sections for MIRI and 10 test sections for CLIRI.
Table 66. Climatic and subgrade properties and traffic level for the Alabama SPS-1 project.
| Property | Parameter | Value |
|---|---|---|
| Climatic | Climatic region | WNF |
| Annual precipitation (inches) | 52 | |
| Wet days per year | 160 | |
| Intense precipitation days per year | 32 | |
| Mean annual temperature (°F) | 64 | |
| Days above 90 °F per year | 51 | |
| Days below 32 °F per year | 43 | |
| FI (°F days/year) | 16 | |
| Freeze-thaw cycles per year | 43 | |
| Subgrade | Subgrade category | Fine-grained |
| Percent material passing through No. 200 sieve | 40.5 | |
| Percent silt | 26 | |
| Percent clay | 66.5 | |
| PI | 16.7 | |
| Traffic | Average annual KESALs | 384 |
Table 67. Availability of IRI data for the Alabama SPS-1 project.
| Section Numbers |
Age of Pavement (Years) | Time Span for Center of the Lane Data (Years) |
|
|---|---|---|---|
| When First Center of the Lane Data Collected |
When Last Center of the Lane Data Collected |
||
| 2 | 4.3 | 8.0 | 3.7 |
| 7 | 4.3 | 4.9 | 0.6 |
| 1, 3–6, 8–12 | 4.3 | 12.2 | 7.9 |

Figure 55. Graph. Change in IRI at test sections in the Alabama SPS-1 project.

Figure 56. Graph. Rate of change of IRI at test sections in the Alabama SPS-1 project.
The climatic and subgrade properties and annual KESALs at the Arizona SPS-1 project are shown in table 68. The time periods over which center of the lane data were available at the test sections in this project are shown in table 69. As shown in this table, one group of sections had data over a 5.1-year period, while the other group had data over a 9.2-year period. Figure 57 and figure 58 show the change in IRI for sections that had data over a 5.1-year and 9.2-year period, respectively. Figure 59 and figure 60 show the rate of change of IRI for sections that had data over a 5.1-year and 9.2-year period, respectively. When considering all sections, the change in MIRI was greater than the change in CLIRI at 11 test sections. When considering all sections, the rate of increase of CLIRI was less than 2 inches/mi/year at all test sections and less than 1 inch/mi/year at nine sections.
Table 68. Climatic and subgrade properties and traffic level for the Arizona SPS-1 project.
| Property | Parameter | Value |
|---|---|---|
| Climatic | Climatic region | DNF |
| Annual precipitation (inches) | 7 | |
| Wet days per year | 56 | |
| Intense precipitation days per year | 3 | |
| Mean annual temperature (°F) | 67 | |
| Days above 90 °F per year | 138 | |
| Days below 32 °F per year | 19 | |
| FI (°F days/year) | 0 | |
| Freeze-thaw cycles per year | 19 | |
| Subgrade | Subgrade category | Coarse-grained |
| Percent material passing through No. 200 sieve | 16.5 | |
| Percent silt | 10.8 | |
| Percent clay | 5.7 | |
| Traffic | Average annual KESALs | 265 |
Table 69. Availability of IRI data for the Arizona SPS-1 project.
| Section Numbers |
Age of Pavement (Years) | Time Span for Center of the Lane Data (Years) |
|
|---|---|---|---|
| When First Center of the Lane Data Collected |
When Last Center of the Lane Data Collected |
||
| 15, 17, 19, 23, 24 | 3.5 | 12.7 | 9.2 |
| 13, 14, 16, 18, 21, 22 | 3.5 | 8.6 | 5.1 |

Figure 57. Graph. Change in IRI at test sections in the Arizona SPS-1 project that had data over a 5.1-year period.

Figure 58. Graph. Change in IRI at test sections in the Arizona SPS-1 project that had data over a 9.2-year period.

Figure 59. Graph. Rate of change of IRI at test sections in the Arizona SPS-1 project that had data over a 5.1-year period.

Figure 60. Graph. Rate of change of IRI at test sections in the Arizona SPS-1 project that had data over a 9.2-year period.
The climatic and subgrade properties and annual KESALs at the Arkansas SPS-1 project are shown in table 70. The time periods over which center of the lane data were available at the test sections in this project are shown in table 71. As shown in this table, no data were available for sections 19 and 20, section 21 had data over a 6.9-year period, and the other sections had data over a 9.9-year period. Figure 61 shows the change in IRI at the test sections over the monitored period, while figure 62 shows the rate of change of IRI at the test sections. The change in MIRI was greater than the change in CLIRI at all test sections. The rate of increase of CLIRI was less than 1.6 inches/mi/year at all test sections and less than 1 inch/mi/year at five test sections. The rate of increase of MIRI was less than 2 inches/mi/year for four test sections.
Table 70. Climatic and subgrade properties and traffic level for the Arkansas SPS-1 project.
| Property | Parameter | Value |
|---|---|---|
| Climatic | Climatic region | WNF |
| Annual precipitation (inches) | 47 | |
| Wet days per year | 129 | |
| Intense precipitation days per year | 32 | |
| Mean annual temperature (°F) | 61 | |
| Days above 90 °F per year | 56 | |
| Days below 32 °F per year | 63 | |
| FI (°F days/year) | 115 | |
| Freeze-thaw cycles per year | 56 | |
| Subgrade | Subgrade category | Coarse-grained |
| Percent material passing through No. 200 sieve | 18.1 | |
| Percent silt | 12.7 | |
| Percent clay | 5.4 | |
| Traffic | Average annual KESALs | 416 |
Table 71. Availability of IRI data for the Arkansas SPS-1 project.
| Section Numbers |
Age of Pavement (Years) | Time Span for Center of the Lane Data (Years) |
|
|---|---|---|---|
| When First Center of the Lane Data Collected |
When Last Center of the Lane Data Collected |
||
| 21 | 2.8 | 9.6 | 6.8 |
| 13–20 and 22–24 | 2.8 | 12.7 | 9.9 |
| Note: No data for sections 19 and 20. | |||

Figure 61. Graph. Change in IRI at test sections in the Arkansas SPS-1 project.

Figure 62. Graph. Rate of change of IRI at test sections in the Arkansas SPS-1 project.
The climatic and subgrade properties and annual KESALs at the Delaware SPS-1 project are shown in table 72. The time period over which center of the lane data were available at the test sections in this project is shown in table 73. All test sections in this project had data over a 9-year period. Figure 63 shows the change in IRI at the test sections over the monitored period, while figure 64 shows the rate of change of IRI at the test sections. MIRI as well as CLIRI showed variability over the monitored period at all test sections. For example, for section 10, the first and last CLIRI values were both 44 inches/mi. However, over the monitored period, CLIRI ranged from 37 to 51 inches/mi. Hence, for this section, the change in CLIRI over the monitored period was 0; however, the best fit line on the data points indicated the rate of change of CLIRI was 1.03 inches/mi/year. Consequently, in figure 63, MIRI and CLIRI show little change for the structurally strongest eight test sections, but in figure 64, the rate of change of IRI for these test sections shows values up to about 1inch/mi/year. The absolute change in MIRI was greater than the change in CLIRI at seven test sections. The rate of increase of CLIRI was less than 1.2inches/mi/year at all test sections, while the rate of increase of MIRI was less than 2 inches/mi/year at 10 test sections.
Table 72. Climatic and subgrade properties and traffic level for the Delaware SPS-1 project.
| Property | Parameter | Value |
|---|---|---|
| Climatic | Climatic region | WNF |
| Annual precipitation (inches) | 48 | |
| Wet days per year | 153 | |
| Intense precipitation days per year | 31 | |
| Mean annual temperature (°F) | 56 | |
| Days above 90 °F per year | 15 | |
| Days below 32 °F per year | 81 | |
| Freeze Index (°F days/year) | 148 | |
| Freeze-thaw cycles per year | 73 | |
| Subgrade | Subgrade category | Coarse-grained |
| Percent material passing through No. 200 sieve | 25.5 | |
| Percent silt | 16.5 | |
| Percent clay | 9 | |
| Traffic | Average annual KESALs | 384 |
Table 73. Availability of IRI data for the Delaware SPS-1 project.
| Section Numbers |
Age of Pavement (Years) | Time Span for Center of the Lane Data (Years) |
|
|---|---|---|---|
| When First Center of the Lane Data Collected |
When Last Center of the Lane Data Collected |
||
| 1–12 | 1.1 | 10.1 | 9 |

Figure 63. Graph. Change in IRI at test sections in the Delaware SPS-1 project.

Figure 64. Graph. Rate of change of IRI at test sections in the Delaware SPS-1 project.
The climatic and subgrade properties and annual KESALs at the New Mexico SPS-1 project are shown in table 74. The time period over which center of the lane data were available at the test sections in this project is shown in table 75. All test sections in this project had data over a 9.1‑year period. Figure 65 shows the change in IRI at the test sections over the monitored period, while figure 66 shows the rate of change of IRI at the test sections. The change in MIRI was greater than the change in CLIRI at three test sections. The change in MIRI and CLIRI as well as the rate of increase of MIRI and CLIRI were close to each other at all test sections. The rate of change of MRI and CLIRI was greater than 2 inches/mi/year at all test sections. The highest median rate of increase of CLIRI for an SPS-1 project occurred at the New Mexico project (see table 49). Raveling was recorded at all test sections in the New Mexico project during the distress surveys that were performed close to the last profile date. The high rate of increase of CLIRI was attributed to the raveling that was present on the pavement. The first and last dates when center of the lane data were collected at section 12 in this project were 3/11/1997 and 4/24/2006, respectively, and CLIRI for these two dates were 38 and 94 inches/mi, respectively. Figure 67 shows a plot of the profile data collected for these two dates over a portion of the project that were filtered to remove wavelength content greater than 50 ft in order to see details of the profile clearly. The high scatter in the data points in the profile data collected on 4/24/2006 when compared with data collected on 3/11/1997 was attributed to the raveling of the pavement surface. Raveling was believed to be a major contributor to the increases in MIRI and CLIRI at the test sections in this project.
Table 74. Climatic and subgrade properties and traffic level for the New Mexico SPS-1 project.
| Property | Parameter | Value |
|---|---|---|
| Climatic | Climatic region | DNF |
| Annual precipitation (inches) | 10 | |
| Wet days per year | 73 | |
| Intense precipitation days per year | 3 | |
| Mean annual temperature (°F) | 62 | |
| Days above 90 °F per year | 103 | |
| Days below 32 °F per year | 93 | |
| FI (°F days/year) | 11 | |
| Freeze-thaw cycles per year | 93 | |
| Subgrade | Subgrade category | Fine-Grained |
| Percent material passing through No. 200 sieve | 35.1 | |
| Percent silt | 27.3 | |
| Percent clay | 62.4 | |
| PI | 30 | |
| Traffic | Average annual KESALs | 129 |
Table 75. Availability of IRI data for the New Mexico SPS-1 project.
| Section Numbers |
Age of Pavement (Years) | Time Span for Center of the Lane Data (Years) |
|
|---|---|---|---|
| When First Center of the Lane Data Collected |
When Last Center of the Lane Data Collected |
||
| 1–12 | 1.4 | 10.5 | 9.1 |

Figure 65. Graph. Change in IRI at test sections in the New Mexico SPS-1 project.

Figure 66. Graph. Rate of change of IRI at test sections in the New Mexico SPS-1 project.

Figure 67. Graph. Center of the lane profile data collected at section 12 in the New Mexico project for two different test dates.
The climatic and subgrade properties and annual KESALs at the Ohio SPS-1 project are shown in table 76. The time periods over which center of the lane data were available at the test sections in this project are shown in table 77. No data were available for four test sections in this project. The period over which the other sections were monitored ranged from 3 to 13.6 years. Figure 68 shows the change in IRI at the test sections over the monitored period, while figure 69 shows the rate of change of IRI at the test sections. The change in MIRI was greater than the change in CLIRI at all but one test section. The rate of increase of MIRI and CLIRI was greater than 4 inches/mi/year at all test sections.
Table 76. Climatic and subgrade properties and traffic level for the Ohio SPS-1 project.
| Property | Parameter | Value |
|---|---|---|
| Climatic | Climatic region | WF |
| Annual precipitation (inches) | 42 | |
| Wet days per year | 178 | |
| Intense precipitation days per year | 24 | |
| Mean annual temperature (°F) | 52 | |
| Days above 90 °F per year | 11 | |
| Days below 32 °F per year | 117 | |
| FI (°F days/year) | 578 | |
| Freeze-thaw cycles per year | 82 | |
| Subgrade | Subgrade category | Fine-grained |
| Percent material passing through No. 200 sieve | 71.2 | |
| Percent silt | 42.8 | |
| Percent clay | 28.4 | |
| PI | 15 | |
| Traffic | Average annual KESALs | 485 |
Table 77. Availability of IRI data for the Ohio SPS-1 project.
| Section Numbers |
Age of Pavement (Years) | Time Span for Center of the Lane Data (Years) |
|
|---|---|---|---|
| When First Center of the Lane Data Collected |
When Last Center of the Lane Data Collected |
||
| 3, 8–10 | 3 | 6 | 3 |
| 11 | 3 | 10.8 | 7.8 |
| 6 | 3 | 12.7 | 9.7 |
| 4, 12 | 3 | 16.6 | 13.6 |
| Note: No data for sections 1, 2, 5, and 7. | |||

Figure 68. Graph. Change in IRI at test sections in the Ohio SPS-1 project.

Figure 69. Graph. Rate of change of IRI at test sections in the Ohio SPS-1 project.
This section describes roughness development at category 4 SPS-1 projects, which are the projects located in Iowa, Kansas, Michigan, Nebraska, and Texas.
The climatic and subgrade properties and annual KESALs at the Iowa SPS-1 project are shown in table 78. The time period over which center of the lane data were available at the test sections in this project is shown in table 79. All sections had data for a 3.7-year period. Figure 70 shows the change in IRI at the test sections over this period, while figure 71 shows the rate of change of IRI at the test sections. The change in MIRI was greater than the change in CLIRI at all test sections. A rate of increase of IRI less than 2 inches/mi/year was noted for MIRI and CLIRI for two and four test sections, respectively. The weakest section in this project (i.e., section 7) had the least change in MIRI as well as CLIRI.
Table 78. Climatic and subgrade properties and traffic level at the Iowa SPS-1 project.
| Property | Parameter | Value |
|---|---|---|
| Climatic | Climatic region | WF |
| Annual precipitation (inches) | 41 | |
| Wet days per year | 156 | |
| Intense precipitation days per year | 25 | |
| Mean annual temperature (°F) | 52 | |
| Days above 90 °F per year | 14 | |
| Days below 32 °F per year | 113 | |
| FI (°F days/year) | 713 | |
| Freeze-thaw cycles per year | 76 | |
| Subgrade | Subgrade category | Fine-grained |
| Percent material passing through No. 200 sieve | 87.9 | |
| Percent silt | 56.8 | |
| Percent clay | 31.1 | |
| PI | 27.7 | |
| Traffic | Average annual KESALs | 133 |
Table 79. Availability of IRI data for the Iowa SPS-1 project.
| Section Numbers |
Age of Pavement (Years) | Time Span for Center of the Lane Data (Years) |
|
|---|---|---|---|
| When First Center of the Lane Data Collected |
When Last Center of the Lane Data Collected |
||
| 1–12 | 4.3 | 8 | 3.7 |

Figure 70. Graph. Change in IRI at the test sections in the Iowa SPS-1 project.

Figure 71. Graph. Rate of change of IRI at test sections in the Iowa SPS-1 project.
The climatic and subgrade properties and the annual KESALs at the Kansas SPS-1 project are shown in table 80. The time period over which center of the lane data were available at the test sections in this project is shown in table 81. No data were available for sections 1, 2, 5, 6, and 7, while the other sections had data over a 4.2-year period. Figure 72 shows the change in IRI at the test sections over this period, while figure 73 shows the rate of change of IRI at the test sections. The change in MIRI was greater than the change in CLIRI at all test sections. A rate of increase of IRI less than 2 inches/mi/year was noted for MIRI and CLIRI for one and six test sections, respectively.
Table 80. Climatic and subgrade properties and traffic level at the Kansas SPS-1 project.
| Property | Parameter | Value |
|---|---|---|
| Climatic | Climatic region | WF |
| Annual precipitation (inches) | 27 | |
| Wet days per year | 86 | |
| Intense precipitation days per year | 16 | |
| Mean annual temperature (°F) | 55 | |
| Days above 90 °F per year | 56 | |
| Days below 32 °F per year | 125 | |
| FI (°F days/year) | 394 | |
| Freeze-thaw cycles per year | 105 | |
| Subgrade | Subgrade category | Coarse-grained |
| Percent material passing through No. 200 sieve | 30.4 | |
| Percent silt | 18.9 | |
| Percent clay | 11.5 | |
| Traffic | Average annual KESALs | 255 |
Table 81. Availability of IRI data for the Kansas SPS-1 project.
| Section Numbers |
Age of Pavement (Years) | Time Span for Center of the Lane Data (Years) |
|
|---|---|---|---|
| When First Center of the Lane Data Collected |
When Last Center of the Lane Data Collected |
||
| 3, 4, 8–12 | 3.3 | 7.5 | 4.2 |
| Note: No data for sections 1, 2, 5, 6, and 7. | |||
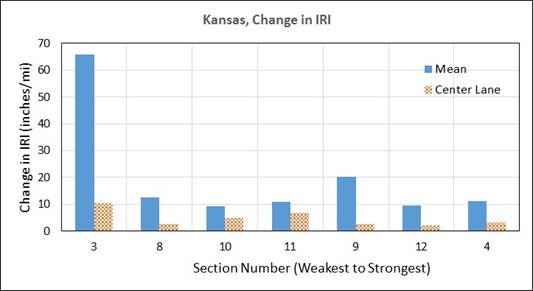
Figure 72. Graph. Change in IRI at test sections in the Kansas SPS-1 project.
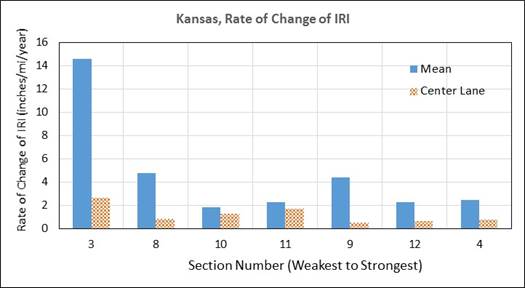
Figure 73. Graph. Rate of change of IRI at test sections in the Kansas SPS-1 project.
The climatic and subgrade properties and the annual KESALs at the Michigan SPS-1 project are shown in table 82. The time periods over which center of the lane data were available at the test sections in this project are shown in table 83. No data were available for four sections, while seven sections had data over a 5.2-year period, and one test section had data over a 3.6-year period. Figure 74 shows the change in IRI at the test sections over this period, while figure 75 shows the rate of change of IRI at the test sections. The change in MIRI was greater than the change in CLIRI at six out of the eight test sections. A rate of increase of IRI less than 2 inches/mi/year was noted for MRI and CLIRI for four and six test sections, respectively.
Table 82. Climatic and subgrade properties and traffic level at the Michigan SPS-1 project.
| Property | Parameter | Value |
|---|---|---|
| Climatic | Climatic region | WF |
| Annual precipitation (inches) | 32 | |
| Wet days per year | 142 | |
| Intense precipitation days per year | 18 | |
| Mean annual temperature (°F) | 49 | |
| Days above 90 °F per year | 9 | |
| Days below 32 °F per year | 136 | |
| FI (°F days/year) | 823 | |
| Freeze-thaw cycles per year | 86 | |
| Subgrade | Subgrade category | Fine-grained |
| Percent material passing through No. 200 sieve | 62.7 | |
| Percent silt | 39 | |
| Percent clay | 23.7 | |
| PI | 10.3 | |
| Traffic | Average annual KESALs | 364 |
Table 83. Availability of IRI data for the Michigan SPS-1 project.
| Section Numbers |
Age of Pavement (Years) | Time Span for Center of the Lane Data (Years) |
|
|---|---|---|---|
| When First Center of the Lane Data Collected |
When Last Center of the Lane Data Collected |
||
| 15–18, 20, 23, 24 | 1.4 | 6.6 | 5.2 |
| 21 | 3 | 6.6 | 3.6 |
| Note: No data for sections 13, 14, 19, and 22. | |||

Figure 74. Graph. Change in IRI at test sections in the Michigan SPS-1 project.
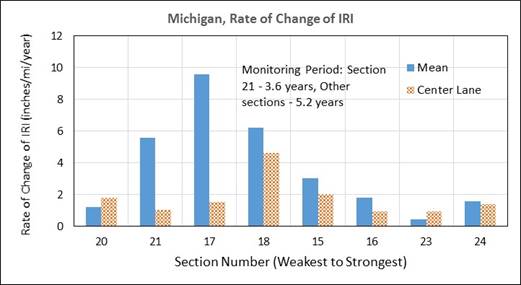
Figure 75. Graph. Rate of change of IRI at test sections in the Michigan SPS-1 project.
The climatic and subgrade properties and the annual KESALs at the Nebraska SPS-1 project are shown in table 84. The time period over which center of the lane data were available at the test sections in this project is shown in table 85. All sections had data over a 3-year period, with data collected five times at all test sections during this period. Figure 76 shows the change in IRI at the test sections over this period, while figure 77 shows the rate of change of IRI at the test sections. A rate of increase of IRI less than 2 inches/mi/year was noted for MRI and CLIRI for 10 and 7 test sections, respectively. At some sections, a negative rate of increase of MIRI or CLIRI was noted. The time-sequence data at these sections were variable and showed an overall weak trend of decreasing IRI values. However, the data at these sections were collected over a 3‑year period, so the observed trend might simply be the result of variability in the profiled paths and/or due to seasonal variability.
Table 84. Climatic and subgrade properties and traffic level at the Nebraska SPS-1 project.
| Property | Parameter | Value |
|---|---|---|
| Climatic | Climatic region | WF |
| Annual precipitation (inches) | 27 | |
| Wet days per year | 101 | |
| Intense precipitation days per year | 17 | |
| Mean annual temperature (°F) | 52 | |
| Days above 90 °F per year | 44 | |
| Days below 32 °F per year | 137 | |
| FI (°F days/year) | 671 | |
| Freeze-thaw cycles per year | 105 | |
| Subgrade | Subgrade category | Fine-grained |
| Percent material passing through No. 200 sieve | 98.9 | |
| Percent silt | 66.7 | |
| Percent clay | 32.2 | |
| PI | 20.3 | |
| Traffic | Average annual KESALs | 139 |
Table 85. Availability of IRI data for the Nebraska SPS-1 project.
| Section Numbers |
Age of Pavement (Years) | Time Span for Center of the Lane Data (Years) |
|
|---|---|---|---|
| When First Center of the Lane Data Collected |
When Last Center of the Lane Data Collected |
||
| 13–24 | 1.6 | 4.6 | 3 |
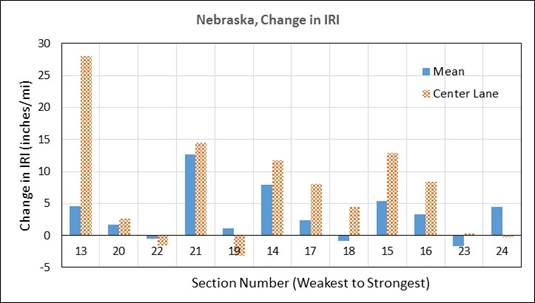
Figure 76. Graph. Change in IRI at test sections in the Nebraska SPS-1 project.
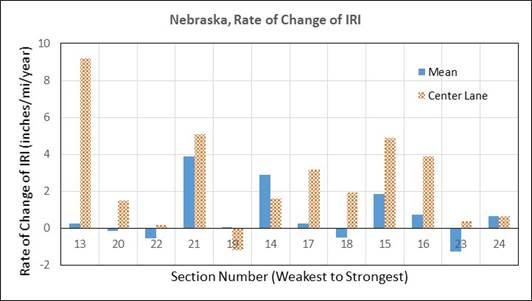
Figure 77. Graph. Rate of change of IRI at test sections in the Nebraska SPS-1 project.
The climatic and subgrade properties and the annual KESALs at the Texas SPS-1 project are shown in table 86. The time periods over which center of the lane data were available at the test sections in this project are shown in table 87. Four test sections had data over a 1.9-year period where the sections were profiled four times, while eight test sections had data over a 3.5-year period where the sections were profiled five times. Figure 78 shows the change in IRI at the test sections over this period, while figure 79 shows the rate of change of IRI at the test sections. Several sections had a lower MIRI as well as a CLIRI at the last date when compared with the first date. This resulted in a negative change in IRI as well as a negative rate of change of IRI. The data at the test sections in this project were collected over a very short time (i.e., 1.9 years or 3.5 years). Hence, the observed trend in the IRI values could be the result of the variability in the profiled path between the visits and/or seasonal variability. The largest change in IRI at the test sections was observed at section 24, where CLIRI increased by 16 inches/mi. MIRI at this section decreased by 6 inches/mi. This section had no distress, and the reason for the increase in CLIRI could not be determined from the profile data.
Table 86. Climatic and subgrade properties and traffic level at the Texas SPS-1 project.
| Property | Parameter | Value |
|---|---|---|
| Climatic | Climatic region | WNF |
| Annual precipitation (inches) | 24 | |
| Wet days per year | 100 | |
| Intense precipitation days per year | 13 | |
| Mean annual temperature (°F) | 75 | |
| Days above 90 °F per year | 158 | |
| Days below 32 °F per year | 1 | |
| FI (°F days/year) | 0 | |
| Freeze-thaw cycles per year | 1 | |
| Subgrade | Subgrade category | Coarse-grained |
| Percent material passing through No. 200 sieve | 11.7 | |
| Percent silt | 10.6 | |
| Percent clay | 1.1 | |
| Traffic | Average annual KESALs | 464 |
Table 87. Availability of IRI data for the Texas SPS-1 project.
| Section Numbers |
Age of Pavement (Years) | Time Span for Center of the Lane Data (Years) |
|
|---|---|---|---|
| When First Center of the Lane Data Collected |
When Last Center of the Lane Data Collected |
||
| 13, 17, 18, 20–24 | 0.8 | 4.3 | 3.5 |
| 14–16, 19 | 2.4 | 4.3 | 1.9 |

Figure 78. Graph. Change in IRI at test sections in the Texas SPS-1 project.

Figure 79. Graph. Rate of change of IRI at test sections in the Texas SPS-1 project.
This section describes roughness development at overlaid SPS-1 projects in Michigan and Texas.
The eight test sections in the Michigan SPS-1 project that were not deassigned were overlaid on 10/1/2002. Thereafter, these sections were overlaid again on 6/1/2012. The data collected on the test sections after the first overlay until the second overlay was placed were analyzed. The time period over which center of the lane data were available at the test sections after the overlay for this project is shown in table 88. Figure 80 shows the change in IRI at the test sections over this period, while figure 81 shows the rate of change of IRI at the test sections. Of the eight sections being monitored, the change in MIRI was greater than the change in CLIRI at five test sections.
Table 88. Availability of IRI data for the Michigan SPS-1 project after overlay.
| Section Numbers |
Age of Pavement (Years) | Time Span for Center of the Lane Data (Years) |
|
|---|---|---|---|
| When First Center of the Lane Data Collected |
When Last Center of the Lane Data Collected |
||
| 15–18, 20, 21, 23, 24 | 0.5 | 9.6 | 9.1 |

Figure 80. Graph. Change in IRI at the Michigan SPS-1 project after overlay.

Figure 81. Graph. Rate of change of IRI for sections in the Michigan SPS-1 project after overlay.
An overlay was placed on all test sections in the Texas SPS-1 project on 4/29/2002. Thereafter, these sections were overlaid again on 3/31/2007. The data collected at the test sections in this project after the first overlay until the second overlay was placed were analyzed. The time period over which center of the lane data were available at the test sections in this project is shown in
table 89. Figure 82 shows the change in IRI at the test sections over this period, while figure 83 shows the rate of change of IRI at the test sections. The change in MIRI was greater than the change in CLIRI at all test sections.
Table 89. Availability of IRI data for the Texas SPS-1 project after the overlay.
| Section Numbers |
Age of Pavement (Years) | Time Span for Center of the Lane Data (Years) |
|
|---|---|---|---|
| When First Center of the Lane Data Collected |
When Last Center of the Lane Data Collected |
||
| 13–24 | 1.1 | 4.9 | 3.8 |

Figure 82. Graph. Change in IRI at the Texas SPS-1 project after overlay.
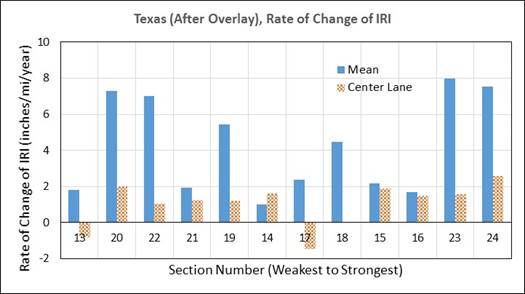
Figure 83. Graph. Rate of change of IRI for sections in the Texas SPS-1 project after overlay.

