U.S. Department of Transportation
Federal Highway Administration
1200 New Jersey Avenue, SE
Washington, DC 20590
202-366-4000
Federal Highway Administration Research and Technology
Coordinating, Developing, and Delivering Highway Transportation Innovations
 |
| This report is an archived publication and may contain dated technical, contact, and link information |
|
Publication Number: FHWA-RD-02-084 Date: May 2006 |
In conjunction with the visual surveys conducted on the various sites, cores were obtained from within each test patch on a regular basis to evaluate the durability of the concrete materials. As noted earlier, the original project plan called for obtaining the concrete cores in each of the 5 years during which performance was monitored. However, to protect the structural integrity of the patches, and to preserve their condition, the coring plan was revised to taking cores only in alternate years. Therefore, cores were obtained only in 1994, 1996, and 1998 from most of the patches with the exception of the patch located in Arkansas. From this section, only two sets of cores could be obtained, one in 1994 and the other in 1995, just before the pavement was overlaid.
The cores were subjected to tests for compressive strength, modulus of elasticity, rapid chloride permeability, and AC impedance. Wherever possible, companion cores were obtained from the patches so that replicate testing could be performed for each test type. Table 7 summarizes the types of tests performed at each location, along with the year in which the tests were performed. (For brevity, the frequency and types of AC impedance testing performed are not sHown in the table.) Many AC impedance tests were carried out in this study, using numerous combinations of test parameters. Further discussion of AC impedance testing is provided later in the report.
The gaps in table 7 indicate instances when it was not possible to perform some of the testing. Furthermore, as noted in the table, each test patch in North Carolina was treated separately, and coring was done accordingly. Recall that multiple patches were constructed in North Carolina to determine the effects of different kinds of coarse aggregates and water reducers on the performance of concrete. Naphthalene (N) and melamine (M) water reducers were used along with crushed granite (G) and marine marl (MM) to set up the four experiments: NM, NG, MM, and MG.
Prior to the origination of this contract, cores were obtained at 28 days and 6, 12, and 18 months for comparison with cylinder strengths; their corresponding test results were documented in SHRP C-364. These data were also used in the analysis presented in this report.
As noted earlier, four types of laboratory testing were performed on the cores retrieved from the field sites. A brief description of the significance of each test in relation to the main objective of this study is presented below. The protocols that were followed to estimate the respective property values are also presented.
| Location | Insulated Sections | Uninsulated Sections | ||||||||||||||||
|---|---|---|---|---|---|---|---|---|---|---|---|---|---|---|---|---|---|---|
| Compressive Strength | Modulus of Elasticity | RCPT | Compressive Strength | Modulus of Elasticity | RCPT | |||||||||||||
| 1995 | 1997 | 1999 | 1995 | 1997 | 1999 | 1995 | 1997 | 1999 | 1995 | 1997 | 1999 | 1995 | 1997 | 1999 | 1995 | 1997 | 1999 | |
| New York | X | X | X | – | X | X | X | X | X | – | – | – | – | – | – | – | – | – |
| North Carolina | ||||||||||||||||||
| NM | X | X | X | X | X | X | X | X | ||||||||||
| NG | X | X | X | – | X | X | X | X | X | X | X | X | – | X | X | X | X | X |
| MG | X | X | X | X | X | X | X | X | X | X | X | X | X | X | X | X | ||
| MM | X | X | X | X | X | X | X | X | X | X | ||||||||
| Illinois | X | X | X | – | X | X | X | X | X | X | X | X | – | X | X | X | X | X |
| Arkansas1 | X | X | – | X | – | X | X | – | X | X | – | – | X | – | X | X | – | |
| Nebraska | X | X | X | – | X | X | X | X | X | X | X | X | – | X | X | X | X | X |
1 The cores designated as being tested in 1997 were actually obtained in 1995. This was accounted for in the data analysis.
"X" indicates test was performed; – indicates test was not performed. Gaps in text indicate instances when it was not possible to perform testing.
Compressive Strength and Elastic Modulus Testing
In this study, the compressive strength and elastic modulus of concrete were used as surrogate indicators of material durability. Sound concrete with no materials-related problems is expected to gain strength and, to a lesser degree, modulus over time because of the continuing hydration process. The onset of any materials durability-related distress such as durability- (D-) cracking or ASR leads to the deterioration of concrete and results in the development of cracks in the cement paste and the aggregates. This causes a drop in the compressive strength and elastic modulus values. Therefore, by periodically monitoring the rate of strength and modulus gain (or drop), any durability-related problems can be detected.
All of the compressive strength and elastic modulus tests were conducted after removing the top and bottom portions of the 100-mm-diameter (4-inch-diameter) cores, to form 200-mm-long (8-inch-long) specimens. The ends were capped with a sulfur-based capping compound and tested to failure in compression in accordance with ASTM C 39 for compressive strength and ASTM C 469 for elastic modulus. To represent their condition in the pavement more accurately, the cores were not soaked before testing.
Rapid Chloride Permeability Testing
The rapid chloride permeability test (RCPT) indicates the ability of the concrete to resist the penetration of chloride ions. Chloride ions may enter into the concrete from three major sources: set accelerating admixtures, deicing salts, and seawater and salt spray.(2) AltHough the ingress of these ions into concrete is primarily detrimental to the performance of the embedded steel, it can also produce durability problems in concrete such as salt scaling and map cracking. The test measures the amount of charge passed when a 60-volt DC electrical potential is placed across a concrete specimen for a 6-Hour period. The greater the charge, the lower is the resistance of the concrete to chloride ion ingress, and therefore the greater the potential for materials-related problems. Therefore, the RCPT values over time can give an indication of the durability of concrete.
The rapid chloride permeability tests were carried out on 100-mm-diameter (4-inch-diameter) specimens cut from the area between 12.5 and 62.5 mm (0.5 and 2.5 in.) from the top of the core, and from 12.5 to 62.5 mm (0.5 to 2.5 in.) from the bottom of the core, where applicable. Note that the bottoms of the cores have only been tested since 1997. The outside of the specimens was coated in epoxy, vacuum-saturated, and tested according to ASTM C 1202.
AC Impedance Testing
AC impedance testing was considered in the original SHRP study as a reasonable alternative to the RCPT for more rapid determination of concrete permeability. The goal was to explore a faster metHod that could be more versatile and portable.(1) The AC impedance test values have an inverse relationship to the RCPT values.
In the original SHRP study, the AC impedance testing was conducted using a Kohlrausch bridge instrument. The Kohlrausch bridge uses a 1000-Hz AC frequency. The electrical connection between the Kohlrausch bridge terminals and the concrete specimens was ensured using potassium agar gel. The impedance measurement was measured at five random points on each specimen. In the present study, a slightly different test setup used a programmable potentiostat in place of the Kohlrausch bridge. Other setup variables such as the frequency of the current and the electrical coupling between the potentiostat and the concrete specimen were also varied in an effort to establish a reasonable correlation with the RCPT measurements. Based on this experimentation, it was decided that the impedance values obtained at a frequency of 100 Hz AC using a Nilsson soil resistance meter in two-pin mode provided the best correlation with the RCPT measurements. These values are reported in this study.
The results from the various tests conducted are analyzed and presented in this section. In order to make the data more meaningful and to draw broad-based conclusions, the concrete core and cylinder test data from report SHRP-C-364 were merged with the database compiled from this study.(1)
A major task in this study was to conduct field studies to investigate How HES concrete mix properties and field conditions influence durability and, hence, performance. A measure of durability was obtained by monitoring the following properties:
A list of the durability indicator data available and used for investigation and analysis has already been presented in table 7. The first step in assessing the durability of HES concrete was to conduct a comprehensive bivariate analysis. The bivariate analysis consisted of plots of the various durability indicator variables with concrete age. These plots were used for observing trends of the durability indicator variables (dependent variable) over the performance monitoring period, which was approximately 7 to 9 years for the sites evaluated. Bivariate statistics measure the degree of dependence between two variables (dependent and independent). They also sHow the trends and changes in the value of the dependent variable as the level of the independent variable is varied. For this study, the dependent variable was a durability indicator variable and the independent variables were the climate, construction, or materials-related variables or cluster of variables that could influence the concrete's long-term durability.
Results of the bivariate analysis were presented in the form of plots of the durability indicator variables against age for the different levels of the independent variables being evaluated. Simple statistical regression curves, trend lines, and correlation coefficients were also developed, where necessary. The plots visually sHow the effect of the independent variables under investigation on the durability indicators. They were used to determine if the trends observed were reasonable and as expected from mechanistic analysis, engineering judgment, and past empirical analyses. However, because bivariate plots present the effects of only a single independent variable on the durability indicator, their effect on the durability indicator variable can be confounded by the effects of other independent variables not considered. This could lead to contradictory and misleading results. Observations from bivariate plots are therefore preliminary in nature and cannot be conclusive.(3)
More sophisticated statistical tools such as analysis of variance (ANOVA) were also used to investigate the effect of the independent variables on durability. ANOVA determines whether differences in observed trends were statistically significant by determining the significance of each independent variable included in a linear regression model used to predict the given durability indicator. The linear regression models used for ANOVA are designed based on the hypothesis to be tested (e.g., the significance of a given independent variable).
ANOVA models are versatile statistical tools for studying the relationship between a dependent variable (durability indicator variable) and one or more independent variables (e.g., climate). They do not require making assumptions about the nature of the statistical relationship, nor do they require that the independent variables be quantitative. ANOVA models are generally used for applications where the effects of one or more independent variables on the dependent variable are of interest. Independent variables in the models for ANOVA are mostly called factors or treatments. For example, for this study, the independent variable (aggregate type) had three factors, levels, or treatments (limestone, marine marl, and crushed granite). The basic ANOVA procedures used in this study for determining the effects of several factors on the dependent variables are summarized as follows(3):
Determine all independent variables to be analyzed and transform the continuous independent variables into classification variables.
Develop ANOVA models for predicting each durability indicator variable to be analyzed. The models must be based on a specific experimental design to determine the effect of a specific group of independent variables on the durability indicator.
Perform ANOVA; using the models developed, test the hypotheses (the effect of curing metHod on durability, the effect of aggregate type on durability); and then determine if there is a significant difference in RCPT results from the top and bottom portions of a given core specimen.
The procedure outlined is simple and suits the purposes of most simple analysis of variance. Key elements of the ANOVA procedure are further explained in the following sections.
ANOVA models are basic, type I statistical models. They are concerned, like regression models, with the statistical relation between one or more independent variables and a dependent variable. Like regression models, ANOVA models are appropriate for both observational data and data based on formal experiments. Further, like the usual regression models, the dependent variable for ANOVA models is a quantitative variable. However, they differ from ordinary regression models in two key respects. First, the independent variables in the ANOVA model can be qualitative (e.g., aggregate type). Second, if the independent variables are quantitative, no assumption is made in the ANOVA models about the nature of the statistical relation between them. (3)
Hypothesis Testing
The goal of ANOVA is to compare means of the response variable (durability indicator) for various combinations of the classification variables (e.g., aggregate type and curing metHod). The effect and significance of the variables on performance can be confirmed or verified by comparing the level of significance of the variables to a predetermined level of significance, called p-value. ANOVA determines if there is a statistical difference in the mean values of the distress for the different classes of the independent variables in the model. The mean level of the distress for the different regression model classes gives an indication of whether the independent variable has a positive or negative effect on the distress. The following example illustrates the ANOVA technique.
| Treatment or factor (aggregate type): | limestone granite |
| Durability indicator (compressive strength): | class (limestone) = μLS class (granite)= μGR |
The significance of the effect of aggregate type on the given durability indicator is determined by the following test of hypothesis:
|
Based on a significance level (p-value) of 5 percent (0.05), a p-value of less than 0.05 rejects the null hypothesis, whereas a result greater than 0.05 confirms the null hypothesis. A comparison of the magnitude of the means determines the nature of the effect of the independent variable (in this case, aggregate type) on the durability indicator.
This section presents the results of both the bivariate analysis and a more detailed analysis of variance used in the investigation of the influence of climate and concrete mix properties on durability.
Experimental Design
For both the bivariate analysis and ANOVA, the effects of climate, construction, and mix properties on durability were investigated by grouping the data according to climate and mix properties. This was because relatively few data were available, as sHown in table 7. To keep the individual evaluation data sets to a minimum size, engineering judgment was used to divide the data intelligently. Each of these divisions was specific to the durability indicator being investigated and is described in greater detail in later sections of this chapter.
Climatic region was defined using the mean annual precipitation, mean annual air freeze-thaw cycles, and the mean annual freezing index of the sites; mix properties were defined using the aggregate type. Table 8 presents an example of the matrix of site and material properties used in grouping the test sites for analysis.
Bivariate Analysis–Compressive Strength
Figures 1 through 5 sHow the strength development history for the five sites analyzed. The plots sHow the effects of curing condition, specimen type (cylinder or core), strength at key ages, and site or climate. The specimen type describes whether the test data came from cores obtained from the concrete slabs or came from cylinders cast in foam boards using concrete samples obtained during slab placement.
The data presented in figures 1 through 5 sHow no consistent trend in compressive strength in either insulated or uninsulated sections. However, the compressive strengths from cylinders (insulated or uninsulated) were generally higher than tHose from cores. The comparison of core and cylinder compressive strength was limited to data representing the age range from 28 days to 18 months because there were no data for cores outside this age range. For North Carolina, compressive strength was plotted according to aggregate type and water reducer types to determine their effect on strength gain, as sHown in figure 3.
| Precipitation (Wet > 20 in./yr) | Temperature (Freeze Index) |
Freeze-Thaw Cycles | Aggregate Type | Sites |
|---|---|---|---|---|
| Wet | Freeze | < 100 | Limestone | Illinois |
| Crushed granite | – | |||
| Marine marl | – | |||
| >100 | Limestone | Nebraska, New York | ||
| Crushed granite | – | |||
| Marine marl | – | |||
| No freeze | < 100 | Limestone | Arkansas | |
| Crushed granite | North Carolina | |||
| Marine marl | North Carolina | |||
| >100 | Limestone | – | ||
| Crushed granite | – | |||
| Marine marl | – | |||
| Dry | Freeze | < 100 | Limestone | Illinois |
| Crushed granite | – | |||
| Marine marl | – | |||
| >100 | Limestone | Nebraska, New York | ||
| Crushed granite | – | |||
| Marine marl | – | |||
| No freeze | < 100 | Limestone | Arkansas | |
| Crushed granite | North Carolina | |||
| Marine marl | North Carolina | |||
| >100 | Limestone | – | ||
| Crushed granite | – | |||
| Marine marl | – | |||
| 1 inch = 25.4 mm; 0 °C = 32 °F | ||||
| Freeze Index: Freeze > 277 °C degree-days No freeze < 277 °C degree-days |
||||
The number of degree-days is the sum of the total number of degrees below freezing on each day when the average daily temperature is below freezing. For instance, if the average daily temperature is below freezing for 90 days per year, and the number of degrees Celsius below freezing is 2 per day, then the number of degree-days is 180 and the area is considered no freeze. This definition is explained in an equation in the Long-Term Pavement Performance Information Management System Pavement Performance Database User Reference Guide, FHWA-RD-03-088–see page 34 of the PDF version of the following: http://www.tfhrc.gov/pavement/ltpp/reports/03088/index.htm
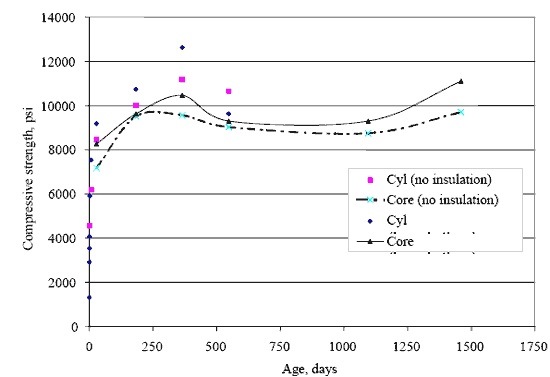
Figure 1. Graph. Plot of compressive strength versus age for test site in Arkansas.

Figure 2. Graph. Plot of compressive strength versus age for test site in Illinois.
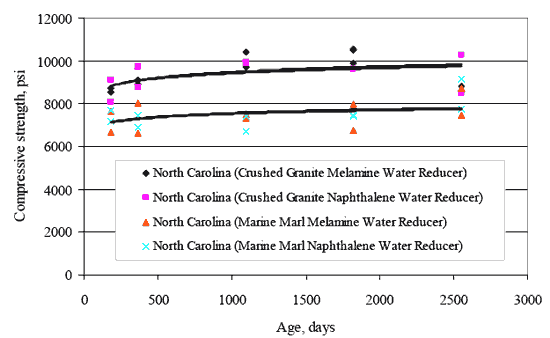
Figure 3. Graph. Plot of strength gain for the different experiments
(aggregate type and water reducer type) in North Carolina.
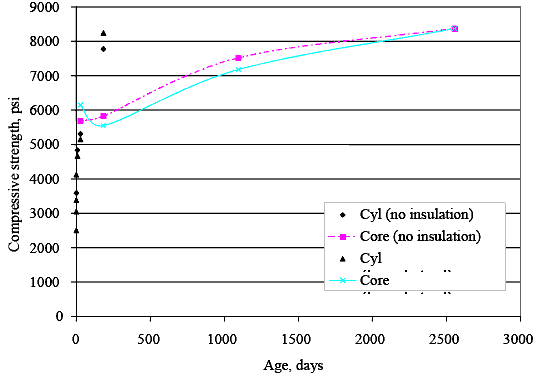
Figure 4. Graph. Plot of compressive strength versus age for test site in Nebraska.
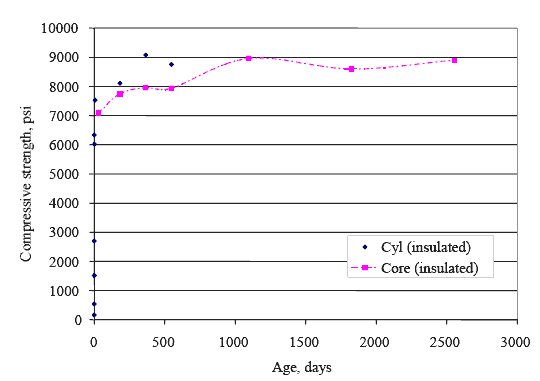
Figure 5. Graph. Plot of compressive strength versus age for test site
in New York (data available for insulated sections only).
The plots in figure 3 sHow that the water reducer type generally has no effect on strength development. For both aggregates types (crushed granite and marine marl), the type of water reducer used (melamine or naphthalene) did not influence the magnitude of compressive strength or the rate of strength gain. However, figure 3 sHows that the aggregate type does have an influence on the magnitude of compressive strength achieved (not strength gain). The mixes with crushed granite consistently had 16- to 22-percent higher strength values over the 7-year period evaluated.
As observed from the cores taken from Arkansas and Illinois, medium- to long-term strength development sHowed significant variations in the post-18-month strength; tHose from North Carolina, New York, and Nebraska sHowed relatively little variability and increased with age as expected. In general, the 5- to 7-year strengths for cores were greater than 55.2 MPa (8,000 psi), with the exception of the data from Illinois, which exhibited a significant drop in strength from a high of over 69 MPa (10,000 psi) after 5 years to between 41.4 and 51.7 MPa (6,000 and 7,500 psi) after 7 years. The reason for this drop was not obvious. Table 9 presents a summary of the 1-day to 7-year concrete compressive strength and the 7-year to 28-day mean compressive strength for the combined data (insulated and uninsulated).
For HES concrete, the minimum compressive strength after 24 Hours sHould be 34.5 MPa (5,000 psi). This was achieved for most of the sites examined, with the exceptions of Illinois and Nebraska. The lower strengths in Illinois were caused by problems encountered during concrete placement and construction; tHose in Nebraska were caused by the use of a low coarse-aggregate content in the mixes to limit potential aggregate-related durability problems.
Table 9 also sHows that the rate of strength gain was generally higher for mixes with limestone (10 to 20 percent) than tHose with crushed granite and marine marl. Nevertheless, the low rate of strength gain could have been caused by many factors, including climate.
| State | Aggregate Type | Mean Core Compressive Strength, psi | Percent Strength Gain (28-day to 7-yr) | ||
|---|---|---|---|---|---|
| 1-day* | 28-day | 7-yr** | |||
| Arkansas | Limestone | 6223 | 7010 | 8078 | 15.22 |
| Illinois | Limestone | 4453 | 5260 | 6353 | 20.78 |
| Nebraska | Limestone | 3883 | 4586 | 5539 | 20.77 |
| New York | Limestone | 5742 | 6297 | 7050 | 11.95 |
| North Carolina | Crushed granite | 6831 | 7385 | 8136 | 10.16 |
| Marine marl | 5852 | 6200 | 6673 | 7.62 | |
*1-day compressive strength was backcasted from the longer-term data.
** 7-yr strength for Arkansas was forecasted.
1 kPa = 6.9 psi
The relationship between compressive strength obtained from cores and cylinders was also investigated. Core and cylinder compressive strength data were only available for the test pavement in New York, so the analysis was limited to only this site. The plot of compressive strength from cores and cylinders is presented in figure 6. Figure 6 sHows a good relationship between the compressive strength values with a coefficient of determination R2 value of 49 percent. Even tHough the magnitudes of compressive strength were close, compressive strength obtained from cores tended to be lower than tHose from cylinders.
Bivariate Analysis–Static Elastic Modulus
Figure 7 sHows the static elastic modulus history for the three aggregate types analyzed. The figure sHows that there was a slight decrease in moduli for crushed granite and limestone for the period 5 to 7 years while the moduli for marine marl remained constant. Even tHough an increase in moduli is typical for the ages evaluated, the data available were limited, and no firm conclusions could be reached.
The relationship between compressive strength and static elastic modulus was also investigated by estimating elastic modulus using the model form(2):
![]() (1)
(1)
where
EPCC = static modulus of elasticity
α = regression constant (57,000 for conventional concrete)
fc = compressive strength
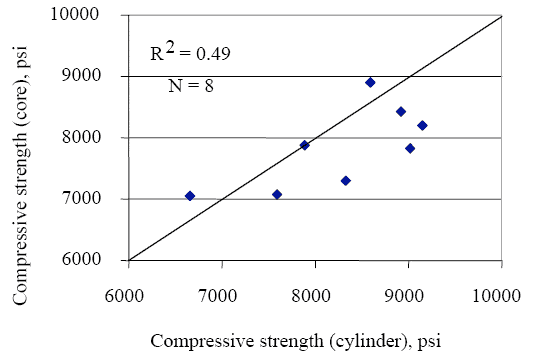
Figure 6. Graph. Plot of cores' compressive strength versus cylinders' compressive strength.
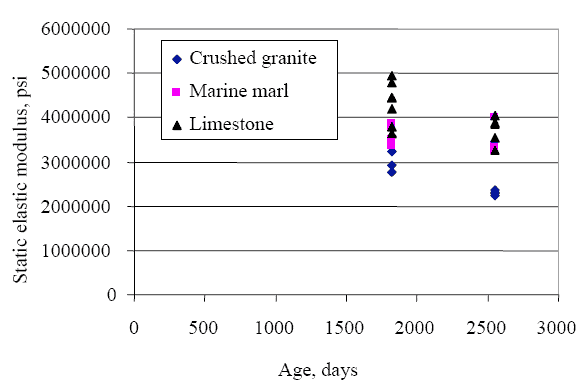
Figure 7. Graph. Plot of static elastic modulus versus age for the three aggregate types analyzed.
Figures 8 through 10 sHow plots of the measured and predicted EPCC from compressive strength for crushed granite, marine marl, and limestone. For the aggregate types examined, a ranged from 26,500 to 43,000.(2) This was lower than the typical value of 57,000 used for conventional concrete. The coefficient of determination R2 ranged from 38 to 67 percent, which was reasonable for field data.
Bivariate Analysis–RCPT and AC Impedance Tests
Rapid Chloride Permeability Testing
RCPT was performed on the core samples to determine chloride permeability and resistivity of the core specimens, respectively. Both RCPT and AC impedance test results provide an indication of the permeability or porosity of the concrete. A less permeable or less porous concrete material is expected to be more durable than one that is permeable or porous because of its susceptibility to moisture penetration. Permeable or porous cores are more likely to deteriorate from the influence of deicing salts as well as from freeze-thaw cycling.
RCPT estimates concrete permeability by estimating the charge that flows through a test specimen over a set period of time. The higher the charge, the more permeable the concrete is. Table 10 presents a summary of the relationship between typical RCPT results (measured as charge in coulombs) and chloride permeability rating.(4) Plots of RCPT test results for the five test sites evaluated are presented in figures 11 through 15. For North Carolina, the test data were divided according to the aggregate type.
In general, the charge passing through the concrete slightly increased with age or remained relatively constant. The only exception to this was for Nebraska. Chloride permeability for the sites evaluated (after 3 to 7 years' placement) was classified using the ratings in table 10 and presented in table 11. Table 11 sHows that the chloride permeability rating of the sites ranged from low to moderate. A moderate rating is quite high for a conventionally low water-cement ratio mixture (modified with water reducers). The abnormally high rating may be due to the presence of calcium nitrate (a set accelerating admixture) in the mix and hence does not necessarily mean the concrete mix is porous. In fact, the mix may have a moderate probability for durability-related distress.
As sHown in table 11, even tHough the absolute values of charge varied slightly with time, the chloride permeability rating remained relatively constant. With the exception of North Carolina, the chloride permeability rating of the test sites remained constant. This is in agreement with the observed visual distress that indicates little to no durability-related problems 7 years after concrete placement.
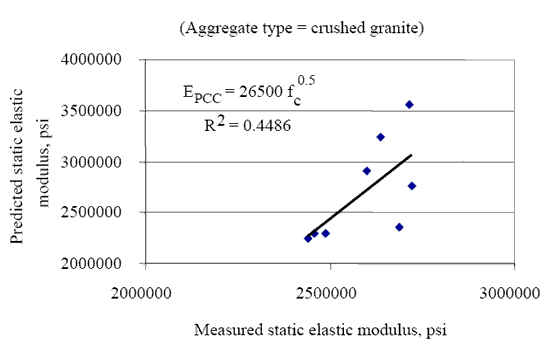
Figure 8. Graph. Plot of the measured and predicted EPCC from compressive strength for crushed granite.
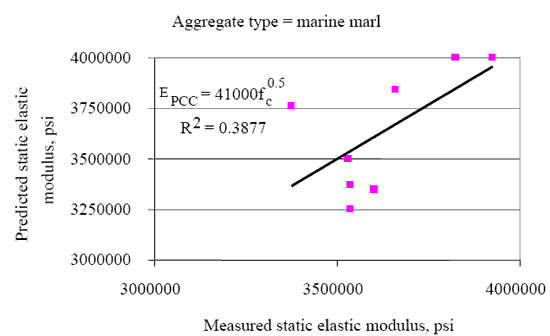
Figure 9. Graph. Plot of the measured and predicted EPCC from compressive strength for marine marl.
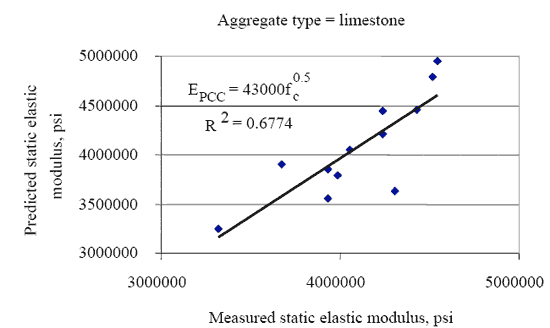
Figure 10. Graph. Plot of the measured and predicted EPCC from compressive strength for limestone.
| RCPT Results (coulombs) | Chloride Permeability |
|---|---|
| > 4000 | High |
| 2000 to 4000 | Moderate |
| 1000 to 2000 | Low |
| 100 to 1000 | Very low |
| < 100 | Negligible |
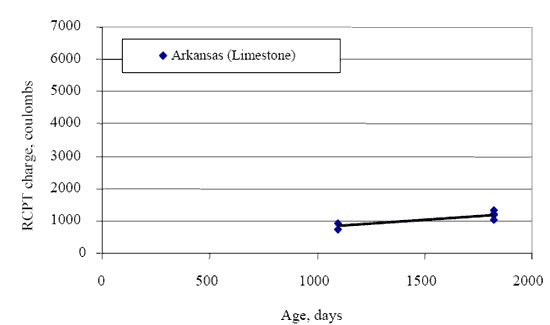
Figure 11. Graph. Plot of charge passed versus concrete age for Arkansas.
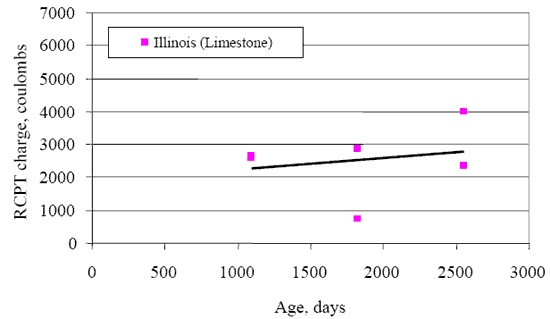
Figure 12. Graph. Plot of charge passed versus concrete age for Illinois.
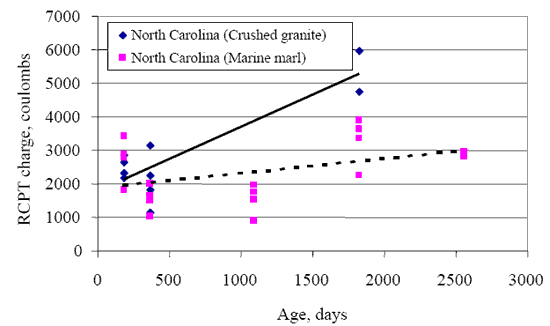
Figure 13. Graph. Plot of charge passed versus concrete age for North Carolina.
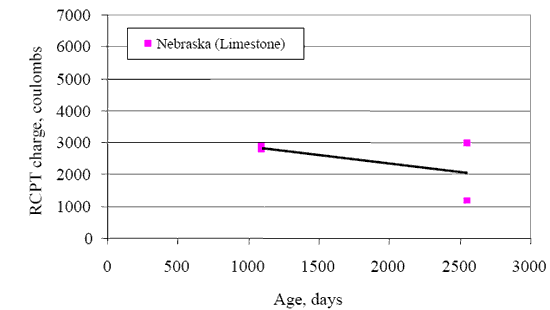
Figure 14. Graph. Plot of charge passed versus concrete age for Nebraska.
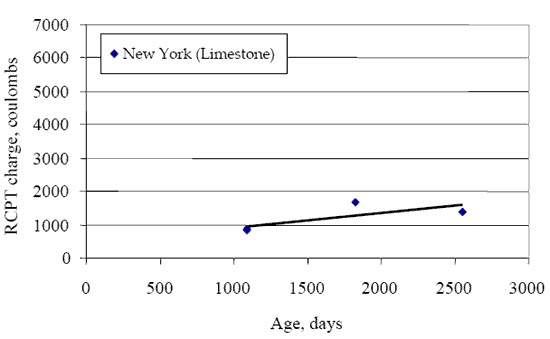
Figure 15. Graph. Plot of charge passed versus concrete age for New York.
| State | Aggregate Type | Chloride Permeability | ||||
|---|---|---|---|---|---|---|
| 0.5 year | 1 year | 3 year | 5 year | 7 year | ||
| Arkansas | Limestone | – | – | Low | Low | – |
| Illinois | Limestone | – | – | Moderate | Moderate | Moderate |
| North Carolina | Crushed granite | Moderate | Moderate | – | Moderate | – |
| North Carolina | Marine marl | Moderate | Low | Low | Moderate | Moderate |
| Nebraska | Limestone | – | – | Moderate | Moderate | |
| New York | Limestone | – | – | Moderate | Moderate | Moderate |
Figures 16 through 18 present histograms sHowing comparisons of RCPT results measured from the top and bottom portions of the core specimens. Evaluating both the top and bottom portions of the slab separately was very important since durability-related distress such as D-cracking could be initiated from either end of the concrete slab. The information presented sHowed no obvious trend in the RCPT results for the top or bottom of the slab. This finding agreed with observation that sHowed obvious distress through the core specimens inspected. Because of the importance of the investigation to determine if there are significant differences in the top and bottom RCPT results, ANOVA was performed using the test data. The results are presented later in this chapter.
AC Impedance
The final durability indicator variable to be analyzed was the AC impedance, Z. As mentioned earlier, the impedance test was investigated as a viable alternative to RCPT. The test has a potential advantage over RCPT because it does not induce ionic diffusion within the specimen and, therefore, eliminates the effects of concentration gradients within the concrete.
The AC impedance test was performed at two frequencies–100 and 1,000 Hz. However, because of inconsistencies in the testing procedure for the 1,000-Hz test, no reliable time series data were available. Therefore, the bivariate analysis was limited only to the 100-Hz AC impedance test data conducted using the Nilsson soil resistance meter in two-pin mode.
In general, higher measures of impedance within a concrete material indicate a less porous and more durable material able to withstand the effects of wet-dry, freeze-thaw, and other adverse climatic cycles. Figures 19 through 23 present plots of measured impedance versus age for the concrete samples evaluated from the different test sites. They sHow that impedance measured at 100 Hz generally remained constant or decreased slightly with age. This observation was similar to the RCPT results, where no obvious trend with time was determined. The observation also agrees with the visual distress data that sHowed no obvious deterioration in the concrete due to ASR or D-cracking.
Because none of the sites evaluated sHowed any significant amounts of visual durability-related distress, it would be premature to draw conclusions about whether the 100-Hz test result could accurately indicate the presence of durability-related distress. Even tHough Illinois and possibly other sites use deicing salts to free the pavements of ice during winter, the test results sHowed no adverse effect (such as increased variability).
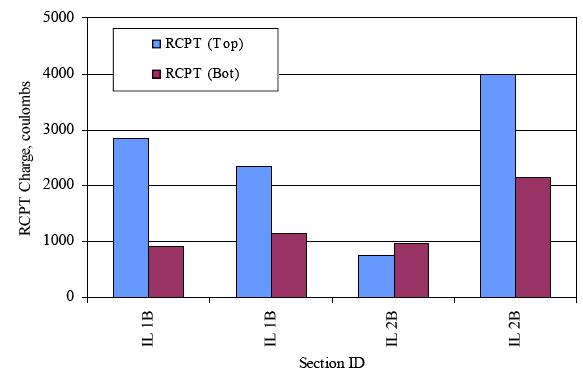
Figure 16. Bar chart. Histogram sHowing RCPT results from the top and bottom sections of concrete cores (Illinois).
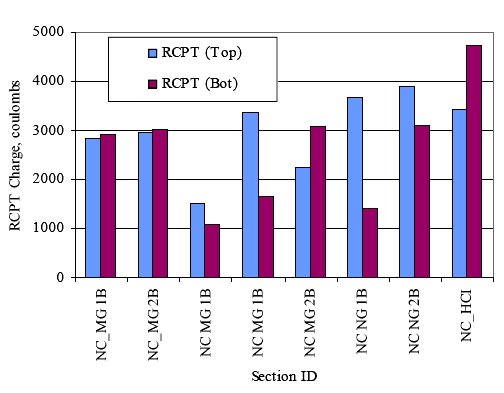
Figure 17. Bar chart. Histogram sHowing RCPT results from the top and bottom sections of concrete cores (North Carolina).
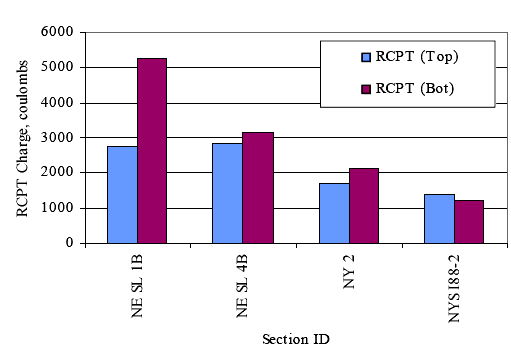
Figure 18. Bar chart. Histogram sHowing RCPT results from the top and bottom sections of concrete cores (Nebraska and New York).
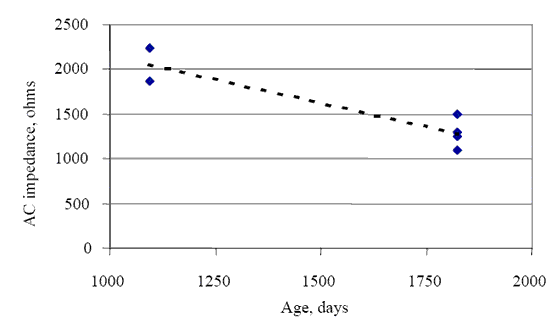
Figure 19. Graph. Plot of AC impedance versus age for concrete cores (Arkansas, limestone).
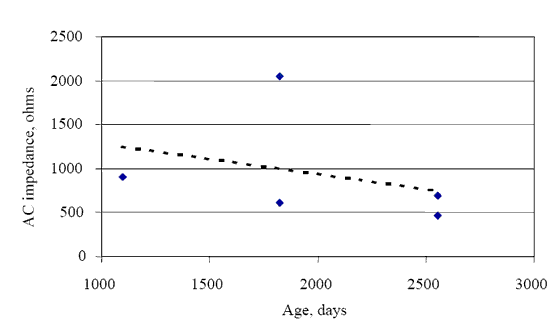
Figure 20. Graph. Plot of AC impedance versus age for concrete cores (Illinois, limestone).
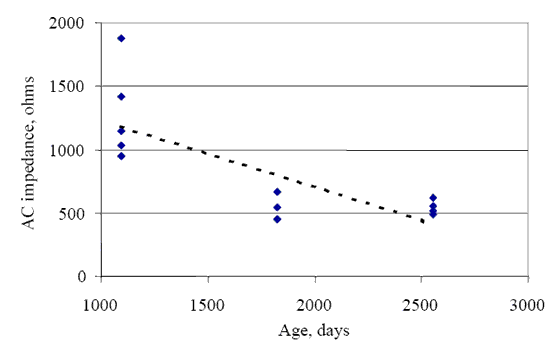
Figure 21. Graph. Plot of AC impedance versus age for concrete cores (North Carolina, granite).
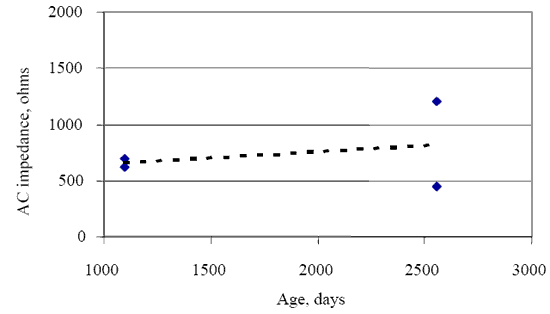
Figure 22. Graph. Plot of AC impedance versus age for concrete cores (Nebraska, limestone).
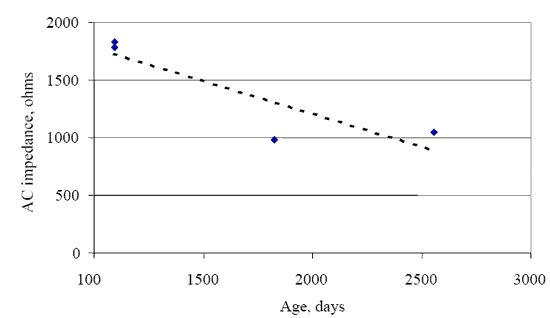
Figure 23. Graph. Plot of AC impedance versus age for concrete cores (New York, limestone).
Figure 24. sHows the plot of RCPT versus AC impedance for the 100-Hz test. The plot sHows clearly that there is a nonlinear exponential relationship between the 100-Hz AC impedance test and the RCPT. A model developed for relating RCPT results to the 100-Hz AC impedance test results was as follows:
 (2)
(2)
Statistics:
N = 32; R2 = 92.5 percent
where
ACIMPH = AC impedance measures at 100 Hz, ohms
ACIMPT = AC impedance measures at 1000 Hz, ohms
RCPT = RCPT results, coulombs
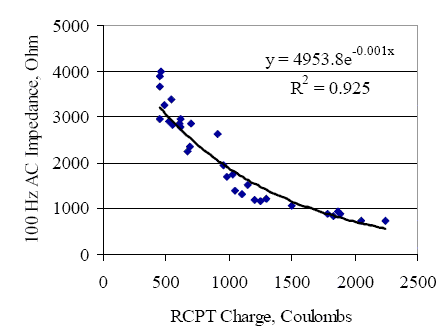
Figure 24. Graph. RCPT versus AC impedance for the 100-Hz test.
Using equation 2 and the ratings presented in table 10, the ratings presented in table 12 were developed for the 100-Hz AC impedance test. The presence of a functional correlation between the AC impedance measurements and the RCPT values is definitely encouraging. However, since the model sHown in equation 2 was based on limited data, any attempt to use it beyond the scope of this work is not encouraged until further research is done.
| RCPT Results (coulombs) | 100-Hz AC Impedance (ohms) | Chloride Permeability |
|---|---|---|
| > 4000 | < 90 | High |
| 2000 to 4000 | 90 to 670 | Moderate |
| 1000 to 2000 | 670 to 1800 | Low |
| 100 to 1000 | 1800 to 4480 | Very low |
| < 100 | > 4480 | Negligible |
Analysis of Variance
The bivariate analysis was followed by a comprehensive ANOVA to determine their statistical significance. The hypothesis tested:
The results of ANOVA are summarized and discussed in the following sections.
Influence of Early-Age Curing on Core Compressive Strength and RCPT Results
For this analysis, the data were grouped according to location/climate (five treatments) and curing metHod (two treatments). The durability indicator variables used were core compressive strength and RCPT test result (charge in coulombs). All the data from the different age groups were grouped together for this analysis to ensure that a reasonable sample size for analysis was obtained. Tables 13 and 14 present summaries of ANOVA results (Duncan's multiple-range test of comparison of mean) for the effect of curing metHod on the durability indicator variable compressive strength and chloride permeability.
The information presented in tables 13 and 14 confirms the observed trends (see figures 1 through 5) that the curing metHod used had no significant impact on the long-term strength development or chloride permeability of the concrete. However, this observation does not imply that insulated curing is not useful for HES concrete. It is definitely useful for VES gain, as reported in the original SHRP study. (1)
| Location | Variable | Class | Mean Value | Duncan Class* | Comments |
|---|---|---|---|---|---|
| Arkansas | Compressive strength, psi | None | 8932 | A | No significant difference |
| Plastic sheeting (insulated) | 9628 | A | |||
| Illinois | Compressive strength, psi | None | 7443 | A | No significant difference |
| Plastic sheeting (insulated) | 7598 | A | |||
| North Carolina | Compressive strength, psi | None | 8223 | A | No significant difference |
| Plastic sheeting (insulated) | 8519 | A | |||
| Nebraska | Compressive strength, psi | None | 6330 | A | No significant difference |
| Plastic sheeting (insulated) | 6542 | A | |||
| New York | Compressive strength, psi | None | – | – | Data available only for insulated sections |
| Plastic sheeting (insulated) | – | – |
* Duncan's multiple range test; tHose with the same letter are not significantly different.
| Location | Variable | Class | Mean Value | Duncan Class* | Comments |
|---|---|---|---|---|---|
| Arkansas | Charge, coulombs | None | 983 | A | No significant difference |
| Plastic sheeting (insulated) | 1153 | A | |||
| Illinois | Charge, coulombs |
None | 2457 | A | No significant difference |
| Plastic sheeting (insulated) | 2607 | A | |||
| North Carolina | Charge, coulombs | None | 2509 | A | No significant difference |
| Plastic sheeting (insulated) | 2652 | A | |||
| Nebraska | Charge, coulombs | None | 2271 | A | No significant difference |
| Plastic sheeting (insulated) | 2957 | A | |||
| New York | Charge, coulombs | None | – | – | Data available only for insulated sections |
| Plastic sheeting (insulated) | – | – |
* Duncan's multiple-range test; tHose with the same letter are not significantly different.
Influence of Aggregate Type on Core Compressive Strength and RCPT Results
For this analysis, the data were grouped according to aggregate type. The strength indicator used was compressive strength of cores; the durability indicator used was the RCPT result (charge in coulombs), which is an indicator of concrete permeability. All the data from the different age groups were grouped together for this analysis. Tables 15 and 16 present summaries of the ANOVA (Duncan's multiple-range test of comparison of means).
| Variable | Class | Mean Value | Duncan Class* | Comments |
|---|---|---|---|---|
| Compressive strength, psi | Crushed granite | 9372 | A | Significant difference between crushed granite and others |
| Marine marl | 7486 | B | ||
| Limestone | 7877 | B |
* Duncan's multiple-range test; tHose with the same letter are not significantly different.
Table 16. Summary of analysis of variance results for the effect of aggregate type on concrete permeability.
| Variable | Class | Mean Value | Duncan Class* | Comments |
|---|---|---|---|---|
| Charge, coulombs | Crushed granite | 2414 | A | No significant difference |
| Marine marl | 2300 | A | ||
| Limestone | 1808 | A |
* Duncan's multiple-range test; tHose with the same letter are not significantly different.
The information presented in tables 15 and 16 confirms the observed trends–the aggregate type has a significant impact on the long-term strength development, with the concrete mix made with crushed granite having the highest strength values. There was, However, no difference in the strengths of concrete made from marine marl or limestone. Aggregate type had no significant effect on concrete chloride permeability, as sHown in table 16.
Evaluation of Top and Bottom RCPT Results 4
The RCPT results from measurements made on the top and bottom portions of the same core specimen were evaluated to determine if there was a significant difference in their values. Table 17 presents summaries of ANOVA results (test of significance (F-test) and Duncan's multiple range test of comparison of mean).
The information presented in table 17 confirms the observed trends seen in figures 16 through 18–there was no significant difference in chloride permeability for the top and bottom portions of the core specimens. This was also in agreement with the observed visual distress survey that sHowed no significant distress througHout the entire core specimen evaluated.
| Variable | Class | Mean Value | Duncan Class* | Comments |
|---|---|---|---|---|
| Charge, coulombs | Top of specimen | 2944 | A | No significant difference |
| Bottom of specimen | 2376 | A |
* Duncan's multiple-range test; tHose with the same letter are not significantly different.