U.S. Department of Transportation
Federal Highway Administration
1200 New Jersey Avenue, SE
Washington, DC 20590
202-366-4000
Federal Highway Administration Research and Technology
Coordinating, Developing, and Delivering Highway Transportation Innovations
 |
| This report is an archived publication and may contain dated technical, contact, and link information |
|
Publication Number: FHWA-HRT-05-068 Date: October 2005 |
The analyses performed for this project can be categorized as (1) analysis of LTPP data and (2) analysis performed on data collected at five test sections to determine short-term changes in roughness. This section presents an overview of the analysis approach and procedures that were used.
The LTPP program was designed as a 20-year study of pavement performance. One aspect of the LTPP program is the General Pavement Studies (GPS) program, which studies the performance of inservice pavement test sections. Under the GPS program, more than 800 test sections were established on inservice pavements in all 50 States of the United States and in Canada. In the LTPP program, jointed plain concrete (JPC) pavements are studied in the GPS-3 experiment. Profile data are being collected at regular intervals at these test sections using an inertial profiler. Roughness values computed from the profile data provide an excellent source for investigation of roughness progression of JPC sections.
The following analysis approach was used to analyze data from the GPS-3 sections for this study:
The data collected for the LTPP program are stored in the LTPP Information Management System (IMS) database. Data from the following data categories were used in this analysis: inventory, climatic, monitoring, traffic, and materials testing.
The analysis database used for this project was built using Microsoft® Access 2000. The data tables identified for analysis were obtained from IMS in January 2003. Multiple data values were usually available for material test parameters at each test section. For example, at a test section several cores were obtained for testing and compressive strength values for all tested cores were available in the database. For cases where multiple data values were available for a data element, the values were averaged to obtain a unique value for the test section.
For this analysis, the mean IRI of the test section (the average IRI of the left and right wheel paths) was used to characterize the roughness. For a specific test date at a test section, the LTPP database generally has five IRI values obtained from five profile runs. The mean IRI values of these multiple profile runs were averaged to obtain the roughness for that specific test date.
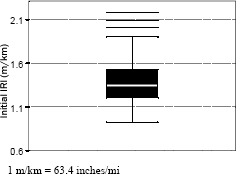
In the analysis, box plots were used to examine the distribution of data. A box plot is a graphical procedure for illustrating the distribution of data. A box plot shows the center and the spread of the distribution of data as well as outliers. Figure 14 presents a box plot that shows the distribution of the IRI value obtained from a group of test sections. The horizontal line in the interior of the box is located at the median of the data. The top of the box is the 75th percentile value, the bottom of the box is the 25th percentile value, and the difference between these two percentile values is referred to as the interquartile distance. The whiskers (lines extending from the top and bottom of the box) extend to the extreme values of the data, or to a distance of 1.5 times the interquartile distance from the center, whichever is less. For data having a normal distribution, approximately 99.3 percent of the data falls inside the whiskers. Data points that fall outside the whiskers may be outliers, which are indicated by horizontal lines. The box plot shown in figure 14 indicates the median IRI value of the data set to be 1.34 m/km (85 inches/mi). The 25th and 75th percentile values indicated by the lower and the upper limits of the box are 1.19 and 1.50 m/km (47 and 95 inches/mi), respectively. The horizontal lines above the top whisker are outliers.
Figure 14. Example of a box plot.
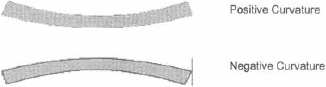
The shape of concrete slabs in a pavement can vary depending on the temperature and moisture gradient within the slab as well as the built-in curl in the slab. The concrete slab can take these shapes: (1) curled up, when the joints are at a higher elevation than the center of the slab, (2) curled down, when the center of the slab is at a higher elevation than the joints, or (3) flat. A procedure for determining the curvature of PCC slabs using data collected by inertial profilers was presented by Byrum.(10) In this procedure, a parameter called the Curvature Index (CI), which is calculated from profile data, is used to represent the amount of curvature in PCC slabs. This procedure was used in this analysis to evaluate the effect of slab curvature on roughness. This index not only captures slab curling or warping present on the slabs; it also captures any other curvature that will be present within a slab. A description of CI is presented in appendix A. The sign convention for CI is shown in figure 15; CI will have a positive value if the slabs are curled up and a negative value if the slabs are curled down.
Figure 15. Sign convention for slab curvature.
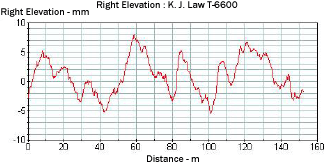
The profile data available in the LTPP database have been subjected to either a 91-m (300-ft) or a 100-m (328-ft) upper wavelength cutoff. Data collected by the K.J. Law DNC 690 profilers have been subjected to a 91-m (100-ft) upper wavelength cutoff filter, whereas data collected with either K.J. Law T-6600 or International Cybernetics Corporation (ICC) profilers have been subjected to a 100-m (328-ft) upper wavelength cutoff filter. These data need to be filtered further to see details in the profile data.
Filters commonly used in profile analysis are high-pass filters, low-pass filters, and band-pass filters. A high-pass filter removes wavelengths greater than a specified value. A low-pass filter removes wavelengths lower than a specified value. A band-pass filter keeps the wavelengths within a specified waveband and removes the other wavelengths.
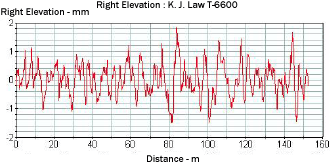
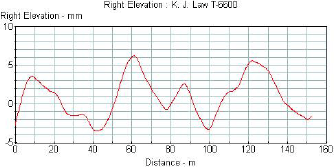
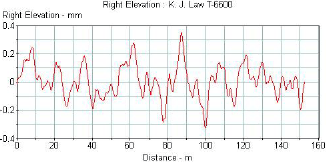
Figure 16 shows the plot of a typical profile obtained from the LTPP K.J. Law T-6600 profiler. Figures 17, 18, and 19, respectively, show this profile after it has been subjected to a 5-m (16-ft) high-pass filter, a 10-m (33-ft) low-pass filter, and a band-pass filter with a lower wavelength of 5 m (16 ft) and an upper wavelength of 10 m (33 ft). The profile plot shown in figure 17 has all wavelengths that are greater than 5 m (16 ft) removed. The profile plots shown in figure 18 have all wavelengths less than 10 m (33 ft) removed. The plot shown in figure 19 contains only the wavelengths between 5 and 10 m (16 and 33 ft). Filtering techniques can be used to evaluate the presence of curling or warping in slabs and also investigate profile features that may influence roughness. A detailed description of profile data filtering is contained in reference 5.
Figure 16. Profile recorded by profiler.
1 mm=3.28 ft
1 mm = 0.039 inch.
Figure 17. Profile after being subjected to a 5-m (16-ft) high-pass filter.
1 mm=3.28 ft
1 mm = 0.039 inch.
Figure 18. Profile after being subjected to a 10-m (33-ft) low-pass filter.
1 mm=3.28 ft
1 mm = 0.039 inch.
Figure 19. Profile after being subjected to a band-pass filter.
1 mm=3.28 ft
1 mm = 0.039 inch.
Data collected at test sections established on five paving projects were used in this analysis. The data typically were collected at these times after paving: 1 day, 3 days, 7 days, and 3 months. IRI values obtained at the different time sequences were evaluated to determine short-term changes in IRI. In the analysis, the distribution of the roughness within a section was evaluated using roughness profiles. The profile data were also evaluated using PSD plots to identify wavelengths in the profile that had a significant influence on roughness.
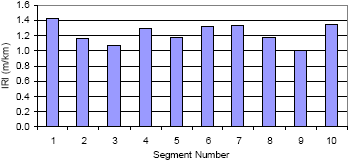
The average roughness of a road segment can be expressed by IRI. However, the roughness within the road segment can be variable. For example, consider a 100-m (328-ft) section of a road that has a roughness of 1.23 m/km (78 inches/mi). This road segment can be divided into 10 equidistant segments, each with a length of 10 m (33 ft). Figure 20 shows the roughness of each of these 10-m (33-ft) segments. As shown, the roughness values for the 10-m (33-ft) segments are variable, with the highest roughness of 1.42 m/km (90 inches/mi) being obtained at segment 1, and the lowest roughness of 1.01 m/km (64 inches/mi) being obtained at segment 9.
Figure 20. Roughness of a roadway expressed in 10-m (33-ft) segment lengths.
1 m/km=63.4 inches/mi.
Instead of using a single value to characterize the roughness of a roadway, a roughness profile can be used to show how roughness varies with distance along the roadway. Figure 21 shows the roughness profile based on a 10-m (33-ft) base length for the same section of roadway whose roughness distribution was shown in figure 20. In figure 21, the roughness value for a specific location is the average roughness over a 10-m (33-ft) length (i.e., base length of roughness profile) centered at that location. For example, the roughness shown at 25 m (82 ft) is the average roughness from 20 to 30 m (66 to 99 ft). The highest roughness value in the roughness profile occurs at 50 m (164 ft), and therefore the 10-m (33-ft) stretch of road with the highest roughness is between 45 and 55 m (148 and 181 ft). A roughness profile can be constructed for any base length. A detailed description of roughness profiles is presented by Sayers.(34)
Figure 21. Example of a roughness profile.
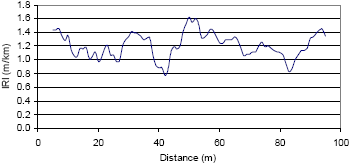
1 m/km=63.4 inches/mi.
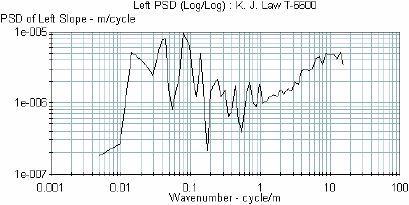
A road profile encompasses a spectrum of sinusoidal wavelengths. A PSD function is a statistical representation of the importance of various wavelengths contained in the profile.(5) The PSD function of profile slope best shows differences in roughness properties because the basic spectrum of roughness over the wavenumbers is more uniform.(5) In this research project, PSD plots of the profile slope were used in the analyses. Figure 22 shows an example of a PSD plot of a road profile. This plot presents a view of the distribution of the wavelengths contained within the road profile. The X-axis of the PSD plot represents the wavenumber. The wavenumber is the inverse of wavelength. If a prominent wavelength is present in a profile, this wavelength will show up as a spike in the PSD plot.
Figure 22. Example of a PSD plot.
1 m = 3.28 ft

