U.S. Department of Transportation
Federal Highway Administration
1200 New Jersey Avenue, SE
Washington, DC 20590
202-366-4000
Federal Highway Administration Research and Technology
Coordinating, Developing, and Delivering Highway Transportation Innovations
 | Report |  |
| This report is an archived publication and may contain dated technical, contact, and link information |
|
| Publication Number: FHWA-HRT-11-027 Date: JANUARY 2011 |
Publication Number: FHWA-HRT-11-027 Date: JANUARY 2011 |
During the past 30 years, GRS technology has been used to build walls, shallow foundations, culverts, bridge abutments, and rock fall barriers. The technology also has been used to stabilize slopes and repair roadways. While GRS technology can provide solutions in a variety of applications and under certain extreme conditions, the design method described in the interim implementation manual provides a recipe for design of GRS-IBS with limitations on abutment heights, bridge spans, and design loads.(1)
The design methods are appropriate for GRS structures (an abutment and wing walls) with a vertical or near vertical face and at a height that does not exceed 30 ft. Although the majority of bridges built with GRS-IBS have spans of less than 100 ft, spans of up to 140 ft have been constructed. While longer spans are possible, the bearing stress on the GRS abutment is limited to 4,000 lb/ft2. The demands of longer spans on GRS-IBS are not fully understood at this time, and it is recommended that engineers limit bridge spans to approximately 140 ft until further research has been completed.
GRS-IBS abutment capacities are dependent on a combination of the strength of the fill material and the strength of the reinforcement when built in accordance with the two rules of GRS construction: (1) good compaction (95 percent of maximum dry unit weight, according to AASHTO T99) of high-quality granular fill and (2) closely spaced layers of reinforcement (12 inches or less). It is recommended that design or allowable bearing pressure be limited to 4,000 lb/ft2. For design pressures larger than 4,000 lb/ft2, the performance criteria must be checked against the applicable stress-strain curve resulting from a performance test. The performance criteria for GRS-IBS consist of a tolerable vertical strain of 0.5 percent and lateral strain of 1 percent. A significant amount of research and practical experience has shown that GRS-IBS designed and constructed within these limits will produce safe, durable systems.
This section focuses on stability within the design method of GRS-IBS.(1) The main distinction with the GRS-IBS design method is the evaluation of internal stability for the GRS abutment, which is different from other reinforced soil systems. External stability in this design method is largely unchanged from other abutment wall systems. However, overturning, or limiting eccentricity, is not a failure mode for fully constructed GRS-IBS.
Two design philosophies are presented in the interim implementation manual: Allowable Stress Design (ASD) and American Association of State and Highway Transportation Officials (AASHTO) Load and Resistance Factor Design (LRFD).(1) It is FHWA policy that design for Federal-aid funded projects be conducted using the LRFD methodology. The LRFD format presented was normalized to produce the same results as the ASD method and does not represent a statistically based calibration that would be consistent with other LRFD-based methods. After sufficient data are produced and collected as a result of this technology deployment and other efforts, a thorough statistical analysis will be performed to appropriately produce LRFD specifications for the design of GRS-IBS.
A GRS abutment is a type of gravity structure. Therefore, external stability should be evaluated for the direct sliding, bearing capacity, global stability, and overturning failure modes limiting this type of construction. However, because a GRS mass is relatively ductile and free of tensile strength, overturning about the toe, in a strict sense, is not a possible response to earth pressures at the back of the mass or loading on its top. Other attributes of GRS-IBS also tend to preclude overturning as a mode of failure. GRS-IBS consists of two abutments supporting an integrated superstructure that would function as a strut to resist overturning, and each GRS mass has a reinforced integration zone above its heel, also resisting the overturning mode of failure. Consequently, while direct sliding, bearing capacity, and global stability are evaluated in conventional ways, overturning is sometimes addressed by inspection and comparison to observations of past performance.
Observations of past performance show that the flexible, internally stabilized soil mass of GRS-IBS construction, in combination with an RSF, results in more uniform stress distribution, resisting any applied vertical and lateral loads. Observations also show that, in addition to lack of overturning, the combination of vertical and lateral loads, as limited by analysis of direct sliding, bearing capacity, and global stability, does not cause excessive deformation at the face of the GRS mass or other undesirable performance.
While this combination of unique features and behavior eliminates the need to analyze overturning as a failure mode for completed GRS-IBS, the engineer may choose to analyze for overturning during an intermediate phase of construction with consideration for the time needed for an overturning mechanism to develop and the concurrent level of loading or for project configurations different from those described herein. For example, overturning may still be a viable failure mode for abutment wing walls constructed with GRS technology if they retain soil other than reinforced soil from the abutment or opposite wing wall (i.e., if they retain natural soil).
Internal stability for a GRS abutment consists of evaluating ultimate capacity, deformations, and required reinforcement strength. There are two approaches to internal stability: empirical and analytical. Empirically, an engineer can predict the ultimate capacity and the deformations of a GRS abutment. Analytically, an engineer can estimate the ultimate capacity and the required reinforcement strength.
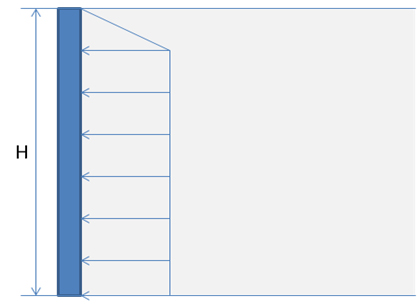
Connection strength and pullout are not evaluated in the design of the GRS-IBS as they are with other reinforced soil systems. The design of GRS structures assumes a relatively constant earth pressure with depth at the wall face (see figure 9). This method takes into account the tensile forces in the reinforcement, which counteract the classical lateral earth pressure distribution. This occurs because the reinforcement, not the wall face, acts to restrain lateral deformation of the soil.
Figure 9. Illustration. Idealized lateral earth pressure at the face of a GRS structure.
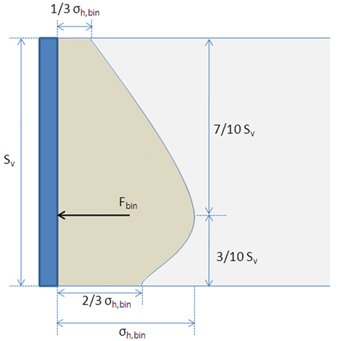
Wu et al. proposed that the lateral pressure distribution between reinforcements is based on the concept of bin pressure.(11) In an idealized bin pressure diagram, the pressure is zero at the depth of any reinforcement layer within a bin. The lateral earth pressure increases linearly with depth before decreasing to zero at the next reinforcement layer. Because reinforcement may deform slightly and the interface between the soil and reinforcement may not be perfectly bonded, the bin pressure diagram shown in figure 10 was developed.(11) The bin pressure is not a function of wall height. Instead, the bin pressure is only a function of reinforcement spacing and the strength parameters of the soil (see equation 2).
Figure 10. Illustration. Bin pressure diagram for GRS structures.(11)
The thrust force against the wall face calculated using equation 2 is lower than that using the theory of active earth pressure. This eliminates the need for mechanical connections between the wall face and the reinforcement. A frictional connection, recommended in GRS design, is sufficient to prevent connection failure. The facing blocks sit directly on the reinforcing geosynthetic and are held in place purely by the friction between the reinforcement and the concrete block. This is an adequate connection because the GRS is internally supported by the closely spaced reinforcement and does not need the facing block to resist lateral pressures. As such, connection strength is not an internal stability problem in GRS design. Nevertheless, the capacity of this simple method of connection is reported in appendix A.
In a GRS structure, there is no thrust on the wall face due to surcharge or bridge loads. This is because the GRS mass is internally supported by the closely spaced reinforcement layers of the bearing reinforcement bed. Because the facing elements (e.g., concrete masonry unit (CMU) blocks) are frictionally connected and the bulk unit weight of the facing is smaller or about the same as that of the GRS mass, the reinforcement, soil, and facing elements all strain together. The interaction between the reinforcement and the soil is such that the soil is strong in compression while the reinforcement provides the tensile capacity, creating the composite mass. Any thrust that occurs due to the surcharge and bridge loads is absorbed to some extent by the reinforcement and does not transmit to the face.
The ultimate vertical capacity of a GRS mass is found either empirically or analytically. It is recommended that the ultimate capacity be found empirically, if possible. A performance test should be conducted to determine the ultimate capacity empirically if the reinforced fill is different from the reported performance test in this report. Testing will provide the most accurate results for the design. If a performance test cannot be performed, the analytical method can be used to determine the ultimate capacity.
3.3.1.1 Empirical Method
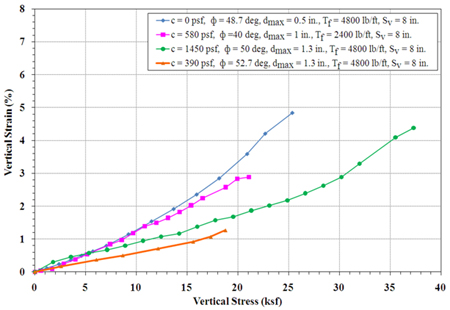
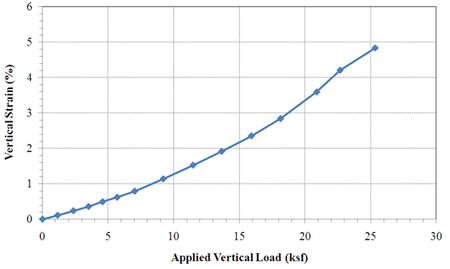
Empirically, the results of an applicable performance test using the same geosynthetic reinforcement and compacted granular backfill as planned for the site should be used. The ultimate vertical capacity in this case is defined as the stress at which the performance test mass strains 5 percent vertically. Several performance tests have been conducted with different materials, as shown in figure 11. In all examples, the facing elements were frictionally connected to the GRS mass.
Figure 11. Graph. Performance test results for different materials.
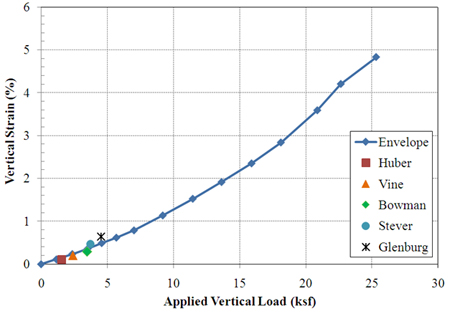
Note that three of the materials in figure 11 have cohesion (c). Relatively clean granular fills (sands, gravels, and rock fills) share two common characteristics in terms of Mohr-Coulomb strength parameters: (1) no cohesion and (2) a curved failure envelope over a wide range of confining pressure. Depending on how the strength parameters are evaluated, one may come up with a set of c and φ values for a granular soil. The cohesion should be ignored in design if it will not be there during the service life of the structure. Cohesion may be apparent (due to capillary tension in a moist soil that will vanish when wetted or dry) or the small amount of clay binder may disappear when the granular soil becomes submerged for a while. If this is the case, refer to the analytical method that ignores the effect of cohesion.
3.3.1.2 Analytical Method
The load-carrying capacity of a GRS wall and abutment (qult,an,c) can be evaluated using an analytical formula (see equation 3).(10) The analytical formula was originally developed for GRS walls, but it is also applicable to GRS abutments. Note that the analytical method assumes that the backfill satisfies the criteria outlined in the interim implementation manual.(1)
Where σc is the lateral confining pressure, Sv is the reinforcement spacing, dmax is the maximum grain size of the reinforced backfill, Tf is the ultimate strength of the reinforcement, and Kpr is the coefficient of passive earth pressure for the reinforced fill. For a GRS wall with dry-stacked modular block facing, the value of σc can be estimated according to equation 4.
Where γfb is the bulk unit weight of the facing block, Df is the depth of the facing block unit (in the direction perpendicular to the wall face), and δ is the friction angle between the geosynthetic reinforcement and the top or bottom surface of the facing block.
The ultimate capacity (qult,an,c) was determined using Bell's relation for lateral earth pressure, shown in equation 5.(18) The equation was then rearranged to solve for the vertical pressure (σv).
Where σh is the lateral earth pressure (see equation 6), σv is the vertical pressure, Ka is the active earth pressure coefficient, and c is the cohesion.
Where σc is the lateral confining pressure (equation 4) and Δσ3 is the change in lateral pressure due to the reinforcement (see equation 7).
Where w is a factor accounting for the effect of reinforcement spacing and aggregate size (see equation 8), T is the reinforcement strength, and Sv is the reinforcement spacing.
Where Sv is the reinforcement spacing and dmax is the maximum aggregate size. The w factor was determined based on several large-scale GRS experiments.(10) Inputting the ultimate strength of the reinforcement (Tf) for the reinforcement strength (T) in equation 7 and solving equation 5 for the vertical pressure (σv) will yield the ultimate capacity of the GRS abutment (equation 3).
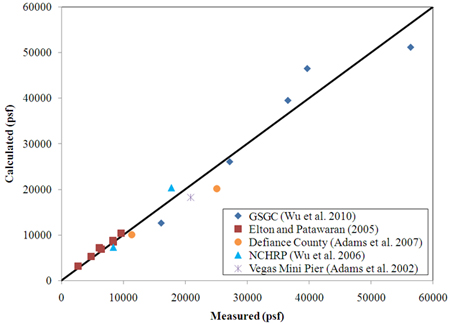
Figure 12 shows the predictive capability of equation 3, where the calculated ultimate load-carrying capacity is compared to measured values for a number of full-scale experiments and in-service GRS structures. The complete set of data, showing the range of fills, reinforcement strength, and spacing, can be found in appendix B. Note that equation 3 should not be used in design.
Figure 12. Graph. Predictive capability of the soil-geosynthetic composite capacity equation.
To estimate the ultimate capacity used in design, equation 3 is modified to neglect confining stress (σc) and cohesion (c) and is referred to as the soil-geosynthetic composite capacity equation (see equation 9).(1,10) The magnitude of σc is typically very small and should conservatively be assumed to equal zero. The effect of cohesion is also removed in design as it cannot be counted on in the long-term strength of the GRS abutment.
Where Sv is the reinforcement spacing, dmax is the maximum grain size of the reinforced backfill, Tf is the ultimate strength of the reinforcement, and Kpr is the coefficient of passive earth pressure for the reinforced fill.
The vertical deformation involves empirically finding the strain from an applicable performance test curve. The lateral strain is then analytically found assuming the theory of zero volume change.
3.3.2.1 Vertical
The vertical strain of the GRS mass is found from the intersection of the applied vertical stress due to the dead load (qb) and the stress-strain curve found from a performance test (see figure 13). The vertical strain should be less than about 0.5 percent. The vertical deformation, or settlement, of the GRS abutment is the vertical strain multiplied by the height of the wall or abutment. Because the GRS abutment is built with a granular fill, the majority of settlement within the GRS mass will occur immediately after the placement of dead loads (qb) and before the bridge is opened to traffic.
Figure 13. Graph. Design envelope for vertical strain at 8-inch reinforcement spacing.
The settlement of the underlying foundation soils is determined separately using classic soil mechanics theory for immediate (elastic) or consolidation settlement. Factors such as excavation and the RSF should be taken into account, because the removal of overburden relieves stress on the foundation soil. Settlement of the foundation soil can be calculated using the FHWA Soils and Foundations Reference Manual.(19)
Figure 14 shows the results of the previously described method for five in-service GRS abutment walls in Defiance County, OH. The measured vertical strain at the applied dead loads fits well with the curve. More information on these five structures is given in chapter 4.
Figure 14. Graph. Deformation estimation from in-service GRS-IBS structures.
3.3.2.2 Lateral
In response to a vertical load, the composite behavior of a properly constructed GRS mass is such that both the reinforcement and soil strain laterally together. This fact can be used to predict both the maximum lateral reinforcement strain and the maximum face deformation at a given load. The method conservatively assumes a zero volume change in the GRS mass and represents a worst-case scenario. The maximum lateral displacement of the abutment face wall can be estimated using the following procedure.(20)
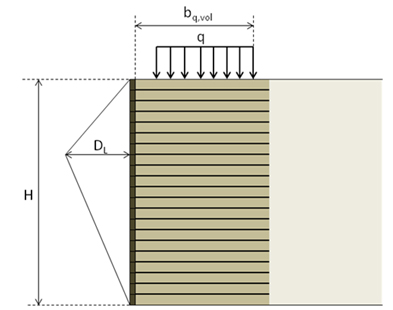
Assuming a uniformly loaded vertical wall in plane strain conditions (such as with a strip footing), the maximum lateral displacement (DL) occurs in one direction along one wall face (see figure 15). It is found by assuming the volume lost at the top ( Vtop) due to settlement is equal to the volume gained at the face (ΔVface) due to lateral deformation (see equation 10).
Where bq,vol is the width of the load along the top of the wall including the setback, L is the unit length of the wall, Dv is the vertical settlement in the GRS mass, and H is the wall height. Equation 10 can then be solved for the maximum lateral displacement (see equation 11). The lateral strain (εL) is then found using equation 12. The lateral strain should be limited to around 1 percent.
Where εV is the vertical strain at the top of the wall. Equation 10 comes from the assumptions of a triangular lateral deformation and a uniform vertical deformation. Note that the location of the maximum lateral deformation depends on the loading and fill conditions, but the volume gained will still equal the volume lost at the top.
Figure 15. Illustration. Lateral deformation of a GRS structure.
3.3.3 Required Reinforcement Strength
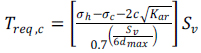
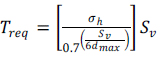
The required reinforcement strength in the direction perpendicular to the wall face (Treq,c) can be determined analytically using equation 13. Note that equation 13 is equation 3 rearranged to solve for the required reinforcement strength to prevent failure. In the design, the effect of confinement (σc) and cohesion (c) are ignored to find the required reinforcement strength (Treq) to ensure long-term strength and durability (see equation 14).
Where σc is the lateral confining pressure of GRS mass (equation 4), assumed to equal zero for a CMU block face wall; Sv is the reinforcement spacing; dmax is the maximum grain size of backfill; Kar is the active earth pressure coefficient for the reinforced fill; and h is the total lateral stress within the GRS mass at a given depth and location.
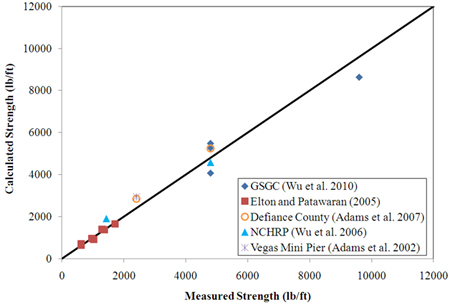
Equation 13 was validated by comparing it to the measured reinforcement strength at failure, as shown in figure 16. The required reinforcement strength at failure matches well with the actual values of strength at rupture. The input data for each case in figure 16 are shown in appendix B.
Figure 16. Graph. Predictive capability of the required reinforcement strength equation.