Post-Earthquake Reconnaissance Report on Transportation Infrastructure: Impact of the February 27, 2010, Offshore Maule Earthquake in Chile
APPENDIX A. SUBSURFACE DATA
A.1 SUBSURFACE DATA
A.1.1 Subsurface Data for Américo Vespucio/Miraflores (Site 1)
One boring log was available at site 1. The specific location is not known, but its general location is within the circle in figure 284. A copy of the boring log is provided in figure 285.
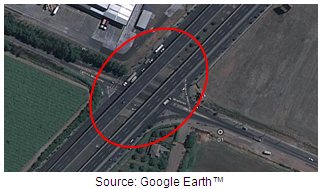
© Google, Europa Technologies, Inav/Geosistemas SRL, and GeoEye
Figure 284. Map. Image of site 1 taken prior to earthquake.
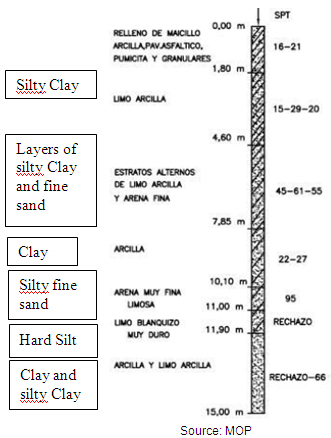
Figure 285. Illustration. Boring log at site 1.
A.1.2 Subsurface data for Américo Vespucio/Lo Echevers (Site 2)
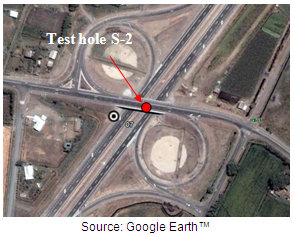
The location of the site 2 bridge is shown in figure 286. A copy of as-built bridge plans and one boring log at site 2 are provided in figure 287 through figure 289.
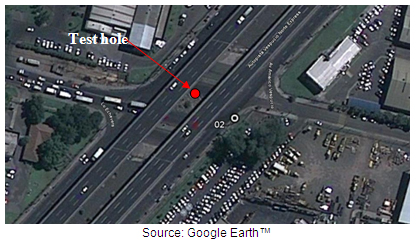
© Google, Europa Technologies, Inav/Geosistemas SRL, and GeoEye
Figure 286. Map. Image of site 2 taken prior to earthquake and showing approximate location of test hole.
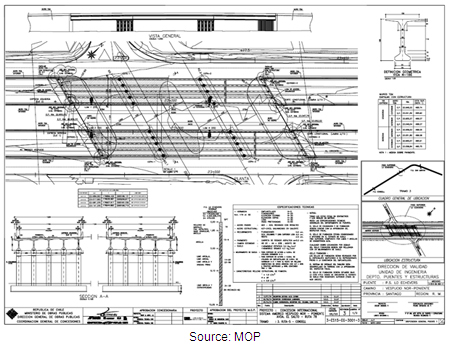
Figure 287. Illustration. As-built bridge plan for site 2.
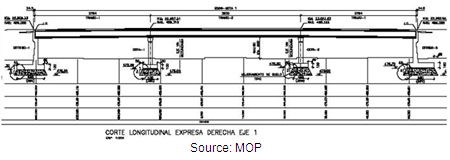
Figure 288. Illustration. As-built bridge profile for site 2 showing footing foundations.
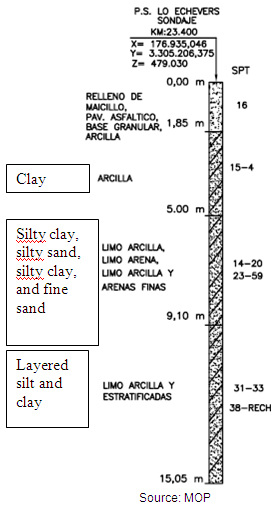
Figure 289. Illustration. Boring log at site 2.
A.1.3 Subsurface Data for Avenida Romero Accesso Sur (Site 7)
The location of bridge site 7 is shown in figure 290. A copy of as-built drawings and one boring log at site 7 are included in figure 291 and figure 292.
© Google, DigitalGlobe, and Inav/Geosistemas SRL
Figure 290. Map. Image of site 7 taken prior to earthquake and showing approximate location of test hole.
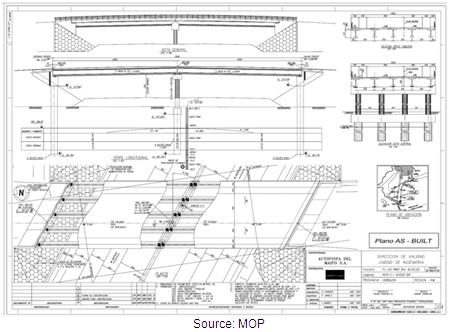
Figure 291. Illustration. As-built bridge plan for site 7.
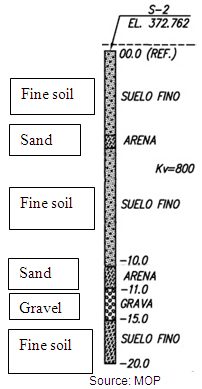
Figure 292. Illustration. Boring log for site 7.
A.1.4 Subsurface Data for Avenida Chada Accesso Sur (Site 8)
The location of bridge site 8 is figure 293. A copy of as-built drawings and one boring log at site 8 are included in figure 294 and figure 295.
© Google, DigitalGlobe, and Inav/Geosistemas SRL
Figure 293. Map. Image of site 8 taken prior to earthquake and showing approximate location of test hole.
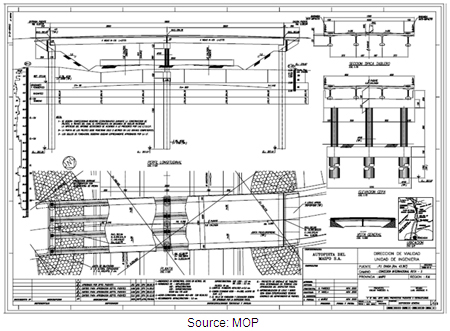
Figure 294. Illustration. As-built bridge plan for site 8.
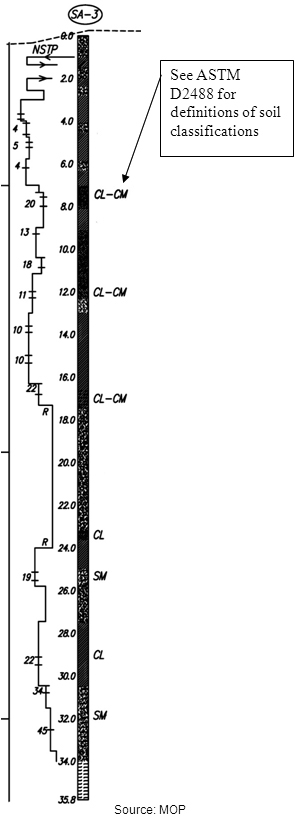
Figure 295. Illustration. Boring log for site 8.
A.1.5 Subsurface Data for Route 5 Railway Overcrossing at Hospital (Site 10)
The location of bridge site 10 is shown in figure 296. A copy of as-built drawings and one boring log at site 10 are included in figure 297 and figure 298.
© Google, DigitalGlobe, and Inav/Geosistemas SRL
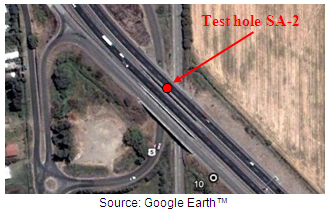
Figure 296. Map. Image of site 10 taken prior to earthquake and showing approximate location of test hole.
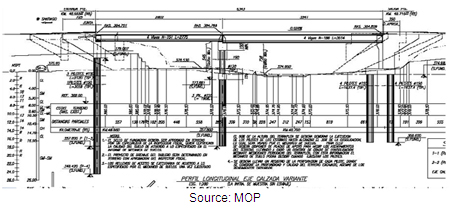
Figure 297. Illustration. As-built bridge plan for site 10.
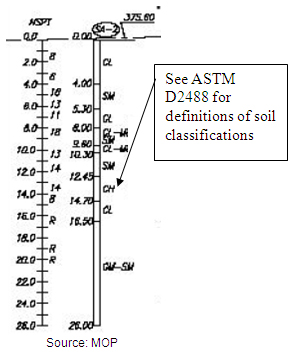
Figure 298. Illustration. Boring log SA-2 for site 10.
A.1.6 Subsurface Data for Via Elevada 21 de Mayo/Cruce Ferroviario (Site 28)
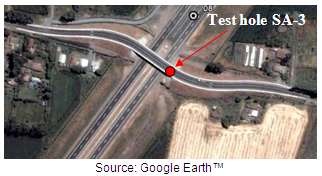
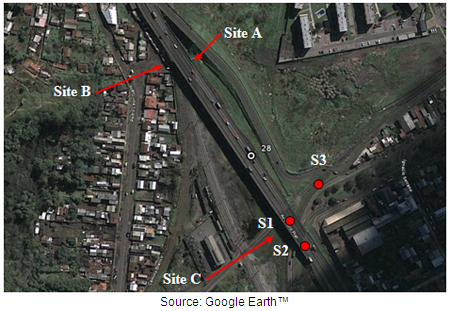
The location of bridge site 28 is shown in figure 299. Red dots indicate the location of the test holes with the corresponding numbers labeled. Copies of three boring logs at site 28 are given in figure 300 through figure 305.
© Google, DigitalGlobe, Inav/Geosistemas SRL, and Europa Technologies
Figure 299. Map. Image of site 28 taken prior to earthquake and showing approximate locations of test holes.
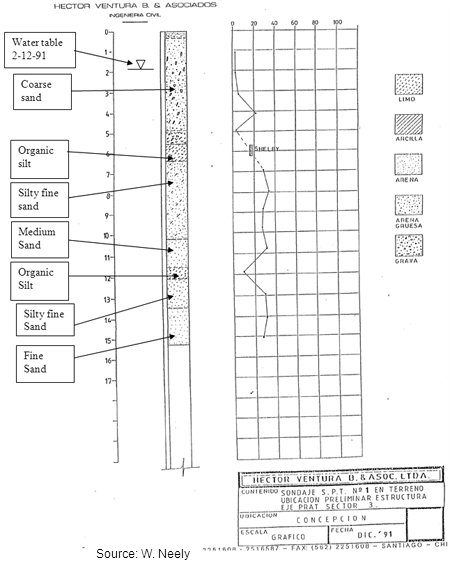
Figure 300. Illustration. Boring log S-1 for site 28.
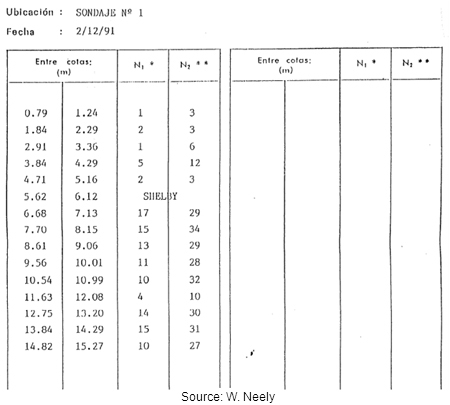
Figure 301. Illustration. Detailed standard penetration test blow counts for boring log S-1 for site 28.
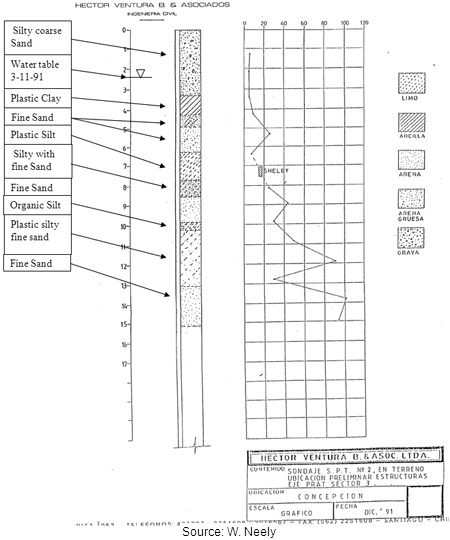
Figure 302. Illustration. Boring log S-2 for site 28.
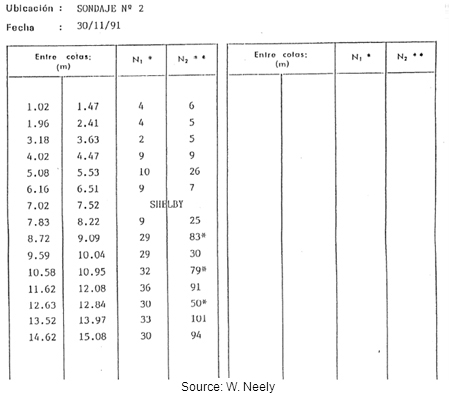
Figure 303. Illustration. Detailed standard penetration test blow counts for boring log S-2 for site 28.
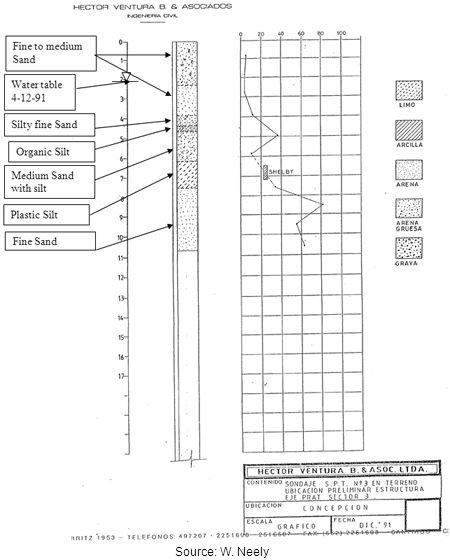
Figure 304. Illustration. Boring log S-3 for site 28.
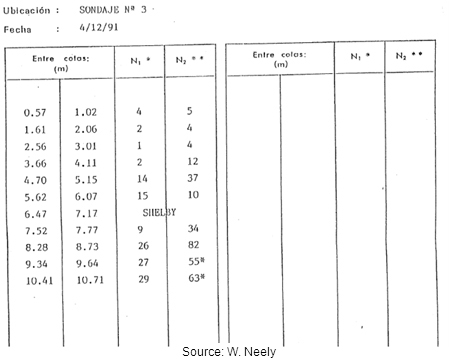
Figure 305. Illustration. Detailed standard penetration test blow counts for boring log S-3 for site 28.
|


