U.S. Department of Transportation
Federal Highway Administration
1200 New Jersey Avenue, SE
Washington, DC 20590
202-366-4000
Federal Highway Administration Research and Technology
Coordinating, Developing, and Delivering Highway Transportation Innovations
| REPORT |
| This report is an archived publication and may contain dated technical, contact, and link information |
|
| Publication Number: FHWA-HRT-14-090 Date: October 2014 |
Publication Number: FHWA-HRT-14-090 Date: October 2014 |
One of the main goals of the research is to develop design details for reinforcing bar embedded in UHPC, which would provide guidance for engineers using reinforced UHPC in innovative applications. In this report, the focus has been on a widely available UHPC product containing 2% steel fiber (by volume). Reinforcing bar sizes ranging from No. 4 to No. 8 and bar type including A615 Grade 60 uncoated and epoxy coated bar and A1035 Grade 120 bar were included in the study.
One design detail that would reach at least the lesser of the bar yield stress or 75 ksi (517 MPa) at bond failure for different bar type and size tested in this study is first presented. Other design details that would also attain a similar stress level are then presented. Finally, details relevant to an alternative design concept wherein the bar stress reaches a significantly higher stress level alongside an ensured ductility prior to bond failure is presented.
The fundamental design concept embedded into the reinforcing steel development and splice length provisions of the AASHTO LRFD Bridge Design Specification and the ACI 318 Building Code is to allow for the attainment of the yield strength of the mild steel reinforcement. The research studies on which these provisions are based were primarily conducted on structural components wherein the stress in the reinforcement at failure was below the yield stress of the bar. These results allowed for extrapolation of the observed bar stress at failure up to the yield strength of the bar. Aside from special provisions that ensure ductility by limiting the locations of splices or anchorages, these design specifications do not specifically ensure ductility of spliced or embedded reinforcing bars beyond the initial yielding of the bar.
Given this construct, the results obtained in this study were analyzed so as to create design guidance that parallels the existing provisions in these design specifications. Specifically, test results were analyzed to ensure that the bar could attain the lesser of its yield stress or 75 ksi (517 MPa).
As mentioned earlier in the report, there were specimens that were intentionally excluded from previously discussed analyses, including those end specimens close to the casting point and those specimens that failed with UHPC tensile failures. In this present section wherein design guidance is developed, all test specimens were included in the analysis.
First, the bar stress at bond failure is plotted versus embedment length in Figure 29 for all the A1035 No. 5 bars tested in study, with those end specimens close to casting point and those with UHPC tensile failures included. The specimens had a variety of side cover and bar spacing. For the side cover, values of 2db, 2.7db, 3db ,and 3.5db were included; for the bar spacing to the nearest No. 8 bars, values of 0, 2, 4, 6, 8, and 12 in. (0, 5.1, 10.2, 15.2, 20.3 and 30.5 cm) were used. The specimens were grouped into two base categories, one with side over equal to 2db and the other one with side cover greater than or equal to 2.7db, as shown in Figure 29. Then, the specimens with those specific conditions, including the zero bar spacing, bar spacing greater than lstan(θ), end specimens close to casting point, and specimens with UHPC tensile failures were marked on top of the base categories, as explained in the note of Figure 29. For those without any mark on top, they all had bar spacing between 2db and lstan(θ)). It is also important to note that all the tests included were conducted at one day after casting with a UHPC compressive strength of approximately 13.5 ksi (93.1 MPa).
As shown in Figure 29, in general, the bar stress at bond failure increases as the embedment length increases. The large majority of the specimens had a bar stress at bond failure over 80 ksi (552 MPa); the ones with bar stress at bond failure below 80 ksi (552 MPa) were those with a side cover of 2db, combined with either a short embedment length of 4db and 6db or disadvantageous spacing (bar spacing = 0 or bar spacing > lstan(θ)). It is also important to note that for the specimens with a side cover of 2db, combined with sufficient embedment length (≥8db) and appropriate bar spacing (between 2db and lstan(θ) in this study), they all have reached a bar stress of at least 80 ksi (552 MPa).
Note: * Specimens were grouped into two base categories based in side cover, one with side cover equal to 2db and the other one with side cover greater than or equal to 2.7db. The specimens with specific conditions, including bar spacing equal to zero, bar spacing greater than lstan(θ), end specimens close to casting point, and specimens with UHPC tensile failures were marked on top of that. For example, ![]() refers to a specimen with side cover of 2db and with a specific condition of end specimen close to the casting point;
refers to a specimen with side cover of 2db and with a specific condition of end specimen close to the casting point; ![]() refers to a specimen with side cover ≥ 2.7db, and with specific conditions of zero bar spacing to nearest bar and end specimen close to the casting point. For those without any mark on top, they had bar spacing between 2db and lstan(θ).
refers to a specimen with side cover ≥ 2.7db, and with specific conditions of zero bar spacing to nearest bar and end specimen close to the casting point. For those without any mark on top, they had bar spacing between 2db and lstan(θ).
Figure 29. Graph. Bar stress at bond failure versus embedment length for all tests with A1035 No. 5 bars
Based on Figure 29, the plot of bar stress at bond failure versus embedment length is modified by excluding the specimens with a side cover of 2db, and the results are shown in Figure 30. As shown in Figure 30, all specimens exhibited a bar stress higher than 80 ksi (552 MPa), with the specimens with bar spacing equal to zero or greater than lstan(θ) and/or end specimens close to casting point generally exhibiting lesser bar stresses at bond failure. It should be noted that there is only one specimen that failed with UHPC tensile failure in this group while the majority of the specimens failed with UHPC tensile failure were those with a side cover only 2db, as shown in Figure 29. The specimens with an embedment length of 8db and a side cover of 3db are identified in Figure 30 with a red diamond; all of them have reached a bar stress over 100 ksi (690 MPa) at bond failure; those with appropriate bar spacing [between 2db and lstan(θ)] reached a bar stress over 120 ksi (827 MPa).
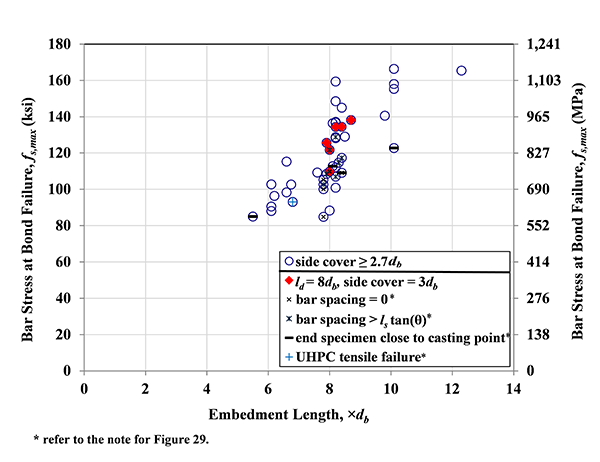
Figure 30. Graph. Bar stress at bond failure versus embedment length for all tests with A1035 No. 5 bars and with a side cover ≥ 2.7db.
Based on Figure 29 and Figure 30, a design detail that will allow for the attainment of the lesser of the bar yield strength or 75 ksi (517 MPa) before bond failure in this UHPC material for all the bar types and bar sizes tested in this study is developed and verified in the following. A review of some of the findings presented in previous sections is necessary here. As discussed earlier, for bars with larger diameter, the bond strength decreased and a longer embedment length should be used. Uncoated bar that yielded before bond failure tends to have lower ultimate bond strength than corresponding high strength reinforcing bar that does not yield. Epoxy coated reinforcing bar, in general, has less bond strength than uncoated bar. Given these considerations, the design with a minimum embedment length of 8db, minimum side cover of 3db, bar spacing between 2db and lstan(θ), and minimum UHPC compressive strength of 13.5 ksi (93 MPa) is recommended. The crack angle θ for the bar tested in this study is about 55 degrees. In general, the angle of inclination can vary from 45° to 80° and depends on whether the reinforcing bar ribs are lateral, diagonal, or wavy with respect to the axis of the bar. (27) To simplify the design and also to be conservative, the angle of 45° is used and the bar spacing is then recommended to be between 2db and ls. For all the A1035 No.5 bars tested in this study, when the recommended esign condition were met, they all had a bar stress at bond failure over 120 ksi (827 MPa), as shown in Figure 30. For different type and size bars, it will be discussed in the following.
For situations where the above design recommendation is problematic, alternate recommendations can be developed. Addressing the effect of bar type first, the previous analysis has indicated that the yielding of reinforcing bar would reduce the ultimate bar stress at bond failure as compared to a similar bar with a higher yield strength. The research also indicated that the performance of A1035 can be used to well predict the performance of normal strength uncoated bar up to at least the yield strength of the uncoated bar. It would be conservative to predict that the uncoated bar would yield if the corresponding A1035 high strength reinforcing bar reached an ultimate bar stress well over the yield strength of the uncoated bar. For epoxy coated bar, the research indicated minimal reduction compared with uncoated bar when there was a sufficient embedment length that the bar yielded before bond failure. In fact, there were two epoxy coated bar specimens with an embedment length of 8db and side cover of only 2db in this study (Table 11 Set 4), and they had bar stress at bond failure of 78 and 83 ksi (538 and 572 MPa), which is above the yield strength; if the side cover was increased to 3db as recommended, a higher bar stress at bond failure would be expected.
The analysis in previous sections indicated that larger size bar tends to have lower bar stress at bond failure compared with smaller bars with the same design in terms of individual bar diameter. However, the reduction is minimal. To verify the selected design having sufficient bond strength for larger bars, the tests with A1035 No.7 bar and epoxy coated No. 8 bar were examined and the results are presented in Figure 31. Most of the tests were conducted using A1035 No.7 bar, with a side cover of either 2db or 2.35db, corresponding to a UHPC strip width of 4-3/8 and 5 in. (11.1 and 12.7 cm), respectively. One specimen with epoxy coated No.8 bar was tested as the possible weakest case in this study. As shown in Figure 31, for the A1035 No.7 bar with a 6db embedment length, the bar stress at bond failure was only about 60 ksi (414 MPa) for specimens with 2db side cover; it increased to about 77 ksi (531 MPa) when the side cover was increased to 2.35db. With a 8db embedment length and 2db side cover, all A1035 No.7 bars have reached a bar stress of 80 ksi (552 MPa) or more, except for the two end specimens close to the casting point having bar stress of 68 and 76 ksi (469 and 524 MPa). For the specimen cast with No. 8 epoxy coated bar, it had an embedment length of 8db and a side cover of 2db, and it reached a bar stress of 91 ksi (627 MPa) at bond failure. Therefore, for larger bars, up to No. 8 in this study, it would be conservative to expect bar stress at bond failure to be at least the lesser of 75 ksi (517 MPa) or the bar yield strength with an embedment length of 8db and side cover of 3db.
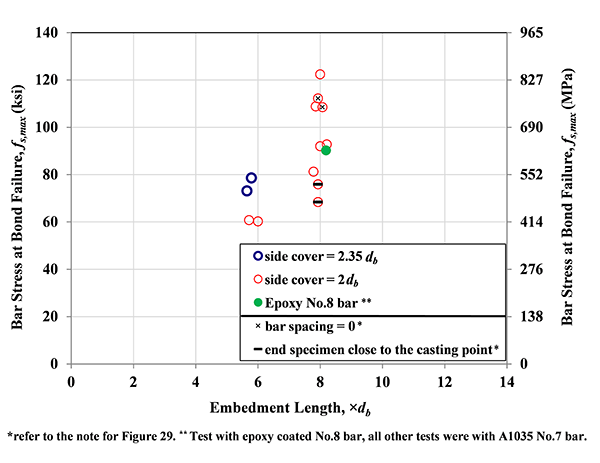
Figure 31. Graph. Bar stress at bond failure versus embedment length for tests with A1035 No. 7 bars and epoxy coated No.8 bars.
The design with a minimum embedment length of 8db, a minimum side cover of 3db, a bar clear spacing between 2db and ls, and a minimum UHPC compressive strength of 13.5 ksi (93.1 MPa) is recommended for general application of deformed bar to reach the lesser of the bar yield strength or 75 ksi (517 MPa) at bond failure. In some cases, reinforcing bar would reach a much higher bar stress at bond failure with this design detail. For example, the A1035 No. 5 bars tested in the study reached a bar stress over 120 ksi (827 MPa) at bond failure. For specific applications with different bar type, bar size, and UHPC compressive strength, designers may want to consider refinements of these recommendations based on the test results. For example, if a larger side cover is provided or/and UHPC with a higher compressive strength is used, the embedment length can be reduced. For this purpose, the following three figures were developed for reference when modification of the recommended design is needed.
The average bar stress at bond failure for different design details is presented in Figure 32 through Figure 34. Figure 32 included the tests with A1035 high strength No. 5 bars, Figure 33 presented the specimens with normal strength epoxy coated and uncoated No.5 bars, and Figure 34 had the specimens with A1035 No. 4 and No. 7 bars and epoxy coated No. 8 bars. For each design detail, the average bar stress at bond failure and the maximum and minimum values for involved specimens are presented in the bar chart. Below each bar chart, the design detail, including embedment length, concrete cover, UHPC compressive strength, and number of tests conducted are presented. For general information, the specimens were tested either at 1, 7, or 14 days after casting, corresponding to compressive strength of approximately of 13, 19, and 21 ksi (90, 131, and 145 MPa), respectively.
All specimens in the three figures have a bar clear spacing between 2db and lstan(θ). It is important to consider this, because, as demonstrated in an earlier section, the specimens with bar clear spacing that is too small or too large tend to exhibit lower bond strengths, with the potential for a twenty percent or more reduction. It should also be noted that the specimens with UHPC tensile failure and the end specimens close to casting point are all included in the three figures; in fact, these specimens were the main reason why some of the results have a large range (the range between the maximum and minimum values showing in each figure). The UHPC tensile failure is attributable to insufficient UHPC cross sectional area to carry applied force and thus can generally be minimized by providing sufficient concrete side cover (≥3db). The specimens that failed with bar rupture before bond failure are outlined in red.
With the design of a minimum embedment length of 8db, a minimum side cover of 3db, a bar clear spacing between 2db and ls, and a minimum UHPC compressive strength of 13.5 ksi (93.1 MPa) as the baseline, minor adjustment can be made based the limited test results shown in Figure 32 through Figure 34 per practical need. For example, for situations where the above conditions are met except that the minimum side cover is between 2db and 3db, the minimum embedment length can be increased to 10db. Based on Figure 32, for A1035 No. 5 bars, both the design with an embedment length of 6db accompanied with a side cover of 3db and the design with an embedment length of 8db accompanied with a side cover of 2db could reach a bar stress of at least 75 ksi (517 MPa) before bond failure at one day after casting with UHPC compressive strength of 13.8 ksi (95 MPa). If sufficient UHPC compressive strength was gained, for example at 14 days after casting, the uncoated No.5 bar with an embedment length of 6db and a side cover of 2db could also reach a bar stress equal to the lesser of the yield strength or 75 ksi (517 MPa) before bond failure (see Figure 33).
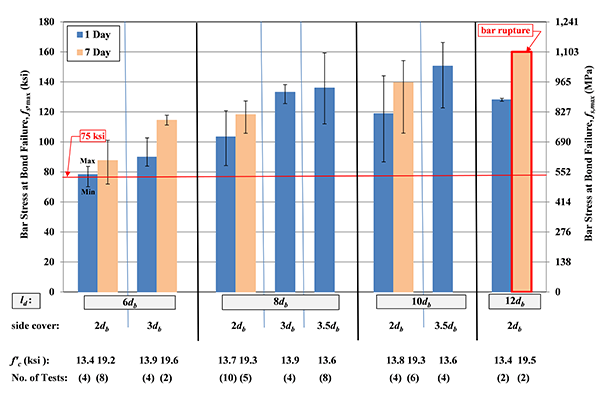
Figure 32. Chart. Bar stress at bond failure for all A1035 No.5 bars with different design details. All specimens had a bar clear spacing between 2db and lstan(θ).
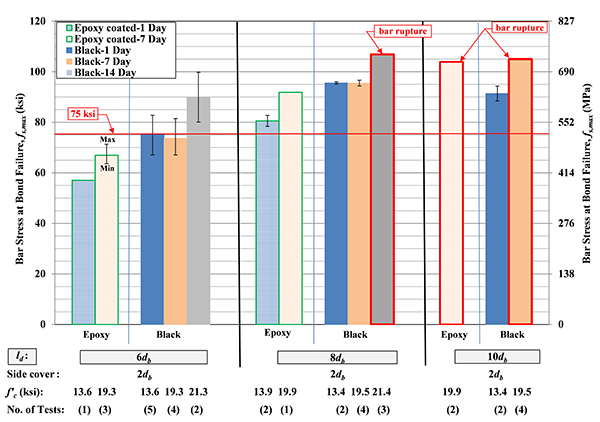
Figure 33. Chart. Bar stress at bond failure for all epoxy coated and uncoated No.5 bars with different design details. All specimens had a bar clear spacing between 2db and lstan(θ).
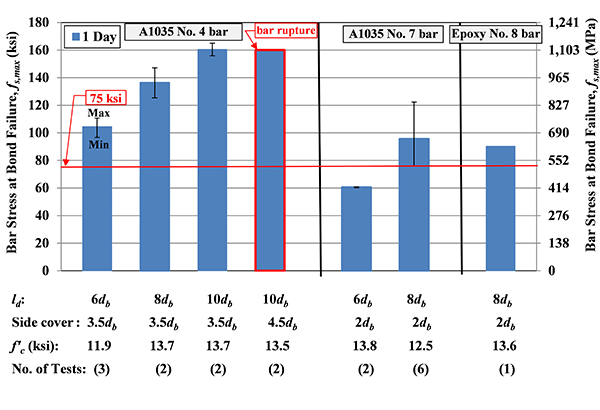
Figure 34. Chart. Bar stress at bond failure for all A1035 No. 4 and No.7 bars and epoxy coated No. 8 bar with different design details. All specimens had a bar clear spacing between 2db and lstan(θ).
In some design cases, such as seismic design, the ductility of reinforcing steel beyond the yield point is also considered. For this purpose, a few embedment configurations relevant to attainment of a bar stress beyond 75 ksi (517 MPa), or even allowing for bar rupture before bond failure, are discussed in this section based on the limited tests in this study.
For details engaging high strength reinforcing bars that do not exhibit a defined yield plateau, the results presented in Figure 32 are quite instructive. For example, for A1035 No.5 bars, the results indicate that when there is a minimum side cover of 3db and a minimum UHPC compressive strength of 19.5 ksi (134 MPa), specimens with embedment length of at least 6db reached a bar stress greater than 100 ksi (690 MPa).
For details engaging normal strength reinforcing bars, a limited set of test configurations resulted in sufficient bar stress and ductility that the rupture of the reinforcing bar occurred before bond failure. The relevant test configurations that achieved bar rupture for both normal and high strength reinforcing bar are as follows: