U.S. Department of Transportation
Federal Highway Administration
1200 New Jersey Avenue, SE
Washington, DC 20590
202-366-4000


Skip to content
Facebook iconYouTube iconTwitter iconFlickr iconLinkedInInstagram

Federal Highway Administration Research and Technology
Coordinating, Developing, and Delivering Highway Transportation Innovations

 
REPORT
This report is an archived publication and may contain dated technical, contact, and link information
Back to Publication List        
Publication Number:  FHWA-HRT-13-018    Date:  April 2013
Publication Number: FHWA-HRT-13-018
Date: April 2013


Daytime Color Appearance of Retroreflective Traffic Control Sign Materials

APPENDIX B. PHYSICAL MEASUREMENTS

This graph is a supplement to figure 10. It is a traditional two-dimensional CIELAB color space plot with the axes rotated 90 degrees clockwise. The ordinate goes from +a (+120) at the bottom to -a (-120) at the top, representing the approximate opponent process colors of red and green, respectively. The abscissa goes from -b (-120) at the left to +b (+120) at the right, representing the approximate opponent process colors of blue and yellow, respectively. The measurements are physical laboratory color determinations made with the Hunter LabScan® XE for retroreflective sign materials. Each of the four retroreflective sheeting types—III, VIII, IX, and proposed (P)-XI—are plotted separately. The six groupings of four color boxes are for red, orange, yellow, green, blue, and white. The groupings of color boxes are arranged in a similar counterclockwise radial manner as the pattern in figure 10. Within the same color, the sizes, shapes, and orientations of the color boxes differ slightly depending on the particular sheeting type.
Figure 29. Graph. Laboratory (LabScan® XE) physical color measurements of four retroreflective sheeting types.


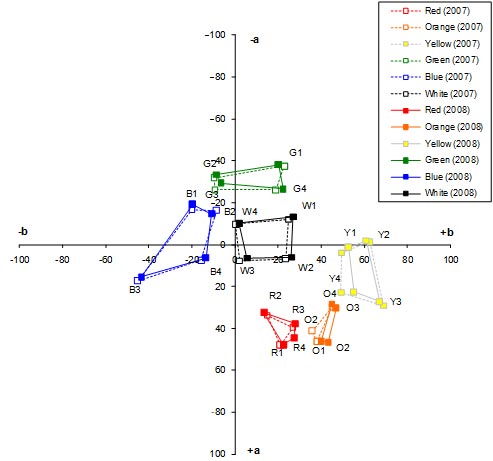
This graph is a supplement to figure 9. It is a traditional two-dimensional CIELAB color space plot with the axes rotated 90 degrees clockwise. The ordinate goes from +a (+100) at the bottom to -a (-100) at the top, representing the approximate opponent process colors of red and green, respectively. The abscissa goes from -b (-100) at the left to +b (+100) at the right, representing the approximate opponent process colors of blue and yellow, respectively. The measurements are physical field color determinations made with the PR-650 spectroradiometer for retroreflective sign materials averaged over the four retroreflective sheeting types. Two sets of measurements are shown for the same physical stimuli, one made in fall 2007 and one made in fall of 2008. The six pairs of color boxes depicted are for red, orange, yellow, green, blue, and white. The pairs of color boxes are arranged in a similar counterclockwise radial manner as the pattern in figure 9. Within the same color, the sizes, shapes, and orientations of the color boxes differ only slightly depending on the year in which the measurements were made. In general, there is good agreement between the two data sets.
Figure 30. Graph. Comparison of mean field (PR-650) physical color measurements from 2007 and 2008 averaged over four retroreflective sheeting types.


Federal Highway Administration | 1200 New Jersey Avenue, SE | Washington, DC 20590 | 202-366-4000
Turner-Fairbank Highway Research Center | 6300 Georgetown Pike | McLean, VA | 22101