U.S. Department of Transportation
Federal Highway Administration
1200 New Jersey Avenue, SE
Washington, DC 20590
202-366-4000


Skip to content
Facebook iconYouTube iconTwitter iconFlickr iconLinkedInInstagram

Federal Highway Administration Research and Technology
Coordinating, Developing, and Delivering Highway Transportation Innovations

 
REPORT
This report is an archived publication and may contain dated technical, contact, and link information
Back to Publication List        
Publication Number:  FHWA-HRT-13-018    Date:  April 2013
Publication Number: FHWA-HRT-13-018
Date: April 2013


Daytime Color Appearance of Retroreflective Traffic Control Sign Materials

APPENDIX C. HUMAN PSYCHOPHYSICAL RESULTS

This graph is an abstract from figure 16. It is a Uniform Appearance Diagram (UAD) showing the mean perceptual color ratings given by the 17 research participants. The UAD shows the opponent colors of red and green along the ordinate, ranging from R (red) (-100) at the bottom to G (green) (+100) at the top. The opponent colors of blue and yellow are shown along the abscissa, ranging from B (blue) (-100) at the left to Y (yellow) (+100) at the right. Whereas figure 16 presented the mean perceptual color ratings for each of the four types of retroreflective materials on one plot, figure 31 presents the mean perceptual color ratings for only the type VIII retroreflective material. The six color boxes for the colors red, orange, yellow, green, and blue are depicted progressing counterclockwise around the graph with the white color box surrounding the origin in the center. The type VIII retroreflective material is shown here to serve as a point of reference for subsequent figures.
Figure 31. Graph. Mean perceptual color ratings for type VIII sheeting for 17 participants.


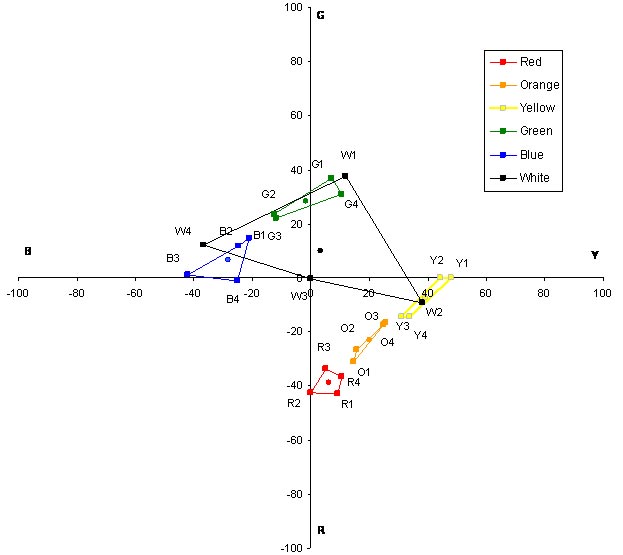
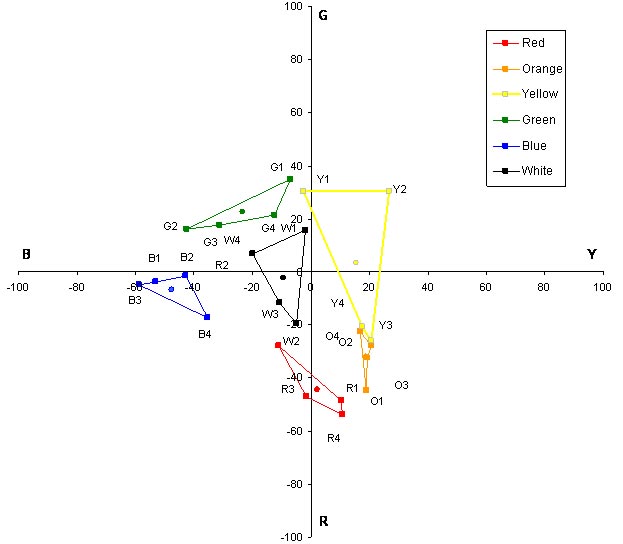
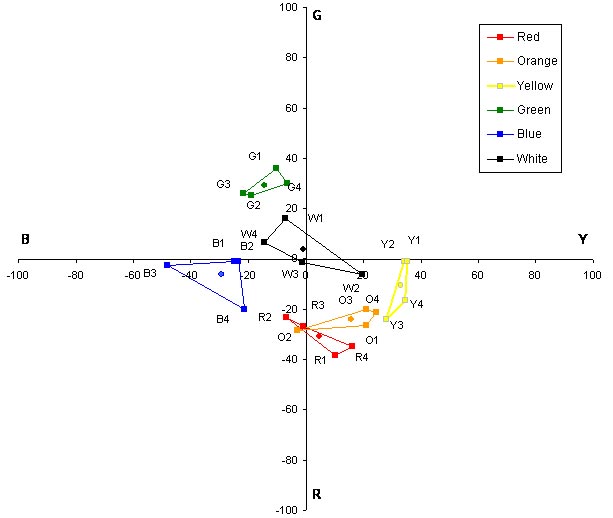
This graph is an expansion of figure 31. It is a Uniform Appearance Diagram (UAD) showing the mean perceptual color ratings given by participant 1. The UAD shows the opponent colors of red and green along the ordinate, ranging from R (red) (-100) at the bottom to G (green) (+100) at the top. The opponent colors of blue and yellow are shown along the abscissa, ranging from B (blue) (-100) at the left to Y (yellow) (+100) at the right. Figure 32 through figure 48 are intended to provide an indication of the variability in the perceptual color rating data due to differences in the mean responses made by different research participants. In all of the UADs, the color boxes follow a similar, recognizable pattern but differ in shape, size, and orientation.
Figure 32. Graph. Mean color ratings for type VIII sheeting for participant 1.


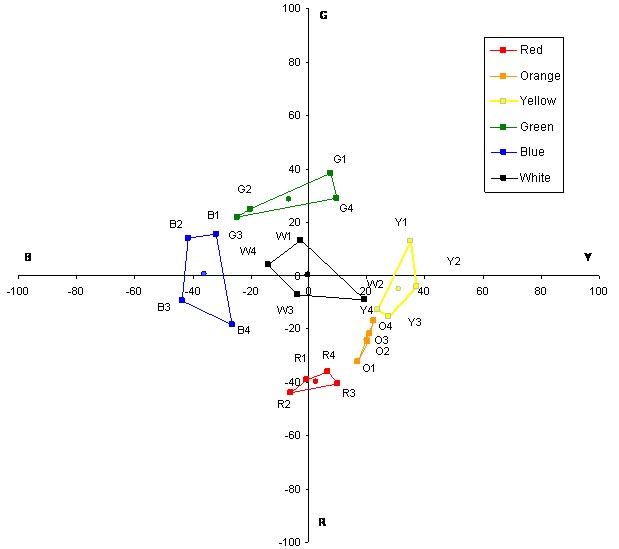
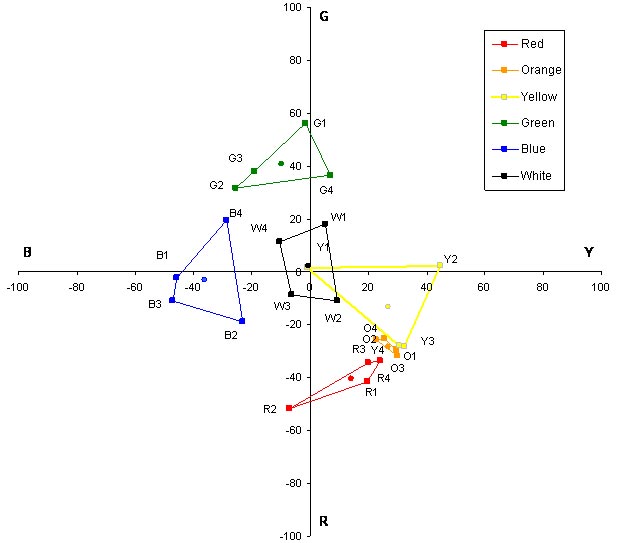
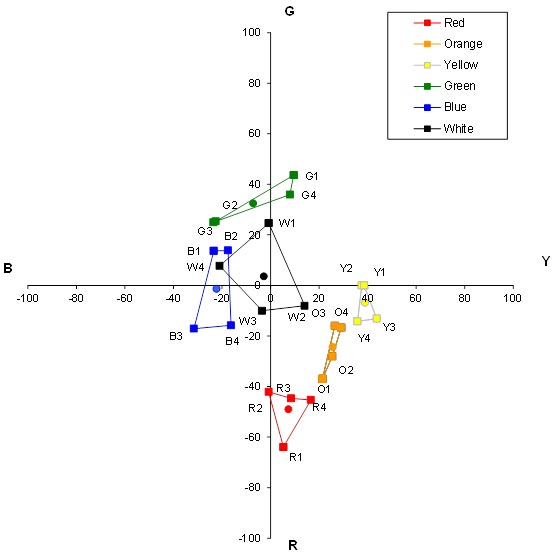
This graph is an expansion of figure 31. It is a Uniform Appearance Diagram (UAD) showing the mean perceptual color ratings given by participant 2. The UAD shows the opponent colors of red and green along the ordinate, ranging from R (red) (-100) at the bottom to G (green) (+100) at the top. The opponent colors of blue and yellow are shown along the abscissa, ranging from B (blue) (-100) at the left to Y (yellow) (+100) at the right. Figure 32 through figure 48 are intended to provide an indication of the variability in the perceptual color rating data due to differences in the mean responses made by different research participants. In all of the UADs, the color boxes follow a similar, recognizable pattern but differ in shape, size, and orientation.
Figure 33. Graph. Mean color ratings for type VIII sheeting for participant 2.


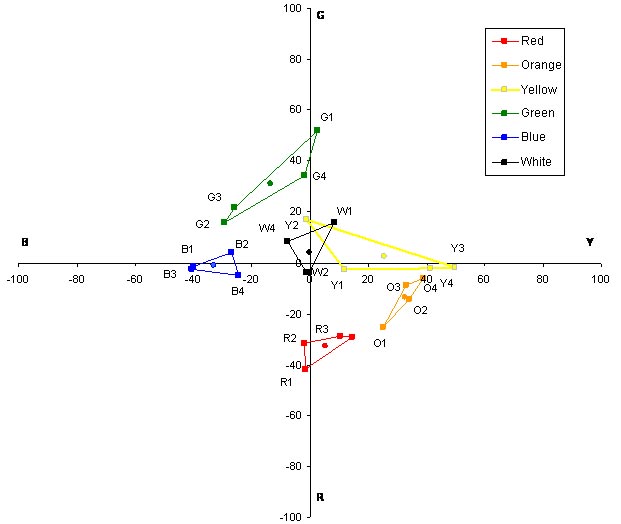
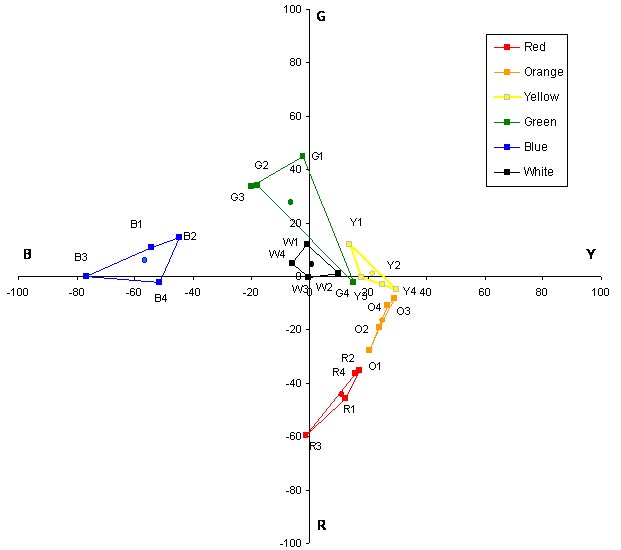
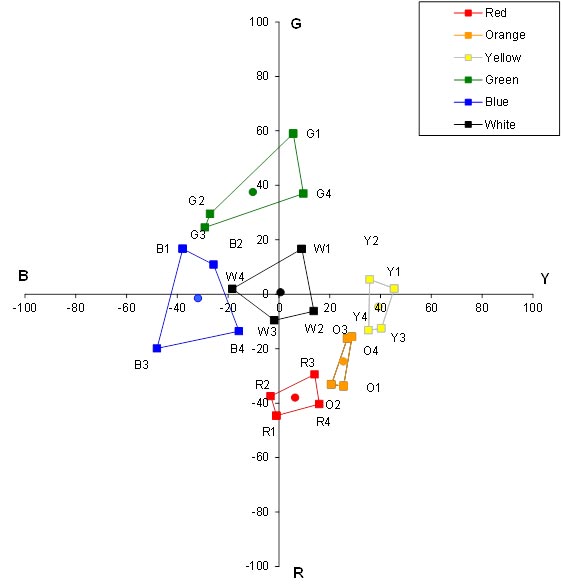
This graph is an expansion of figure 31. It is a Uniform Appearance Diagram (UAD) showing the mean perceptual color ratings given by participant 3. The UAD shows the opponent colors of red and green along the ordinate, ranging from R (red) (-100) at the bottom to G (green) (+100) at the top. The opponent colors of blue and yellow are shown along the abscissa, ranging from B (blue) (-100) at the left to Y (yellow) (+100) at the right. Figure 32 through figure 48 are intended to provide an indication of the variability in the perceptual color rating data due to differences in the mean responses made by different research participants. In all of the UADs, the color boxes follow a similar, recognizable pattern but differ in shape, size, and orientation.
Figure 34. Graph. Mean color ratings for type VIII sheeting for participant 3.


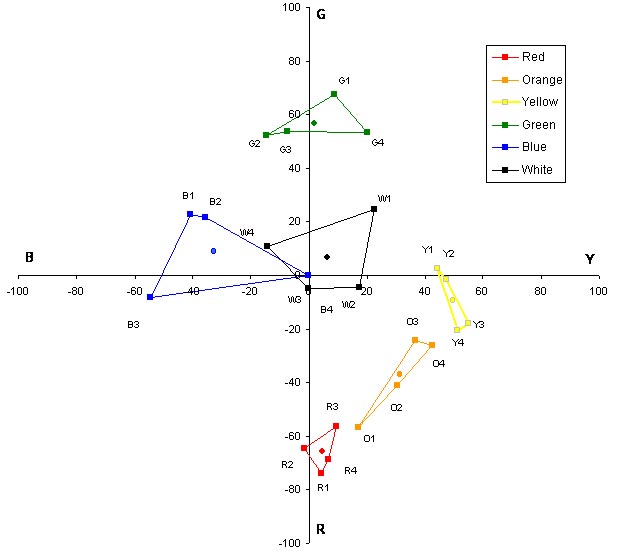
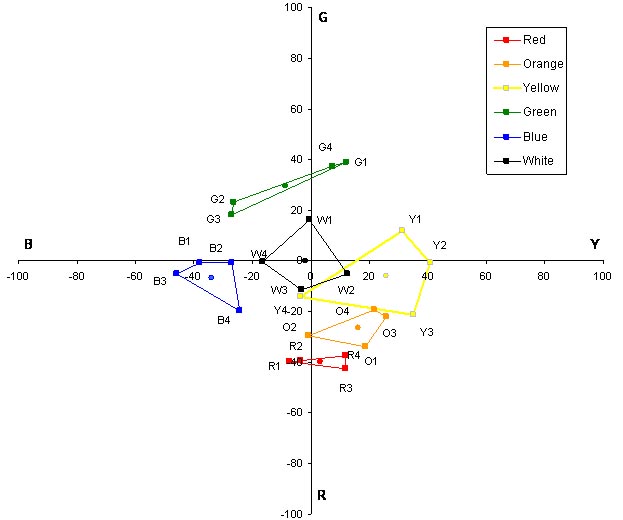
This graph is an expansion of figure 31. It is a Uniform Appearance Diagram (UAD) showing the mean perceptual color ratings given by participant 4. The UAD shows the opponent colors of red and green along the ordinate, ranging from R (red) (-100) at the bottom to G (green) (+100) at the top. The opponent colors of blue and yellow are shown along the abscissa, ranging from B (blue) (-100) at the left to Y (yellow) (+100) at the right. Figure 32 through figure 48 are intended to provide an indication of the variability in the perceptual color rating data due to differences in the mean responses made by different research participants. In all of the UADs, the color boxes follow a similar, recognizable pattern but differ in shape, size, and orientation.
Figure 35. Graph. Mean color ratings for type VIII sheeting for participant 4.


This graph is an expansion of figure 31. It is a Uniform Appearance Diagram (UAD) showing the mean perceptual color ratings given by participant 5. The UAD shows the opponent colors of red and green along the ordinate, ranging from R (red) (-100) at the bottom to G (green) (+100) at the top. The opponent colors of blue and yellow are shown along the abscissa, ranging from B (blue) (-100) at the left to Y (yellow) (+100) at the right. Figure 32 through figure 48 are intended to provide an indication of the variability in the perceptual color rating data due to differences in the mean responses made by different research participants. In all of the UADs, the color boxes follow a similar, recognizable pattern but differ in shape, size, and orientation.
Figure 36. Graph. Mean color ratings for type VIII sheeting for participant 5.


This graph is an expansion of figure 31. It is a Uniform Appearance Diagram (UAD) showing the mean perceptual color ratings given by participant 6. The UAD shows the opponent colors of red and green along the ordinate, ranging from R (red) (-100) at the bottom to G (green) (+100) at the top. The opponent colors of blue and yellow are shown along the abscissa, ranging from B (blue) (-100) at the left to Y (yellow) (+100) at the right. Figure 32 through figure 48 are intended to provide an indication of the variability in the perceptual color rating data due to differences in the mean responses made by different research participants. In all of the UADs, the color boxes follow a similar, recognizable pattern but differ in shape, size, and orientation.
Figure 37. Graph. Mean color ratings for type VIII sheeting for participant 6.


This graph is an expansion of figure 31. It is a Uniform Appearance Diagram (UAD) showing the mean perceptual color ratings given by participant 7. The UAD shows the opponent colors of red and green along the ordinate, ranging from R (red) (-100) at the bottom to G (green) (+100) at the top. The opponent colors of blue and yellow are shown along the abscissa, ranging from B (blue) (-100) at the left to Y (yellow) (+100) at the right. Figure 32 through figure 48 are intended to provide an indication of the variability in the perceptual color rating data due to differences in the mean responses made by different research participants. In all of the UADs, the color boxes follow a similar, recognizable pattern but differ in shape, size, and orientation.
Figure 38. Graph. Mean color ratings for type VIII sheeting for participant 7.


This graph is an expansion of figure 31. It is a Uniform Appearance Diagram (UAD) showing the mean perceptual color ratings given by participant 8. The UAD shows the opponent colors of red and green along the ordinate, ranging from R (red) (-100) at the bottom to G (green) (+100) at the top. The opponent colors of blue and yellow are shown along the abscissa, ranging from B (blue) (-100) at the left to Y (yellow) (+100) at the right. Figure 32 through figure 48 are intended to provide an indication of the variability in the perceptual color rating data due to differences in the mean responses made by different research participants. In all of the UADs, the color boxes follow a similar, recognizable pattern but differ in shape, size, and orientation.
Figure 39. Graph. Mean color ratings for type VIII sheeting for participant 8.


This graph is an expansion of figure 31. It is a Uniform Appearance Diagram (UAD) showing the mean perceptual color ratings given by participant 9. The UAD shows the opponent colors of red and green along the ordinate, ranging from R (red) (-100) at the bottom to G (green) (+100) at the top. The opponent colors of blue and yellow are shown along the abscissa, ranging from B (blue) (-100) at the left to Y (yellow) (+100) at the right. Figure 32 through figure 48 are intended to provide an indication of the variability in the perceptual color rating data due to differences in the mean responses made by different research participants. In all of the UADs, the color boxes follow a similar, recognizable pattern but differ in shape, size, and orientation.
Figure 40. Graph. Mean color ratings for type VIII sheeting for participant 9.


This graph is an expansion of figure 31. It is a Uniform Appearance Diagram (UAD) showing the mean perceptual color ratings given by participant 10. The UAD shows the opponent colors of red and green along the ordinate, ranging from R (red) (-100) at the bottom to G (green) (+100) at the top. The opponent colors of blue and yellow are shown along the abscissa, ranging from B (blue) (-100) at the left to Y (yellow) (+100) at the right. Figure 32 through figure 48 are intended to provide an indication of the variability in the perceptual color rating data due to differences in the mean responses made by different research participants. In all of the UADs, the color boxes follow a similar, recognizable pattern but differ in shape, size, and orientation.
Figure 41. Graph. Mean color ratings for type VIII sheeting for participant 10.


This graph is an expansion of figure 31. It is a Uniform Appearance Diagram (UAD) showing the mean perceptual color ratings given by participant 11. The UAD shows the opponent colors of red and green along the ordinate, ranging from R (red) (-100) at the bottom to G (green) (+100) at the top. The opponent colors of blue and yellow are shown along the abscissa, ranging from B (blue) (-100) at the left to Y (yellow) (+100) at the right. Figure 32 through figure 48 are intended to provide an indication of the variability in the perceptual color rating data due to differences in the mean responses made by different research participants. In all of the UADs, the color boxes follow a similar, recognizable pattern but differ in shape, size, and orientation.
Figure 42. Graph. Mean color ratings for type VIII sheeting for participant 11.


This graph is an expansion of figure 31. It is a Uniform Appearance Diagram (UAD) showing the mean perceptual color ratings given by participant 12. The UAD shows the opponent colors of red and green along the ordinate, ranging from R (red) (-100) at the bottom to G (green) (+100) at the top. The opponent colors of blue and yellow are shown along the abscissa, ranging from B (blue) (-100) at the left to Y (yellow) (+100) at the right. Figure 32 through figure 48 are intended to provide an indication of the variability in the perceptual color rating data due to differences in the mean responses made by different research participants. In all of the UADs, the color boxes follow a similar, recognizable pattern but differ in shape, size, and orientation.
Figure 43. Graph. Mean color ratings for type VIII sheeting for participant 12.


This graph is an expansion of figure 31. It is a Uniform Appearance Diagram (UAD) showing the mean perceptual color ratings given by participant 13. The UAD shows the opponent colors of red and green along the ordinate, ranging from R (red) (-100) at the bottom to G (green) (+100) at the top. The opponent colors of blue and yellow are shown along the abscissa, ranging from B (blue) (-100) at the left to Y (yellow) (+100) at the right. Figure 32 through figure 48 are intended to provide an indication of the variability in the perceptual color rating data due to differences in the mean responses made by different research participants. In all of the UADs, the color boxes follow a similar, recognizable pattern but differ in shape, size, and orientation.
Figure 44. Graph. Mean color ratings for type VIII sheeting for participant 13.


This graph is an expansion of figure 31. It is a Uniform Appearance Diagram (UAD) showing the mean perceptual color ratings given by participant 14. The UAD shows the opponent colors of red and green along the ordinate, ranging from R (red) (-100) at the bottom to G (green) (+100) at the top. The opponent colors of blue and yellow are shown along the abscissa, ranging from B (blue) (-100) at the left to Y (yellow) (+100) at the right. Figure 32 through figure 48 are intended to provide an indication of the variability in the perceptual color rating data due to differences in the mean responses made by different research participants. In all of the UADs, the color boxes follow a similar, recognizable pattern but differ in shape, size, and orientation.
Figure 45. Graph. Mean color ratings for type VIII sheeting for participant 14.


This graph is an expansion of figure 31. It is a Uniform Appearance Diagram (UAD) showing the mean perceptual color ratings given by participant 15. The UAD shows the opponent colors of red and green along the ordinate, ranging from R (red) (-100) at the bottom to G (green) (+100) at the top. The opponent colors of blue and yellow are shown along the abscissa, ranging from B (blue) (-100) at the left to Y (yellow) (+100) at the right. Figure 32 through figure 48 are intended to provide an indication of the variability in the perceptual color rating data due to differences in the mean responses made by different research participants. In all of the UADs, the color boxes follow a similar, recognizable pattern but differ in shape, size, and orientation.
Figure 46. Graph. Mean color ratings for type VIII sheeting for participant 15.


This graph is an expansion of figure 31. It is a Uniform Appearance Diagram (UAD) showing the mean perceptual color ratings given by participant 16. The UAD shows the opponent colors of red and green along the ordinate, ranging from R (red) (-100) at the bottom to G (green) (+100) at the top. The opponent colors of blue and yellow are shown along the abscissa, ranging from B (blue) (-100) at the left to Y (yellow) (+100) at the right. Figure 32 through figure 48 are intended to provide an indication of the variability in the perceptual color rating data due to differences in the mean responses made by different research participants. In all of the UADs, the color boxes follow a similar, recognizable pattern but differ in shape, size, and orientation.
Figure 47. Graph. Mean color ratings for type VIII sheeting for participant 16.


This graph is an expansion of figure 31. It is a Uniform Appearance Diagram (UAD) showing the mean perceptual color ratings given by participant 17. The UAD shows the opponent colors of red and green along the ordinate, ranging from R (red) (-100) at the bottom to G (green) (+100) at the top. The opponent colors of blue and yellow are shown along the abscissa, ranging from B (blue) (-100) at the left to Y (yellow) (+100) at the right. Figure 32 through figure 48 are intended to provide an indication of the variability in the perceptual color rating data due to differences in the mean responses made by different research participants. In all of the UADs, the color boxes follow a similar, recognizable pattern but differ in shape, size, and orientation.
Figure 48. Graph. Mean color ratings for type VIII sheeting for participant 17.


Federal Highway Administration | 1200 New Jersey Avenue, SE | Washington, DC 20590 | 202-366-4000
Turner-Fairbank Highway Research Center | 6300 Georgetown Pike | McLean, VA | 22101