U.S. Department of Transportation
Federal Highway Administration
1200 New Jersey Avenue, SE
Washington, DC 20590
202-366-4000
Federal Highway Administration Research and Technology
Coordinating, Developing, and Delivering Highway Transportation Innovations
| REPORT |
| This report is an archived publication and may contain dated technical, contact, and link information |
|
| Publication Number: FHWA-HRT-16-037 Date: June 2016 |
Publication Number: FHWA-HRT-16-037 Date: June 2016 |
This study focused on comprehension of LCS and VSL signing and how drivers interpret different configurations, symbols, and messages as a function of scenario (e.g., one lane closed ahead, congestion ahead). Participants also rated their preference for alternative ATM signs.
This study employed the sign-testing laboratory at Turner-Fairbank Highway Research Center. Signs were projected on a 60-inch (1.5-m) diagonal LED/LCD. Media Lab® software presented signs and recorded participant responses.(9)
Sign stimuli were created using sign specifications and other information provided by State transportation department staff and a sign manufacturer. All the LCSs were created using vector-based graphics software. Side-mounted CMSs and larger CMSs similar to those deployed in Washington were created in a CMS sign control and message generation software package.
The LCS was created using a matrix of circles that simulated the size and spacing of illuminated pixels on a real sign. (One pixel represents one group of red, blue, green (RGB) LEDs.) Because there were differences in the characteristics of the signs used in the deployment locations, a different matrix was developed for the two different sets of signs. Table 1 shows the characteristics of the sign stimuli based on the actual dimensions, pixel spacing, and color capabilities of the various sign types for each deployment location.
Table 1. Sign stimuli characteristics.
| Deployment Location | Sign Matrix Dimension | Pixel Spacing (Pitch) | Color Capability |
|---|---|---|---|
Washington—LCS |
64 by 64 pixels | 22 mm | Full color |
Washington—SMS |
80 by 80 pixels | 22 mm | Full color |
Washington—CMS |
80 by 235 pixels | 22 mm | Amber |
Minnesota |
64 by 80 pixels | 20 mm | Full color |
1 mm = 0.039 inches.
SMS = State-mounted dynamic message sign.
The scenarios were developed using information provided by the two State transportation departments that described typical standard operating procedures used in those locations.(10)
The participants were presented a series of ATM signs representing a given scenario, with fiveATM signs per scenario. The five scenarios were as follows:
Two variations for these scenarios were presented to the participants. One variation was similar to the signs used in the Washington deployment, and the second was similar to the deployment in Minnesota. Figure 1 shows an example of a scene used in the scenario sign comprehension test. For each of the signs, the participants were asked the following questions:
. This photo shows a four-lane highway with active traffic management signs over each lane and a changeable message sign on the gantry to the right. From left to right, the signs show a high-occupancy vehicle restriction sign, illustrated by a diamond shape and the text \"2+ ONLY\"; a closed lane shown by a red X; and two lanes open to traffic shown by green arrows.")
Figure 1. Photo. Example slide from the scenario sign comprehension test (sign based on Washington deployment).
Figure 2 is a composite of five pictures for the VSL scenario (i.e., congestion). In the study, each of the photos was presented individually with the order of presentation proceeding from bottom to top of figure 2.
The first gantry showed the per lane signs in their "resting" condition (i.e., the signs are blank). The CMS on the right side informed the driver that there was a reduced speed zone ahead. The drivers should remain in their lane and drive within the speed limit. The second gantry showed a speed reduction to 45 mi/h (72 km/h) in the three right lanes. The third gantry showed a further reduction in the speed limit to 35 mi/h (56 km/h) in the three right lanes and to 45 mi/h (72km/h) in the left lane. The drivers should remain in their lane and slow down to the new speed limit. The fourth gantry showed the speed limit had returned to the facility-set speed limit. The drivers could increase their speed to the new limit. The fifth gantry showed the signs in their "resting" condition. Drivers should now comply with the facility speed limit.
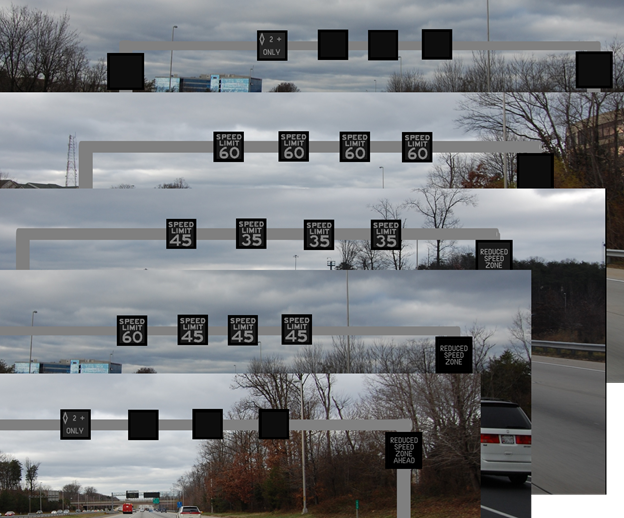
Figure 2. Screen capture. VSL scenario that shows the progression of what a driver would see driving down the road, going from bottom to top.
All of the scenarios based on a given State were presented together. The order of presentation of the scenarios was counterbalanced across participants. Half of the participants viewed the Washington-based scenarios first and the Minnesota-based ones second. The other half of the participants viewed the same signs in the reverse order.
Following the scenarios, participants were presented individual ATM signs for additional comprehension assessment. This assessment only included 45 LCSs that were presented in a different random order for each participant. The following sections describe the sign alternatives for the following LCS message categories: lane open, lane open with caution, lane closed, lane closed ahead, merge, and speed limit (regulatory or advisory).
Two different signs were shown. Both signs showed a downward pointing arrow in which onesign was based on the Washington deployment (see figure 3) and the other based on the Minnesota deployment (see figure 4).
![]()
Figure 3. Graphic. Lane open sign adapted from Washington State deployment.
![]()
Figure 4. Graphic. Lane open sign adapted from Minnesota deployment.
Two different signs were shown based on the Minnesota deployment. One was a yellow arrow pointing down that flashes (at 1 Hz), and the second sign was the same yellow arrow in a static state (see figure 5).
![]()
Figure 5. Graphic. Flashing or static lane open with caution sign adapted from Minnesota deployment.
Three lane closed signs were included: (1) red X as used in Washington (see figure 6), (2) red X with the word "CLOSED" as used in Minnesota (see figure 7), and (3) red X as used in Minnesota without text legend.
![]()
Figure 6. Graphic. Lane closed sign adapted from the Washington State deployment.
![]()
Figure 7. Graphic. Lane closed sign adapted from the Minnesota deployment.
![]()
Figure 8. Graphic. Lane closed alternative without text legend.
Five lane closed ahead signs were included: (1) yellow X with "1 mile" legend in white text (see figure 9), (2) thick yellow X without a text legend (see figure 10), (3) yellow X with "1 mile" legend as used in Minnesota (see figure 11), (4) yellow X with "1 mile" legend in yellow text (see figure 12), and (5) thin yellow X without a text legend (see figure 13).
![]()
Figure 9. Graphic. Lane closing in 1 mi sign adapted from Washington State deployment.
![]()
Figure 10. Graphic. Lane closing sign adapted from Washington State deployment.
![]()
Figure 11. Graphic. Lane closing in 1 mi sign adapted from Minnesota deployment.
![]()
Figure 12. Graphic. Alternative lane closing sign with yellow legend.
![]()
Figure 13. Graphic. Alternative lane closing sign.
Eighteen different yellow merge signs were shown to the participants. Nine of the signs used chevrons based on the signs in Minnesota: three signs with streaming chevrons for merge right (see figure 14), left (see figure 15), and split (see figure 16), each with the "MERGE" legend; three signs with streaming chevrons for merge left, right, and split without the word "MERGE" (see figure 17); and three signs with static chevrons for merge left, right, and split, with the "MERGE" legend (see figure 14 through figure 16 for a similar image). Nine different merge signs were based on the Washington deployment: three signs had the diagonal yellow arrow for merge left, right, and split; three signs had the diagonal yellow arrow for merge left (see figure 18), right, and split (see figure 19), each with the addition of the word "MERGE" in white text; and three signs had the diagonal yellow arrow for merge left, right, and split with the addition of the word "MERGE" in yellow text. In the Washington ATM deployment, white text was used, and so those signs were replicated here.
![]()
Figure 14. Graphic. Merge right sign adapted from Minnesota deployment.
![]()
Figure 15. Graphic. Merge left sign adapted from the Minnesota deployment.
![]()
Figure 16. Graphic. Merge split sign adapted from Minnesota deployment.
![]()
Figure 17. Graphic. Example of merge sign without the text legend.
![]()
Figure 18. Graphic. Merge left sign adapted from Washington State deployment.
![]()
Figure 19. Graphic. Merge split sign adapted from Washington State deployment.
White (regulatory speed limit) and yellow (advisory speed limit) signs were also presented to participants. For each function type (regulatory or advisory), there were signs using legends with the following combinations: number only (see figure 20); "SPEED LIMIT" preceding a number (see figure 21); and "MPH" following the number (see figure 22). In addition, a version of the Washington speed limit and Minnesota advisory speed limit signs with negative contrast were shown (see figure 23). A total of 15 speed limit signs were presented. Eight of the signs had larger fonts, as used in Washington, and seven had smaller fonts as used in the Minnesota deployment (see figure 24). Each VSL sign was presented once in yellow and black and once in white and black (e.g., figure 25). Although the use of yellow with the "SPEED LIMIT" text legend was inconsistent with the MUTCD, such signs were included to assess whether participants would detect the contradiction between regulatory wording and advisory coloring.(8)
![]()
Figure 20. Graphic. Number-only regulatory speed limit sign with large font.
![]()
Figure 21. Graphic. VSL adapted from Washington deployment.
![]()
Figure 22. Graphic. VSL with "MPH" legend and large font.

Figure 23. Graphic. VSL with negative contrast.
![]()
Figure 24. Graphic. VSL with font and color adapted from Minnesota deployment.
![]()
Figure 25. Graphic. VSL with yellow (advisory) colors.
Following the presentation of the individual signs, the participants were presented the signs in each of the previously defined categories simultaneously on the LED/LCD. The participants' task was to select the sign that they preferred and to indicate why they preferred the selected sign.
There were 26 participants (14 males and 12 females). Participants ranged in age from 20 to 56years old, with a mean age of 36 years old.
Participants were tested individually and instructed to assume they were driving alone and in the left-center lane of a multilane freeway (four lanes in each direction). For the Washington-based scenarios, the participants were instructed that the speed limit was 60 mi/h (97 km/h) unless posted otherwise. For the Minnesota-based scenarios, they were instructed that the speed limit was 55mi/h (89 km/h). This was done to replicate the speed limits used in the Washington and Minnesota ATM deployments.
Scenarios were presented one picture at a time. There were five pictures for all of the scenarios except for the resting condition, which had four pictures. For each picture, participants were instructed to indicate when they were ready to describe what they would do in response to the depicted sign array, at which point the picture was removed from the screen. The accuracy of response was stressed over response time. The researcher recorded participant answers. This procedure was repeated for each picture in each scenario.
A brief break was taken when switching between the two types of scenarios (i.e., Washington or Minnesota deployments).
For convenience, this report describes the scenarios as emulating the Minnesota or Washington approaches. It is important to note that there was no intent to compare or evaluate the approaches taken in those States. Rather the intent was to explore a range of content and contexts. The existing experimental deployments provided sources of content and contexts. Some of the sign content was novel and not used in either deployment. An example of novel content was the use of white legends that implied a regulatory message with yellow symbols that implied advisory messages.
There were five scenarios that were intended to emulate the Minnesota ATM approach by using LCS and VSL content similar to that used in the State and suspending the per-lane CMS below conventional freeway signage.
The first Minnesota scenario contained the following pictures:
The second Minnesota scenario contained the following pictures:
The third Minnesota scenario contained the following pictures:
The fourth Minnesota scenario contained the following pictures:
The fifth "resting" Minnesota scenario contained four pictures in which the conventional signage was the same as in the four other Minnesota scenarios. The per-lane CMSs were the same in all four pictures. That is, the diamond symbol was displayed over the HOV lane in each picture, and the CMSs over the other three lanes were blank.
There were five scenarios that were intended to emulate the Washington State ATM approach by using LCS and VSL content similar to that used in the State and suspending the per-lane CMS on gantries dedicated to ATM. In addition to the per-lane CMS, the Washington approach sometimes included a somewhat larger side-mounted CMS that provides additional information regarding the over-lane messaging.
The Washington scenarios also depicted four freeway lanes, with the leftmost lane dedicated to HOV. The first scenario contained the following pictures:
The second Washington scenario contained the following pictures:
The third Washington scenario contained the following pictures:
The fourth Washington scenario contained the following pictures:
The fifth Washington scenario contained the following pictures:
Following the assessment of sign comprehension in scenario contexts, each content display alternative was presented individually. Participants were asked what they thought the sign was intended to mean and how they would respond to it. This task was self-paced, and accuracy was stressed.
Next, for each set of alternative contents intended to have the same meaning (e.g., the speed limit, lane merge, or lane closure), participants were presented with all the alternatives together and asked to select their preferred alternative and to explain reasons for their selection.
Participant responses to each scenario are described in terms of meaning and stated actions. For the preference ratings, Chi squared tests of association or z-tests for two proportions are reported.
Washington-Based Signs
Congestion Ahead Scenario:
The participants generally interpreted the signs appropriately and proposed taking appropriate actions. There were very few responses that could be interpreted as incorrect. An example of an inappropriate interpretation by two participants occurred in response to the second picture in the first Washington scenario (see figure 26). Those participants indicated that they would move into the HOV lane and drive 60 mi/h (97 km/h). Because the participants were told that they were to assume that they were driving alone in their vehicle, this was an inappropriate response.
. The figure shows a four-lane highway with active traffic management signs over each lane and a changeable message sign on the gantry to the right. The speed limit sign over the left lane is \"SPEED LIMIT 60 MPH,\" and the other three lanes have a speed limit sign that shows \"SPEED LIMIT 45 MPH.\" The CMS shows \"REDUCED SPEED ZONE.\"")
Figure 26. Photo. Second picture in the congestion ahead scenario (Washington-based sign).
For the third picture in the scenario, there was one inappropriate response in which the participant indicated that he/she would drive in the HOV lane. For the rest of the pictures, theparticipants made responses that were consistent with the signs' intended meaning.
Incident With Center Lane Closed Scenario:
The participants generally interpreted the signs correctly and proposed taking appropriate actions based on the signs. For the first picture in the scenario, 8 of 26 participants indicated that they would change lanes immediately. Figure 27 shows the first picture for this scenario. The intended meaning of this sign was that drivers should prepare to merge because the lane would be closed ahead. The third picture in the series showed a red X over the center lanes, which is intended to indicate that the lane is closed. One of the participants said the red X meant that drivers should prepare to exit.
 on the gantry on both the right and left. From left to right, the overhead signs show a high-occupancy vehicle lane designated by a diamond shape and the text \"2+ ONLY\" an open lane, a lane-closed split-merge, and an open lane. The CMSs show \"1 CENTER LANE CLOSED AHEAD.\"")
Figure 27. Photo. First picture in the incident with center lane closed scenario.
Incident With Two Right Lanes Closed Scenario:
The participants had problems interpreting the signs correctly; however, given their assumed travel lane and task (driving in the left-center lane), their proposed actions based on the signs were generally appropriate. More than half of the participants interpreted the first picture to mean the two right lanes were closed ahead. One participant indicated he was confused because he could not understand how the right two lanes could be open and closed at the same time. The side-mounted sign on the first gantry indicated the right two lanes were closed, and the side-mounted sign on the second gantry indicated the two right lanes were for exit only. The participants correctly interpreted the last three signs in the scenario.
Incident With Right-Center Lane Closed Scenario:
Participants generally interpreted the signs correctly and proposed taking appropriate actions based on the signs. However, for the first photo in the scenario, there were seven responses that were incorrect. More specifically, participants indicated they would merge out of the center lane. In the directions for these scenarios, the participants were told to assume that they were driving in the left-center lane (lane2) and so at this point in the scenario they were not informed which lane was to be closed. In fact, the right-center lane (lane 3) was the one closed in the scenario and so the best strategy for the participants was to stay in their current lane. For the rest of the pictures in the scenario, the participants gave correct interpretations and proposed actions.
Resting Condition Scenario:
The participants generally interpreted the signs correctly and proposed taking appropriate actions based on the signs. A concern sometimes voiced was that blank signs might be interpreted as broken or out of operation. Half of the participants were shown these blank signs (see figure 28) at the beginning of the scenario testing, and the other half were shown these blank signs at the end. There appeared to be no effect of seeing the resting condition photo first or last. Participants made similar interpretations for these signs whether they were shown at the beginning or end of the experiment.
 on the gantry to the right. The left lane shows a high-occupancy vehicle lane restriction sign, which is a diamond with the text \"2+ ONLY\". The signs above the other three lanes are blank. The CMS on the gantry on the right shows \"SPEED LIMIT 60.\"")
Figure 28. Photo. Picture for the resting condition for Washington-based signs.
Minnesota-Based Signs
Congestion Ahead Scenario:
The participants generally interpreted the ATM signs correctly and proposed taking appropriate actions based on the signs. They also frequently interpreted the advisory VSL signs as regulatory speed limit signs. Errors in interpretation were made regarding the guide signs—some participants interpreted the guide signs to indicate that the right lane was an exit lane.
Incident With Center Lane Closed Scenario:
The participants generally interpreted the ATM signs correctly and proposed taking appropriate actions based on the signs. They also incorrectly interpreted the guide signs, stating that the center lanes were to Front Royal, and the right lane was an exit lane. Participants continued to interpret the advisory VSL signs as regulatory speed limit signs.
Incident With Two Right Lanes Closed Scenario:
The participants had problems interpreting the ATM signs correctly (see figure 29 for a picture from this scenario). However, given their assumed travel lane and task, their proposed actions based on the signs were generally correct. This was a challenging scenario in that participants had been instructed to exit at US-50 where the ATM signs indicated that the two right lanes were closed. Also, the pictures that were modified to create the stimuli presented a large number of ATM sign violators (other vehicles in the closed lanes). The participants continued to misinterpret the guide signs where the right lane was thought to be an exit lane. This error in interpretation was independent from the use of the ATM signs.
 signs over each lane, mounted below the highway navigation signs. The ATM sign above the left lane shows a high-occupancy vehicle restriction sign represented by a diamond. The ATM sign above the second lane from the left shows an open lane with a yellow arrow, and the ATM signs above the two right lanes indicate lane closures with a red X.")
Figure 29. Photo. Picture shown for the two right lanes closed scenario for the Minnesota-based signs.
Incident With Right-Center Lane Closed Scenario:
The participants generally interpreted the ATM signs correctly and proposed taking appropriate actions based on the signs. About one-half of the participants thought the flashing yellow arrow meant to proceed with caution in the lane. The other participants interpreted the sign to mean that the lane was open. One participant found the flashing yellow arrow to be confusing. About one-half of the participants interpreted the advisory VSL signs as regulatory speed limit signs. Again, some participants misinterpreted the guide signs where the right lane was thought to be an exit lane. This error was independent from the ATM signs.
Resting Condition Scenario:
The participants generally interpreted the signs correctly and proposed taking appropriate actions based on the signs. As with the Washington-based signs, one-half of the participants were shown this sign at the beginning of test and the other half at the end. There appeared to be no effect of seeing the resting condition sign either first or last. The participants' interpretations of the resting condition signs were the same for the two presentation orders.
Lane Open (Green Arrow)
The participants correctly interpreted these signs (see options in figure 30) as indicating that the lane was open and that they could continue to stay in their lane (see table 2). This was true for the Minnesota- and Washington-style signs.
Participants preferred the larger green arrow, as used in the Washington deployment (Z = 3.46, p<0.001). The participants stated that the bolder and larger green arrow was more legible and easier to interpret from far away, as shown in option A of figure 30.
 similar to a symbol used in Washington and (B) similar to a symbol used in Minnesota. This figure shows a comparison of two active traffic management signs. Sign A on the left shows a thick green arrow pointing down, which indicates that the lane is open. Sign B on the right shows thin green arrow pointing down, which indicates that the lane is open.")
Figure 30. Screen capture. Screen used to rate preference for two lanes open LCS where (A) similar to a symbol used in Washington and (B) similar to a symbol used in Minnesota.
Table 2. Percent correct and percent preference of lane open LCS.
| Label for Figure 30 | Sign Choice (percent) | |
|---|---|---|
| A | B | |
Lane OpenM |
92 | 96 |
Thru TrafficM |
4 | 0 |
Stay In LaneM |
4 | 4 |
Continue/Stay in LaneA |
100 | 96 |
NothingA |
0 | 4 |
Preference |
96 | 4 |
M Indicates interpretation of meaning.
A Indicates intended action.
Lane Open With Caution
The responses to the yellow arrow signs shown in figure 31 are presented in table 3. The sign was supposed to convey that the lane was open, but extra caution was warranted. As can be seen in table 3, only 16 to 19 percent of participants had the desired response of proceeding with caution.
The participants showed no clear preference for either the flashing or non-flashing yellow arrow. The participants who selected the flashing arrow stated that it was more attention getting. On the other hand, the participants who selected the non-flashing arrow sign stated that the flashing arrow was distracting.
 static and symbol B (right) similar to A but cycled on and off at 1 Hz. This figure shows a comparison of two active traffic management signs. Sign A on the left shows a static yellow arrow pointing down indicating a lane closure ahead. Sign B on the right shows a yellow arrow that cycles on and off at 1 Hz. In this figure, it is in the off cycle.")
Figure 31. Screen capture. Screen used to rate preference of two lanes open with caution symbols with symbol A (left) static and symbol B (right) similar to A but cycled on and off at 1 Hz.
Table 3. Percent correct and percent preference for yellow lane open with caution arrow.
| Label for Figure 31 | Sign Choice (percent) | |
|---|---|---|
| Static (A) | Flashing (B) | |
Lane OpenM |
29 | 29 |
Lane Opens With CautionM |
29 | 32 |
Caution/Slow DownM |
21 | 29 |
Lane ClosingM |
0 | 4 |
Stay in LaneM |
21 | 7 |
Slow DownA |
16 | 23 |
Merge Out of LaneA |
9 | 26 |
Continue in LaneA |
56 | 32 |
Proceed with CautionA |
16 | 19 |
Maintain SpeedA |
3 | 0 |
Preference |
62 | 38 |
M Indicates interpretation of meaning.
A Indicates intended action.
Merge
Comprehension and preference findings for the merge right options (see figure 32) are shown in table 4, merge left options (see figure 33) are shown in table 5, and merge left or right options (see figure 34) are shown in table 6. The comprehension findings were similar across merge types. Participants indicated that they were to move out of their lane and merge in the direction indicated by the sign.
In all three merge cases, participants preferred the streaming chevrons merge symbols to the other symbol options: merge right (χ2 (5) = 28.92, p < 0.001); merge left (χ2 (5) = 29.85, p < 0.001); and merge right or left (χ2 (5) = 15.08, p < 0.05).

Note: Options B and C were streaming.
Figure 32. Screen capture. Merge right options screened for preference.
Table 4. Percent correct and percent preference for merge right options.
| Label for Figure 32 | Sign Choice (percent) | |||||
|---|---|---|---|---|---|---|
| A | B | C | D | E | F | |
Merge RightM |
96 | 93 | 96 | 93 | 96 | 93 |
Lane Going to RightM |
0 | 0 | 4 | 0 | 0 | 0 |
CautionM |
0 | 0 | 0 | 0 | 4 | 3.5 |
Lane ClosedM |
4 | 3.5 | 0 | 7 | 0 | 3.5 |
Construction AheadM |
0 | 3.5 | 0 | 0 | 0 | 0 |
Merge RightA |
90 | 100 | 100 | 100 | 87 | 90 |
CautionA |
3.3 | 0 | 0 | 0 | 6.5 | 3.3 |
Slow DownA |
3.3 | 0 | 0 | 0 | 6.5 | 3.3 |
OtherA |
3.3 | 0 | 0 | 0 | 0 | 3.3 |
Preference |
15 | 54 | 0 | 0 | 4 | 12 |
M Indicates interpretation of meaning.
A Indicates intended action.

Note: Options B and D were streaming.
Figure 33. Screen capture. Merge left options screened for preference.
Table 5. Percent correct and percent preference for merge left options.
| Label for Figure 33 | Sign Choice (percent) | |||||
|---|---|---|---|---|---|---|
| A | B | C | D | E | F | |
Merge LeftM |
93 | 100 | 96 | 100 | 96 | 100 |
Lane Going to LeftM |
0 | 0 | 4 | 0 | 0 | 0 |
CautionM |
3.5 | 0 | 0 | 0 | 0 | 0 |
Lane ClosedM |
3.5 | 0 | 0 | 0 | 4 | 0 |
Merge LeftA |
96 | 96 | 93 | 100 | 93 | 100 |
CautionA |
4 | 0 | 3.5 | 0 | 3.5 | 0 |
Slow DownA |
0 | 4 | 3.5 | 0 | 3.5 | 0 |
Preference |
8 | 54 | 4 | 0 | 19 | 15 |
M Indicates interpretation of meaning.
A Indicates intended action.

Note: Options A and C were streaming.
Figure 34. Screen capture. Merge left or right options screened for preference ratings.
Table 6. Percent correct and percent preference for merge left or right options.
| Label for Figure 34 | Sign Choice (percent) | |||||
|---|---|---|---|---|---|---|
| A | B | C | D | E | F | |
Merge Left or RightM |
93 | 80 | 84 | 89 | 84 | 79 |
Stay Out of LaneM |
0 | 3.5 | 0 | 0 | 0 | 3.5 |
Lane ClosedM |
7 | 13 | 16 | 7 | 13 | 14 |
Road SplitsM |
0 | 3.5 | 0 | 0 | 0 | 3.5 |
Left and Right Lanes OpenM |
0 | 0 | 0 | 4 | 0 | 0 |
CautionM |
0 | 0 | 0 | 0 | 3 | 0 |
Merge Left/RightA |
100 | 93 | 87 | 96 | 93 | 93 |
Caution/Slow DownA |
0 | 7 | 13 | 4 | 7 | 7 |
Preference |
0 | 15 | 38 | 19 | 23 | 4 |
M Indicates interpretation of meaning.
A Indicates intended action.
Lane Closed Ahead
Comprehension and preference findings for the lane closed ahead options without a legend (see figure 35) and with a legend (see figure 36) are shown in table 7 and table 8, respectively. When the legend was not present, participants frequently interpreted the sign as meaning the lane was currently closed. With the inclusion of the legend, participants made the correct interpretation that the lane was closing in the near future. Regardless of the inclusion of the legend, however, participants did indicate that they were to move out of their lane.
When the legend was not present, participants preferred the larger and bolder version, as deployed in Washington, because it was easier to read (χ2 (1) = 7.54, p < 0.01). Participants had no preference when the legend was included.

Figure 35. Screen capture. Lane closed ahead options without legend screened for preference ratings.
Table 7. Percent correct and percent preference for lane closed ahead options without legend.
| Labels for Figure 35 | Sign Choice (percent) | |
|---|---|---|
| A | B | |
CautionM |
0 | 8 |
Lane ClosedM |
65 | 73 |
Lane Closing AheadM |
14 | 12 |
Slow Down/Caution AheadM |
14 | 0 |
Delay AheadM |
7 | 0 |
Reduced SpeedM |
0 | 3.5 |
MergeM |
0 | 3.5 |
Change LanesA |
93 | 82 |
Slow/Caution/Be AwareA |
7 | 7 |
Avoid LaneA |
0 | 11 |
Preference |
77 | 23 |
M Indicates interpretation of meaning.
A Indicates intended action.

Figure 36. Screen capture. Lane closed ahead options with legend screened for preference ratings.
Table 8. Percent correct and percent preference for lane closed ahead options with legend.
| Labels for Figure 36 | Sign Choice (percent) | ||
|---|---|---|---|
| A | B | C | |
Lane Closed in 1 MiM |
92 | 93 | 86 |
Caution in 1 MiM |
8 | 0 | 0 |
CautionM |
0 | 3.5 | 7 |
Delay in 1 MiM |
0 | 0 | 3.5 |
Next Mi Lane ClosedM |
0 | 0 | 3.5 |
Avoid Lane for 1 MiM |
0 | 3.5 | 0 |
Change LanesA |
86 | 93 | 86 |
Slow/CautionA |
10 | 7 | 10 |
Avoid Lane for 1 MiA |
4 | 0 | 4 |
Preference |
31 | 27 | 42 |
M Indicates interpretation of meaning.
A Indicates intended action.
Lane Closed
Comprehension and preference findings for the lane closed options (see figure 37) are shown in table 9. For all options, participants correctly indicated that the lane was closed and that they should vacate their lane.
Participants preferred the lane closed option with the legend, similar to the Minnesota deployment, claiming the legend provided useful information (Z = 2.13, p < 0.05).

Figure 37. Screen capture. Lane closed options screened for preference ratings.
Table 9. Percent correct and percent preference for lane closed options.
| Labels for Figure 37 | Sign Choice (percent) | ||
|---|---|---|---|
| A | B | C | |
Lane ClosedM |
92 | 92 | 92 |
Lane Closed AheadM |
8 | 8 | 8 |
Exit Lane/Merge OutA |
77 | 81 | 100 |
Not Use LaneA |
23 | 19 | 0 |
Preference |
73 | 27 | 0 |
M Indicates interpretation of meaning.
A Indicates intended action.
Variable Speed Signs
Seven white (regulatory) speed limit signs were presented. For all of the options, the majority of participants correctly interpreted the signs as a speed limit. However, one participant did interpret the option with the number 45 and no legend to mean Route 45.
Two regulatory speed limit signs (see figure 38) were evaluated with respect to preference. Comprehension and preference results for these two options are shown in table 10. The difference in comprehension percent between the positive and negative contrast signs was not statistically significant (p = 0.298). Participants preferred the positive contrast version where they stated that it was easier to read compared with the negative contrast sign (Z = 3.05, p < 0.01).

Figure 38. Screen capture. Regulatory speed limit options screened for preference ratings.
Table 10. Percent correct and percent preference for regulatory speed limit options.
| Labels for Figure 38 | Sign Choice (percent) | |
|---|---|---|
| A | B | |
Speed Limit 45M |
96 | 88 |
45 mi/hM |
4 | 12 |
Drive 45 mi/hA |
92 | 92 |
ContinueA |
4 | 4 |
OtherA |
4 | 4 |
Preference |
12 | 88 |
1 mi/h = 1.6 km/h.
M Indicates interpretation of meaning.
A Indicates intended action.
Eight yellow (advisory) speed limit signs were presented. For all of the options, the majority of participants also interpreted the signs as a regulatory speed limit. For the 45-mi/h (72-km/h) sign in negative contrast, one participant indicated that this was an advisory sign.
Four advisory speed limit signs (see figure 39) were evaluated with respect to preference. Comprehension and preference results for these four options are shown in table 11. The differences in comprehension percent across the four conditions are not statistically significant. The positive contrast sign currently in the MUTCD was preferred where the participants indicated that it was easier to read (χ2 (3) = 49.69, p < 0.001).

Figure 39. Screen capture. Advisory speed limit options screened for preference ratings.
Table 11. Percent correct and percent preference for advisory speed limit options.
| Labels for Figure 39 | Sign Choice (percent) | |||
|---|---|---|---|---|
| A | B | C | D | |
Speed Limit 45M |
58 | 46 | 70 | 54 |
45 mi/hM |
35 | 43 | 22 | 39 |
Advisory SpeedM |
0 | 4 | 4 | 0 |
CautionM |
3.5 | 7 | 4 | 3.5 |
ConstructionM |
0 | 0 | 0 | 3.5 |
OtherM |
3.5 | 0 | 0 | 0 |
Drive 45 mi/hA |
92 | 88 | 92 | 88 |
ContinueA |
4 | 4 | 4 | 4 |
Caution/Slow DownA |
4 | 8 | 0 | 4 |
Other A |
0 | 0 | 4 | 0 |
Preference |
8 | 8 | 0 | 84 |
1 mi/h = 1.6 km/h.
M Indicates interpretation of meaning.
A Indicates intended action.
The scenario testing portion of this study used the signs as deployed in Washington and Minnesota. In general, the results showed that the participants correctly interpreted the ATM signs as they were presented in a sequence for a given scenario. The participants in this study had no previous experience with these types of signs, suggesting that the ATM signs were, for the most part, intuitive. Errors included interpreting advisory VSL signs as regulatory speed limit signs, incorrectly interpreting the guide signs (not ATM signs), misinterpreting the yellow X sign without a text legend, and confusing the meaning of the yellow arrow (either flashing or static). Participants were challenged in the scenario in which the two right lanes were closed except for the exit. One participant stated, "How can the lanes be open and closed at the same time?" An EXIT ONLY sign over the affected lanes might have aided the participants in selecting the appropriate response in this scenario.
The individual sign testing also resulted in high levels of comprehension. The problematic signs included the following:
The other tested signs showed high levels of comprehension, but differences in preference.
These results are based on static testing in which participants needed only to pay attention to the signs. There was no driving task or other workload present in the test situation. The ATM signs were displayed in a highway environment where there was traffic and drivers may need to make route choices (e.g., take an exit). Additional testing was conducted in the Highway Driving Simulator to evaluate comprehension, as well as the actions that drivers took in response to the signs under a variety of scenarios (see chapters 4 and 5).

