U.S. Department of Transportation
Federal Highway Administration
1200 New Jersey Avenue, SE
Washington, DC 20590
202-366-4000
Federal Highway Administration Research and Technology
Coordinating, Developing, and Delivering Highway Transportation Innovations
 |
| This report is an archived publication and may contain dated technical, contact, and link information |
|
Publication Number: FHWA-RD-02-082 Date: August 2006 |
The test section consists of nine 12.2-m-long slabs on the northbound shoulder of Route 72 in Newark, DE. There are five control sections with no treatment and four test sections that had lithium hydroxide applied as a surface treatment to mitigate ASR damage. The test site starts with the second full slab past the entrance to the University of Delaware Agricultural Experimentation Station. The sections are ordered as follows: control 1, test 1, test 2, control 2, control 3, control 4, test 3, test 4, control 5. The test location includes a gradual right-hand turn and sag vertical curve, with section control 3 containing drains at the low point. Sections control 1, test 1, test 2, control 2, and control 3 are sloped more steeply downward toward the drains than the other sections. Because of the grade changes and the location of the test area, sections control 1, 2, and 3 and test sections 1 and 2 could be expected to carry significantly more water during storms than test sections 3 and 4 and control sections 4 and 5. An overall view of the section is shown in figure 22.
Figure 22. North and south views of the Newark, DE site.
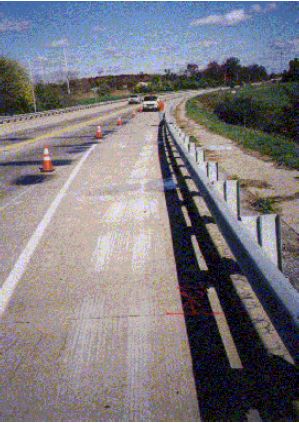 | 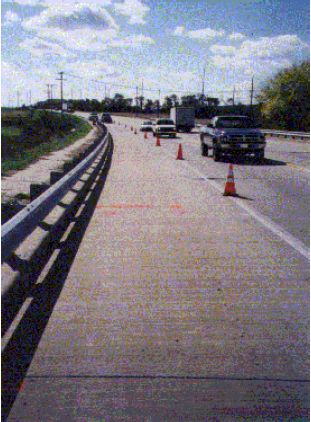 |
| (a) (site looking north) | (b) (site looking south) |
For the Newark test site, visual surveys for map cracking and joint spalling, relative humidity sampling, and drilling of cores for modulus and strength were performed for each of the 5 years of study. FWD tests were performed, and the results are presented in a section near the end of this report. Table 14 lists when the site inspections were performed and the weather conditions.
| Inspection Date | Weather |
|---|---|
| November 29, 1994 | Cool, sunny |
| November 28, 1995 | Cloudy, 50–60 °F |
| November 21, 1996 | Cold, overcast, 35–45 °F |
| December 9, 1997 | Cold, Sunny |
| October 22, 1998 | Cool, breezy, sunny, 40–45 °F, pavement wet |
°C = (°F-32)/1.8
Since the FHWA LTPP structurally oriented rating system did not adequately describe the pavement condition, the LTPP sheets were filled out using the following conventions:
The cracking was principally longitudinal with only minor transverse cracks that sometimes interconnected the longitudinal cracks. The cracking appears to be related to ASR damage, but it has not manifested itself in the typical pattern or map cracking. The longitudinal cracking pattern may be related to the restraint conditions of the shoulder. Expansion of the shoulder concrete may be easier toward the soil side of the pavement than against more rigid pavement. Lower restraint allows cracking to occur easier in the longitudinal direction. This type of cracking is commonly seen in prestressed beams with ASR, where cracking is seen only parallel to the prestressing strand.
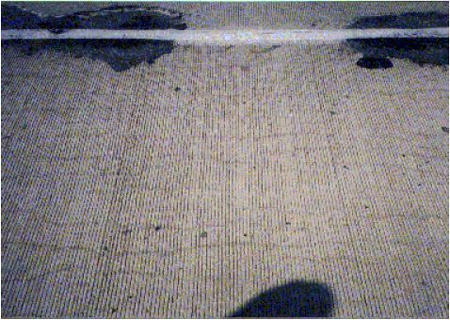
Extensive longitudinal cracking, with cracks more closely spaced near the longitudinal joint with the adjacent travel lane, was noted in all sections. The longitudinal cracks were usually short with no inter-connecting transverse cracks. Figures 23 and 24 show photographs of typical longitudinal cracking. Figure 24 also shows some of the typical asphalt patching along the longitudinal joint between the shoulder and travel lanes. The only areas within the sections not covered with longitudinal cracking are along the curb side. Table 15 gives a brief description of the condition of each section in 1998. The table follows the position of the test sections from the south to the north.
Figure 23. Typical longitudinal cracking (Newark, DE).
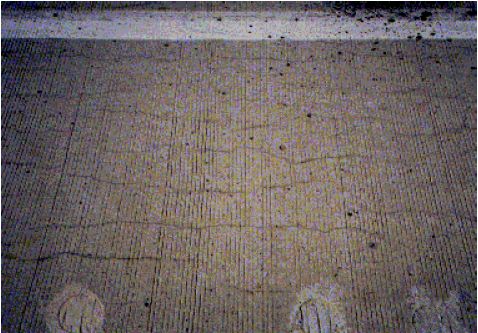
Figure 24. Typical longitudinal cracking and example of asphalt patching along joint between shoulder and travel lane (Newark, DE).
| Section | Description |
|---|---|
| Control 1 | Longitudinal cracking (map cracking) covers the area from 1.22 to 3.36 m from the edge of pavement (EP). Cracks are typically spaced 10.2 cm apart. Cracking extends full width at ends of section. Most of cracks are stained. One full width transverse crack and one spall were observed on the south end of the section. This section has almost as severe cracking as TS2. |
| Test section 1 | Longitudinal cracking (map cracking) covers the area from 1.07 to 3.36 m from EP, with a typical 10.2-cm spacing. Cracking extends the full width of the slabs at the ends of section. More severe map cracking exists at the south end of the section. Cracking is obvious (medium) due to the staining. One 1.22-m-long transverse crack exists at the 3.97-m mark of section. Slightly less severe cracking than TS2. |
| Test section 2 | Longitudinal cracking (map cracking) covers area from 1.22 to 3.36 m from the EP, with 10.2- to 12.7-cm spacing in center area of section and 7.6- to 10.2-cm spacing at the south end. Cracking extends full width at ends of section especially at south end. All cracking is medium with heavy stains. This section has the most severe cracking and staining. |
| Control 2 | Longitudinal cracking (map cracking) covers the area from 1.22 to 3.36 m from the EP, with 10.2-cm spacing at the south end and 15.2- to 25.4-cm spacing in the center area of slab. Staining of cracks is noticeable, especially near the joints. Fine cracking exists over the area 0.92 to 1.83 m from the EP. Cracking and staining are not as severe as TS2, TS1, or C1. |
| Control 3 | Fine longitudinal cracking (map cracking) covers the area from 1.22 to 3.36 m from the EP, with staining along lane edge and ends of the section. Some larger longitudinal cracks are present in center area of the section. One transverse crack is present from the corner of drain to the edge of the lane. Cracking is less frequent than on C4. |
| Control 4 | Short fine cracks are present from 0.61 to 3.36 m from EP, spaced about 8 to 11 inches apart. No cracks were noted within 0.61 m of the curb. Some larger longitudinal cracks (medium) are present. Cracking is slightly less severe than first three control sections. |
| Test section 3 | Fine short cracks are present over the entire area 0.61 to 3.36 m from EP. No cracks are present within 0.61 m of the curb. Cracks extend farther into the section near the south end. This section has the least severe cracking of the test sections. |
| Test section 4 | Very fine cracks (2-inch spacing) cover an area from 0.61 to 3.36 m from the EP. From 2.75 to 3.36 m, cracks are more obvious and have staining but are spaced farther apart. Several larger new cracks are present at approximately 0.92 m from the EP. This section has somewhat more severe cracking than section TS3. |
| Control 5 | Very fine cracks (finer than TS4) extend from 0.61 to 3.36 m from EP, and are typically spaced 7.6 cm apart. Cracks from 0.61 to 0.92 m have staining. Cracking is slightly more severe than section TS4. |
It appears the nine sections can be divided into two groups of almost equal severity of cracking. The group with the most severe cracking and staining include control sections 1, 2, and 3 and test sections 1 and 2. These are also the first five sections of the site and carry the most runoff water. The other group includes control section 4 and 5, and test sections 3 and 4.
The area of each slab affected by map cracking has increased over the 4 years of the study. Figure 25 shows a graph of the area affected in each section over the 4 years of the study. Two levels of distress are apparent. One group, which consists of control 1, test section 1, test section 2, and control 3, has approximately the same area affected by map cracking. The area has gradually been increasing over the 5 years. The other group consists of control 2, test section 3, test section 4, control 4, and control 5. The area of these sections affected increased gradually over the first 4 years but at a lower level than the other group. However, the area affected increased sharply in the last year of the study and was at the same level as the other group. This can also be seen in figure 26, which shows the area affected by map cracking as a percentage of the total section area. All sections had more than 60 percent of their area affected by map cracking in 1998. There is no value for control 4 in 1998. Test section 3, test section 4, and control 5 have the most area affected, at over 80 percent, but these areas had the smallest affected areas the year before. All the map cracking was of low severity.
Figure 25. Area of each slab affected by map cracking over the 5 years of the study (Newark, DE).
Figure 26. Area of each slab affected by map cracking expressed as a percentage of the total section area (Newark, DE).
Spalling of transverse joints has increased over the 4 years of the study. A description of the joint observations in the shoulder lane and the travel lane from 1998 is given in appendix B (table B-1). The joints were rated both by SHRP guidelines and by noting how many longitudinal cracks intersected the joint. The travel lane was observed from the shoulder lane because of the difficulty in setting up a lane closure. A marked increase in damage in the travel lane was noted.
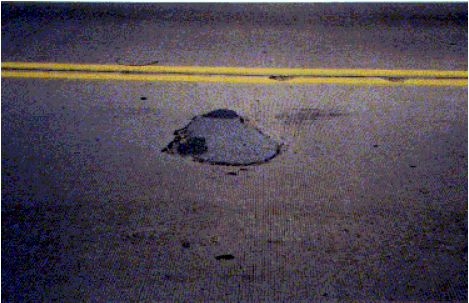
Many of the joints had been patched in the wheelpath areas with large asphaltic concrete patches. Figure 27 shows a typical asphalt concrete patch along a transverse joint in the travel lane. Also, extensive patching was noted on the traffic side of the longitudinal joint along test section 2. Figure 28 shows a patch in the center of the travel lane. Visual observations of the joints along the pavement were made of both the travel and passing lanes.
Figure 27. Asphalt concrete patching along transverse joint in travel lane (Newark, DE).
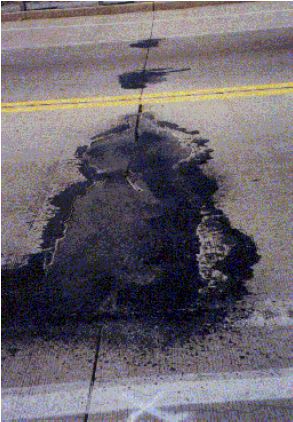
Figure 28. Asphalt patch in center of section in travel lane (Newark, DE).
Figures 29 through 33 show the amount and severity of joint spalling over the 5 years of the study. In 1994, the control 3, control 4, control 5, and test section 2 had joint spalling. At this time the spalling was all low severity. In 1998, all sections except test section 4 have transverse joint spalling. All sections have low-severity spalling except control 4 and control 5, which have spalling of medium severity. Test sections 3 and 4 are performing much better than test sections 1 and 2 with respect to transverse joint spalling. This likely is due to the different exposure conditions previously discussed.
Figure 29. Length and severity of joint distress for all test sections (Newark, DE, 1994).
Figure 30. Length and severity of joint distress for all test sections (Newark, DE, 1995).
Figure 31. Length and severity of joint distress for all test sections (Newark, DE, 1996).
Figure 32. Length and severity of joint distress for all test sections (Newark, DE, 1997).
Figure 33. Length and severity of joint distress for all test sections (Newark, DE, 1998).
A summary of the transverse cracking in each section over the 5 years is shown in figure 34. The only sections with transverse cracking are control 1, control 3, control 4, and test section 3. The cracking in the three control sections had occurred before the first year of the study and did not increase in length or severity during the next 4 years of the study. The cracking in test section 3 had also occurred before the first year of the study but increased in length over the 4 years. There was no increase in severity, and all severity ratings are low. Generally, the transverse cracking of the Delaware test sections were there before the study began and do not appear to be getting more severe.
Figure 34. Summary of transverse cracking in each section for the five inspections (Newark, DE).
(Note: Length of Transverse Cracking (y-axis) is in meters.)
Each year cores were taken for modulus and strength testing. Subsequent cores were taken 0.61 m and 0.92 m from the previous year’s cores along the same travel line on the downstream or "leave" side of the panel. The cores were labeled with the test panel designation and the letters "A" and "B," with A being the upstream (approach) core. The state crew removed the cores using a trailer-mounted coring machine. Selected cores were tested to determine the compressive strength and elastic modulus of the concrete in both wet and dry conditions.
A single core from each section was tested for wet and dry modulus and compressive strength testing. The cores were tested in a dry as-received condition, then soaked in lime saturated water for 2 weeks and retested. After the wet modulus tests were performed, the cores were allowed to dry for approximately 1 week, then tested to determine their compressive strength. The results of the dry modulus testing are shown in table 16, and results of the wet modulus testing are shown in table 17. In 1994 the cores were only tested for modulus in the dry condition. Wet modulus testing and compressive strength testing was not performed. In 1995, wet and dry modulus testing was performed but compressive strength testing was not since strength testing was not part of the original work plan.
| Section | Year | ||||
|---|---|---|---|---|---|
| 1994 | 1995 | 1996 | 1997 | 1998 | |
| Control 1 | 2.05 | 2.04 | 1.62 | 2.12 | 1.50 |
| Test 1 | 1.77 | 1.76 | 0.96 | 2.34 | Failed |
| Test 2 | 1.50 | 1.71 | 1.00 | 1.36 | 1.20 |
| Test 3 | 1.87 | 2.08 | 1.79 | 2.33 | 1.66 |
| Test 4 | 1.95 | 2.46 | 2.17 | 2.43 | 1.98 |
| Control 5 | 2.04 | 2.09 | 1.87 | 2.19 | 1.71 |
1 psi = 6.89 kPa
| Section | 1994 | 1995 | 1996 | 1997 | 1998 |
|---|---|---|---|---|---|
| Control 1 | – | 1.80 | 1.69 | 1.70 | 1.40 |
| Test 1 | – | 1.77 | 1.31 | 1.88 | – |
| Test 2 | – | 1.67 | 1.00 | 1.19 | 1.38 |
| Test 3 | – | 2.01 | 1.68 | 1.97 | 1.86 |
| Test 4 | – | 2.27 | 1.96 | 2.17 | 2.20 |
| Control 5 | – | 1.81 | 1.76 | 1.77 | 2.10 |
1 kPa = 6.89 psi
The measured modulus values for the cores were generally lower for 1998 than those in previous years, especially for the dry-tested moduli. The core from test section 1 failed during the preload, so there is no value for 1998. The results from 1997 show an increase in modulus over the previous years. The results from 1998 decreased, with a few exceptions, to less than the 1996 values. This follows the increase in distress noted in the sections.
The compressive strength results shown in table 18 do not indicate any trend except that test section 4 and control 5 have considerably higher compressive strengths than the other sections. These sections are at the far north end of the test area. The strength results are generally lower in 1998 than in 1996 but the concrete still has considerable compressive strength.
| Section | 1994 | 1995 | 1996 | 1997 | 1998 |
|---|---|---|---|---|---|
| Control 1 | – | – | 5320 | 5171 | 4325 |
| Test 1 | – | – | 5837 | 4947 | – |
| Test 2 | – | – | 4799 | 4014 | 4520 |
| Test 3 | – | – | 4947 | 3989 | 4107 |
| Test 4 | – | – | 6058 | 5849 | 5720 |
| Control 5 | – | – | 5891 | 5565 | 5533 |
1 psi = 6.89 kPa
After the visual surveys were completed and as the cores were being taken, six relative humidity locations were sampled, one each in sections control 1, test 1, test 2, test 3, test 4, and control 5. Section control 2, control 3, and control 4 were not sampled. The relative humidity samples were taken at various depths. The sample depths and results of the relative humidity testing are shown in tables 19 through 22. The relative humidity measurements were not made in 1998 due to very wet pavement conditions.
| Section | Relative Humidity, Percent (at given depth interval) (inches) | |||
|---|---|---|---|---|
| 0.5–1 | 2–2.5 | 4–4.5 | 5.5–6 | |
| Control 1 | 70 | 81 | 90 | 95 |
| Test section 1 | 72 | 95 | 97 | 98 |
| Test section 2 | 85 | 93 | 97 | 101 |
| Test section 3 | 84 | 97 | 100 | 100 |
| Test section 4 | – | – | – | – |
| Control 5 | 71 | 93 | 92 | 94 |
1 inch = 2.54 cm
| Section | Relative Humidity, Percent (at given depth interval) (inches) | |||
|---|---|---|---|---|
| 0.5–1 | 2–2.5 | 4–4.5 | 5.5–6 | |
| Control 1 | 67 | 84 | 93 | 95 |
| Test section 1 | 75 | 87 | 96 | 99 |
| Test section 2 | 87 | 92 | 97 | 100 |
| Test section 3 | 83 | 92 | 96 | 94 |
| Test section 4 | 77 | 90 | 92 | 98 |
| Control 5 | 69 | 85 | 94 | 96 |
1 inch = 2.54 cm
| Section | Relative Humidity, Percent (at given depth interval) (inches) | |||
|---|---|---|---|---|
| 0.5–1 | 2–2.5 | 4–4.5 | 5.5–6 | |
| Control 1 | 69 | 95 | 96 | 87 |
| Test section 1 | 71 | 82 | 94 | 93 |
| Test section 2 | 52 | 84 | 48 | 83 |
| Test section 3 | 54 | 83 | 91 | 80 |
| Test section 4 | 57 | 85 | 94 | 83 |
| Control 5 | 80 | 87 | 74 | 83 |
1 inch = 2.54 cm
| Section | Relative Humidity, Percent (at given depth interval) (inches) | |||
|---|---|---|---|---|
| 0.5–1 | 2–2.5 | 4–4.5 | 5.5–6 | |
| Control 1 | 45 | 54 | 61 | 54 |
| Test section 1 | 36 | 46 | 51 | 54 |
| Test section 2 | 58 | 53 | 38 | – |
| Test section 3 | – | – | – | – |
| Test section 4 | 43 | – | – | – |
| Control 5 | 42 | 50 | 53 | 70 |
1 inch = 2.54 cm
Generally, below 5.1 cm in depth, the relative humidity of samples is more than 80 percent. This is enough moisture for ASR to proceed.
Each year, one core from each test section was examined using methods of ASTM C 856, Petrographic Examination of Hardened Concrete. Sections from each of the cores were cut and lapped. These sections were then soaked overnight and dried, and the entire lapped surface was traversed under a stereo microscope. Each lapped surface was divided into five or more traverse areas and examined at magnifications of 10 to 30 times. All instances of cracks, alkalisilica gel, and deteriorated or reacted aggregate particles were counted. The petrographic observations are presented in appendix B. Table 23 gives a summary of the petrographic findings for the years 1997 and 1998. In the previous year’s petrographic studies, the reactive particles and gel locations were not counted. From the petrographer’s notes in appendix B, signs of ASR became widespread in the 1996 cores and continued to spread in the cores from 1997 and 1998. Notes from the 1996 core study indicate there was no significant difference between the cores from the control sections and those from the treated sections. All examined surfaces had abundant distressed fine aggregate and most potentially reactive particles had reacted to some extent. Microcracks and incipient microcracks were widespread. Gel was widely distributed throughout the cores. There also appeared to be a tendency for the cores to fracture parallel to the wearing surface.
Table 23 indicates there is little difference in the amount of reacting particles and gel locations in cores from all the sections for 1997 and 1998. The test areas had, on average, slightly less cracking, reacted particles, and visible gel locations than the control areas. Generally in these 2 years, all cores were moderately to severely distressed from the effects of ASR. Reactive particles and gel locations were widespread.
| Core ID | Year | Cracks | Reactive Particles | Gel Locations | ||
|---|---|---|---|---|---|---|
| Micro | Large | Fine | Coarse | |||
| C1 | 1997 1998 | 40 77 | 1 1 | 24 39 | 3 0 | 27 49 |
| C5 | 1997 1998 | 34 57 | 1 0 | 27 42 | 3 0 | 31 79 |
| TS1 | 1997 1998 | 87 50 | 0 2 | 31 38 | 0 0 | 42 61 |
| TS2 | 1997 1998 | 43 64 | 0 1 | 29 23 | 0 0 | 33 58 |
| TS3 | 1997 1998 | 17 25 | 0 0 | 23 15 | 0 0 | 25 43 |
| TS4 | 1997 1998 | 8 14 | 0 0 | 31 15 | 0 0 | 13 44 |
| Average for control sections (97 and 98) | 52.0 | 0.8 | 33.0 | 1.5 | 46.5 | |
| Average for treated sections (97 and 98) | 38.5 | 0.4 | 25.6 | 0.0 | 39.9 | |
Five control sections and four test sections treated with lithium hydroxide were evaluated. All sections increased in distress over the 4-year evaluation. Significant differences between all sections were seen between the north and south ends of the test area due to differences in exposure to moisture. The lithium hydroxide did not appear to be effective in stopping or significantly slowing the ASR deterioration at this test site.

