U.S. Department of Transportation
Federal Highway Administration
1200 New Jersey Avenue, SE
Washington, DC 20590
202-366-4000
Federal Highway Administration Research and Technology
Coordinating, Developing, and Delivering Highway Transportation Innovations
 |
| This report is an archived publication and may contain dated technical, contact, and link information |
|
Publication Number: FHWA-RD-02-082 Date: August 2006 |
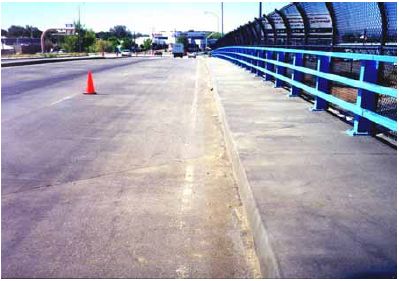
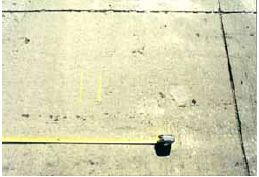
The New Mexico State Highway and Transportation Department constructed test sections in June 1992 of a new highway to evaluate the capability of concrete admixtures to prevent expansion due to ASR. The pavement is a three-lane, uphill, left-turning approach to a bridge carrying Lomas Boulevard westbound over Interstate 40 (I-40) in eastern Albuquerque. The surface was smooth-finished, with no tining or grooving. An overall view of the test site and variables are shown in figures 55 and 56. Eleven test sections described in tables 35, each 12.2 to 18.3 m in length, were constructed.
| Test Section | Aggregate Source | Treatment |
|---|---|---|
| 1 | Shakespeare | 1 percent LiOH |
| 2 | Shakespeare | 0.5 percent LiOH |
| 3 | Shakespeare | Lomar—HRWR at 0.59 L/45.6 kg (20 oz/hundredweight (cwt)) |
| 4 | Shakespeare | Class F fly ash, 25 percent replacement of cement |
| 5 | Shakespeare | Class C fly ash, 25 percent replacement of cement |
| 6 | Shakespeare | Control |
| 7 | Shakespeare | Blend of Class C and F fly ash (1:1), 25 percent replacement of cement |
| 8 | Grevey | Class F fly ash, 25 percent replacement of cement |
| 9 | Grevey | Control |
| 10 | Grevey | 1 percent LiOH |
| 11 | Grevey | Class C fly ash, 25 percent replacement of cement |
A single source of portland cement with 0.55 percent total alkalies [as Na2O] was used throughout the project. The complete concrete mix characteristics are given in appendix D.
Figure 55. New Mexico ASR test section layout—westbound approach slabs to Lomas Boulevard (State Route 352) bridge over I-25.
Figure 56. Lomas Boulevard westbound structure over I-40 (Albuquerque, NM).
The following information was reported:
The Albuquerque pavement test section was inspected in the fall in each of the 5 years following construction. The most recent inspection was performed on October 1, 1998. Annual tests performed included visual inspection and crack mapping, faulting measurements, relative humidity measurements, FWD readings, and core removal for wet and dry modulus testing and petrographic studies. The cores were taken by New Mexico DOT personnel.
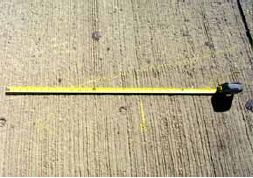
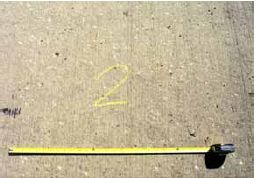
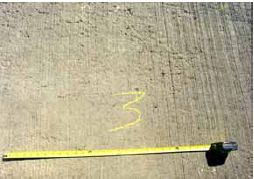
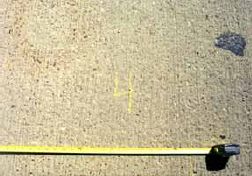
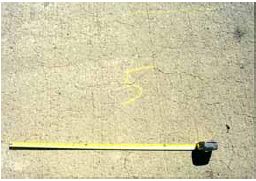
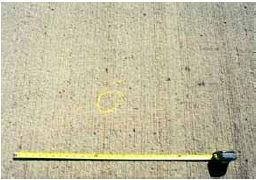
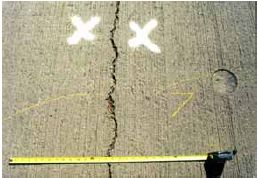
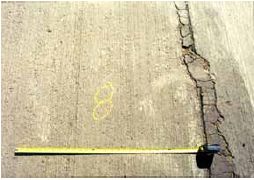
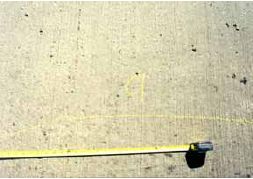
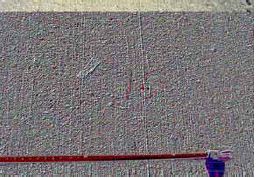
The condition of the pavement test section was determined by visual inspection. Notes were made as to extent of map cracking, transverse cracking, joint spalling, joint seal condition, patching, popouts, and other LTPP criteria. The condition of each section relative to the others in the test area was also noted. The results of the 1998 visual inspection are given in table 36. Photographs of the various test sections are shown in figure 57.
| Test Section | Treatment—Aggregate Source | Observations |
|---|---|---|
| 1 | 1 percent LiOH—Shakespeare | Fine map cracking developing in areas of the right wheelpath. In the left wheelpath, there is slightly visible map cracking. The centerline has light, barely visible map cracking. In general, the entire section except along the curb has faint to light map cracking. |
| 2 | 0.5 percent LiOH— Shakespeare | The entire section has light map cracking that is slightly more visible than in section 1. The left wheelpath has slightly more visible cracking than the right wheelpath. |
| 3 | Lomar—Shakespeare | Occasional cracking was noted but no map cracking except for one faint area in the right wheelpath. Very rough original surface texture in approximately 80 percent of the test area due to rain damage while plastic. |
| 4 | Class F Fly Ash— Shakespeare | Areas of occasional very light surface cracking exist in first slab in left wheelpath. A few cracks exist near the lane centerline. |
| 5 | Class C Fly Ash— Shakespeare | Two full-width transverse cracks, well-defined transverse and longitudinal cracks, well-defined map cracking over entire surface with some raveling of the cracks were observed. Cracking is worse in wheelpaths. The average size of the pieces between cracks is 7.6 cm (3 inches). |
| 6 | Control—Shakespeare | Entire section, except along curb, has faint map cracking. Fine cracks have developed at a transverse joint. |
| 7 | Blended C & F Fly Ash—Shakespeare | Some areas of faint map cracking were found. |
| 8 | Class F Fly Ash—Grevey | The entire area has faint to light map cracking. Concentrated in the left wheelpath. Some joint spalling is present. |
| 9 | Control—Grevey | Very faint map cracking was observed over the entire section. |
| 10 | 1 percent LiOH—Grevey | Very faint map cracking was found but less visible than in section 9. Areas of rough and irregular finish exist. |
| 11 | Class C Fly Ash— Grevey | Longitudinal cracks were found in left wheelpath and along centerline, fine wheelpath map cracking and transverse cracks were also developing, and areas of rough and irregular finish exist. Severity of map cracking is between that of sections 9 and 10. |
Figure 57. Photographs of all sections in Albuquerque, NM.
The amount and severity of transverse joint spalling was used as an indicator of the section condition. The amount of transverse joint spalling in the years 1994 to 1998 is shown in the series of figures in appendix D. The amount of joint spalling for all sections increased over the 4 years of the study. The largest increase in this deterioration occurred between 1997 and 1998. The severity of the joint spalling was rated high, medium, or low. LTPP criteria define spalling of transverse joints as follows:
The highest level of severity that occurred along the joint was then used to designate the entire length of the joint. There are significant differences between the performances of the sections. However, joint distress is not as good an indicator of ASR damage as map cracking. Each section has only 2 or 3 interior joints, while the remaining joints are at transition areas between test sections. Table 37 summarizes the percent transverse joint spalling and notes the highest level of severity.
| Test Section | Treatment | Length of Transverse Spalling (meters) | Total Length (meters) | Percent of Total | Highest Severity |
|---|---|---|---|---|---|
| 1 | 1 percent LiOH (S) | 5.8 | 10.6 | 55 | H |
| 2 | 0.5 percent LiOH (S) | 5.5 | 7.1 | 77 | M |
| 3 | Lomar (S) | 4.3 | 7.1 | 60 | H |
| 4 | Class F Ash (S) | 5.2 | 10.6 | 49 | L |
| 5 | Class C Ash (S) | 7.1 | 7.1 | 100 | M |
| 6 | Control (S) | 7.0 | 10.6 | 66 | L |
| 7 | Blended C & F (S) | 7.0 | 10.6 | 66 | L |
| 8 | Class F Ash (G) | 5.5 | 7.1 | 77 | H |
| 9 | Control (G) | 8.1 | 10.6 | 76 | L |
| 10 | 1 percent LiOH (G) | 5.5 | 7.1 | 77 | L |
| 11 | Class C Ash (G) | 11.0 | 10.6 | 100 | L |
For the sections made with Shakespeare aggregate, the section with the best performance was the section that contains Class F fly ash, with just over 49 percent of the joint affected with lowseverity joint spalling (cracking). The next best sections were the control section and the section containing blended Class F and Class C fly ashes. Both had about 66 percent of low-severity joint spalling. The worst performances were in the sections that contain Lomar, which had approximately 60 percent of high-severity spalling, and the 1 percent LiOH section, which had 55 percent of low- and high-severity spalling. The sections with 0.5 percent LiOH or Class C fly ash were between the others with about 77 percent and 100 percent of moderate-severity joint spalling, respectively.
For the sections made with the Grevey aggregate, the best performing sections were the control and the 1 percent LiOH. Each had about 76 percent of low severity spalling. The Class C fly ash section was performing better than the Class F fly ash section. The Class C had only low severity spalling over 100 percent of the joints while the Class F section had high severity spalling over 77 percent of the entire joint length.
There are some contradictory results when comparing the sections with the two aggregates. With the Shakespeare aggregate, the Class F fly ash outperformed the Class C fly ash, while with the Grevey aggregate, the Class C fly ash performed better than the Class F fly ash. With the Shakespeare aggregate, the section with the 1 percent LiOH had higher severity spalling than the 0.5 percent LiOH section. The section with Grevey aggregate and 1 percent LiOH performed better than either LiOH test section made with Shakespeare aggregate. The control sections with both aggregates had the same, low amount and severity of joint spalling.
The amount and severity of map cracking is a good early indicator of the extent of ASR occurring in each section. The area of map cracking as a percent of the total area is shown in figure 58. This figure shows that, for most sections, the area of map cracking had increased substantially between 1996 and 1998. The section with Class C fly ash and Shakespeare aggregate had extensive map cracking over the entire test area in 1995, except for a small area along the curb. The section with Class F fly ash and Shakespeare aggregate was performing the best of all the sections, with less than 10 percent of its area covered by map cracking. The Lomar section was the next best with about 15 percent map cracking. Several sections, especially those with Grevey aggregate, had extensive map cracking appear only within the last 2 years of the study.
Figure 58. Area of map cracking as a percentage of the total area (all sections, Albuquerque, NM).
Cores taken by New Mexico DOT personnel were shipped to laboratories for testing. Some of the cores were prepared by cutting them to length and squaring the ends. These cores were first tested for elastic modulus in the as-received, dry condition, then soaked for 2 weeks in lime-saturated water and retested. The elastic modulus tests were performed using an external compressometer.
The results of the modulus of elasticity tests cores in the dry condition for all 5 years are given in table 38. The test results for the cores in the wet or saturated condition are shown in table 39. The cores were not tested in the wet condition in 1994. Except from 1994 to 1995, the overall annual average moduli, both wet and dry, declined. The overall standard deviation generally increased over this same time. The moduli of all the sections did not decrease the same amount. Figure 59 shows the modulus of elasticity tested in the as-received state for all the sections over the four years. There are no obvious trends in most sections. The Class C fly ash section with the Shakespeare aggregate (S) is the only section that showed a uniform decrease in the modulus over the past four years. The modulus results from testing in the wet state are shown in figure 60. Here, the trend of decreasing modulus over the four years is more distinct. Most sections show a decrease in elastic modulus from 1995 to 1998. gain the Class C fly ash with Shakespeare aggregate section has the largest and most consistent decrease in modulus. The other sections maintained moderately high modulus properties.
| Section No. | Description* | Dry | |||||
|---|---|---|---|---|---|---|---|
| 1994 | 1995 | 1996 | 1997 | 1998 | Percent Loss From 1994—1998 | ||
| 1 | 1 percent LiOH (S) | 4.10 | 4.68 | 5.11 | 4.09 | 3.89 | 4 |
| 2 | 0.5 percent LiOH (S) | 4.06 | 4.43 | 4.71 | 3.61 | 3.69 | 8 |
| 3 | Lomar (S) | 4.15 | 4.91 | 4.75 | 3.83 | 4.18 | -1 |
| 4 | Class F Ash (S) | 3.80 | 3.95 | 3.89 | 4.14 | 4.02 | -6 |
| 5 | Class C Ash (S) | 2.16 | 2.90 | 2.39 | 1.72 | 1.24 | 32 |
| 6 | Control (S) | 3.52 | 4.08 | 3.29 | 3.59 | 3.47 | 1 |
| 7 | Class C & F Ash (S) | 3.30 | 3.67 | 3.66 | 3.60 | 3.28 | 1 |
| 8 | Class F Ash (G) | 3.53 | 4.24 | 3.77 | 4.04 | 3.31 | 5 |
| 9 | Control (G) | 3.33 | 4.02 | 3.50 | 3.31 | 3.57 | -6 |
| 10 | 1 percent LiOH (G) | 3.20 | 3.28 | 3.15 | 3.74 | 3.70 | -1 |
| 11 | Class C Ash (G) | 3.71 | 4.34 | 3.85 | 4.26 | 3.62 | 2 |
| Average | 3.53 | 4.05 | 3.82 | 3.63 | 3.45 | 2 | |
| Standard Deviation | 0.56 | 0.59 | 0.79 | 0.70 | 0.78 | ||
*(S) = Shakespeare aggregate; (G) = Grevey aggregate
1 psi = 6.89 kPa
| Section No. | Description* | Dry | |||||
|---|---|---|---|---|---|---|---|
| 1994 | 1995 | 1996 | 1997 | 1998 | Percent Loss From 1995—1998 | ||
| 1 | 1 percent LiOH (S) | – | 5.06 | 4.47 | 4.08 | 4.02 | 21 |
| 2 | 0.5 percent LiOH (S) | – | 4.05 | 4.09 | 3.46 | 3.46 | 15 |
| 3 | Lomar (S) | – | 5.07 | 4.54 | 3.96 | 3.87 | 24 |
| 4 | Class F Ash (S) | – | 4.08 | 4.03 | 4.05 | 3.43 | 16 |
| 5 | Class C Ash (S) | – | 3.22 | 2.57 | 1.79 | 1.39 | 57 |
| 6 | Control (S) | – | 3.89 | 3.20 | 3.40 | 3.30 | 15 |
| 7 | Class C & F Ash (S) | – | 3.82 | 3.66 | 3.69 | 3.36 | 12 |
| 8 | Class F Ash (G) | – | 4.57 | 3.54 | 3.82 | 3.54 | 23 |
| 9 | Control (G) | – | 4.02 | 3.82 | 3.56 | 3.50 | 13 |
| 10 | 1 percent LiOH (G) | – | 3.29 | 3.09 | 3.58 | 3.65 | -11 |
| 11 | Class C Ash (G) | – | 4.44 | 3.96 | 3.46 | 3.58 | 19 |
| Average | – | 4.14 | 3.72 | 3.53 | 3.37 | 18 | |
| Standard Deviation | – | 0.61 | 0.60 | 0.63 | 0.69 | – | |
*(S) = Shakespeare aggregate; (G) = Grevey aggregate
1 psi = 6.89 kPa
Figure 59. Modulus of elasticity test results for cores in the dry condition (all sections, Albuquerque, NM).
Figure 60. Modulus of elasticity test results for cores in the saturated condition (all sections, Albuquerque, NM).
The increased scatter in the dry-tested results may be due to the cores being tested in the asshipped condition. Depending on the storage conditions and time elapsed from coring to testing, the moisture content of the cores from one year’s testing to another could change considerably. When tested in the saturated state, the condition of the cores from one year to the next are similar. This results in more consistent results and less scatter. If the concrete has internal cracking and gel due to ASR, the concrete modulus is expected to decrease. Wetting causes the gel to imbibe water and swell. This swelling should reduce the modulus further than if the concrete is tested dry.
The relative humidity values of the concrete pavement sections as they vary with depth are given in tables 40 through 44. The relative humidity values are similar from year to year, with levels increasing with depth. Generally, all of the samples had relative humidities of approximately 70 percent or higher at the deepest level measured, from 15.2- to 16.5-cm (6- to 6.5-inch) depths. The 100 percent humidity values for the top portions in 1998 were caused by rain showers that occurred during the site inspection. None of the test variables are expected to alter the humidity within the concrete. The data shows the wide variability of concrete humidity in pavements and confirms that sufficient moisture is normally available to promote ASR within the concrete.
| Section No. | Description* | Relative Humidity, Percent (at given depth interval) (inches) | |||
|---|---|---|---|---|---|
| 0.5–1 | 2–2.5 | 4–4.5 | 6–6.5 | ||
| 1 | 1 percent LiOH (S) | 76 | 78 | 95 | 95 |
| 2 | 0.5 percent LiOH (S) | 56 | 64 | 75 | 82 |
| 3 | Lomar (S) | 42 | 68 | 78 | 80 |
| 4 | Class F Ash (S) | 63 | 74 | 85 | 90 |
| 5 | Class C Ash (S) | 90 | 87 | 86 | 87 |
| 6 | Control (S) | 44 | 78 | 82 | 85 |
| 7 | Class C & F Blend (S) | 58 | 60 | 80 | 83 |
| 8 | Class F (G) | 59 | 82 | 87 | 91 |
| 9 | Control (G) | 54 | 73 | 84 | 88 |
| 10 | 1 percent LiOH (G) | 62 | 77 | 87 | 88 |
| 11 | Class C (G) | 65 | 70 | 80 | 84 |
*(S) = Shakespeare aggregate; (G) = Grevey aggregate
1 inch = 2.54 cm
| Section No. | Description* | Relative Humidity, Percent (at given depth interval) (inches) | |||
|---|---|---|---|---|---|
| 0.5–1 | 2–2.5 | 4–4.5 | 6–6.5 | ||
| 1 | 1 percent LiOH (S) | – | 59 | – | 90 |
| 2 | 0.5 percent LiOH (S) | 38 | – | – | 76 |
| 3 | Lomar (S) | 41 | 53 | – | 63 |
| 4 | Class F Ash (S) | 51 | 50 | 80 | 81 |
| 5 | Class C Ash (S) | 60 | 73 | 74 | 80 |
| 6 | Control (S) | 42 | 56 | 73 | 70 |
| 7 | Class C & F Blend (S) | 39 | 59 | 73 | 74 |
| 8 | Class F (G) | 41 | 61 | 77 | 72 |
| 9 | Control (G) | 43 | 60 | 76 | 71 |
| 10 | 1 percent LiOH (G) | 44 | 55 | 74 | 76 |
| 11 | Class C (G) | 41 | 61 | 72 | 70 |
*(S) = Shakespeare aggregate; (G) = Grevey aggregate
1 inch = 2.54 cm
| Section No. | Description* | Relative Humidity, Percent (at given depth interval) (inches) | |||
|---|---|---|---|---|---|
| 0.5–1 | 2–2.5 | 4–4.5 | 6–6.5 | ||
| 1 | 1 percent LiOH (S) | 63 | 79 | 78 | 87 |
| 2 | 0.5 percent LiOH (S) | 42 | 68 | 81 | 90 |
| 4 | Class F Ash (S) | 82 | 68 | 62 | 81 |
| 5 | Class C Ash (S) | 82 | 67 | 60 | 69 |
| 6 | Control (S) | 58 | 66 | 59 | 75 |
| 7 | Class C& F Blend (S) | 59 | 61 | 66 | 82 |
| 8 | Class F (G) | 31 | 72 | 79 | 82 |
| 9 | Control (G) | 64 | 62 | 74 | 81 |
| 10 | 1 percent LiOH (G) | 55 | 63 | 75 | 82 |
| 11 | Class C (G) | 47 | 59 | 73 | 79 |
*(S) = Shakespeare aggregate; (G) = Grevey aggregate
1 inch = 2.54 cm
| Section No. | Description* | Relative Humidity, Percent (at given depth interval) (inches) | |||
|---|---|---|---|---|---|
| 0.5–1 | 2–2.5 | 4–4.5 | 6–6.5 | ||
| 1 | 1 percent LiOH (S) | 63 | 67 | 72 | 81 |
| 2 | 0.5 percent LiOH (S) | 93 | 66 | 74 | 83 |
| 3 | Lomar (S) | 35 | 47 | 58 | 80 |
| 4 | Class F Ash (S) | 65 | 73 | 83 | 88 |
| 5 | Class C Ash (S) | 52 | 93 | 96 | 90 |
| 6 | Control (S) | 38 | 55 | 77 | 73 |
| 7 | Class C & F Blend (S) | 41 | 65 | 80 | 77 |
| 8 | Class F (G) | 83 | 63 | 100 | 88 |
| 9 | Control (G) | 37 | 55 | 90 | 99 |
| 10 | 1 percent LiOH (G) | 38 | 63 | 92 | 100 |
| 11 | Class C (G) | 36 | 37 | 95 | 100 |
*(S) = Shakespeare aggregate; (G) = Grevey aggregate
1 inch = 2.54 cm
| Section No. | Description* | Relative Humidity, Percent (at given depth interval) (inches) | |||
|---|---|---|---|---|---|
| 0.5–1 | 2–2.5 | 4–4.5 | 6–6.5 | ||
| 1 | 1 percent LiOH (S) | 33 | 42 | 88 | 69 |
| 2 | 0.5 percent LiOH (S) | 100 | 100 | 71 | 89 |
| 3 | Lomar (S) | 100 | 100 | 49 | 51 |
| 4 | Class F Ash (S) | 100 | 100 | 53 | 79 |
| 5 | Class C Ash (S) | 100 | 100 | 100 | 100 |
| 6 | Control (S) | 100 | 100 | 100 | 100 |
| 7 | Class C & F Blend (S) | 100 | 100 | 100 | 100 |
| 8 | Class F (G) | 100 | 100 | 100 | 100 |
| 9 | Control (G) | 100 | 100 | 100 | 100 |
| 10 | 1 percent LiOH (G) | 100 | 100 | 100 | 100 |
| 11 | Class C (G) | 100 | 100 | 100 | 100 |
*(S) = Shakespeare aggregate; (G) = Grevey aggregate
1 inch = 2.54 cm
A petrographic examination was done on one core from each test section each year. The core was cut into the largest possible square prism, and two faces of the prism were lapped. Parallel sections were marked on each lapped face to delineate each traverse and ensure that the entire lapped surface was examined. Evidence of reaction, in the form of gel and cracks characteristic of ASR and associated with aggregate particles and reactive particles, were then counted on both lapped faces.
As discussed previously, the relative numbers of reactive coarse and fine aggregate particles should be regarded as approximate, since alkali-silica gel is highly mobile and may have migrated away from the originating particle. The petrographer’s observations are in appendix D. A summary of the observations from the cores for 1998 is given in tables 45 and 46.
Some test sections show visual indications of distress after 6 years of service. Based on the visual inspection, area of map cracking, and transverse joint spalling, only three sections appear to be performing better than the controls:
| Section | |
| 4 | Class F Fly Ash—Shakespeare |
| 3 | Lomar (HRWA)—Shakespeare |
| 7 | Blend Class C and F Ash—Shakespeare |
Section 5 (Class C fly ash—Shakespeare) and section 11 (Class C fly ash—Grevey) are clearly performing the worst and considerable worse than the control concretes. Sections 2 (0.5 percent LiOH) and section 8 (Class F fly ash—Grevey) may be slightly worse than the controls. Section 10 (1 percent LiOH—Grevey) and section 1 (1 percent LiOH—Shakespeare) appear similar to the controls.
Section 5 (Class C fly ash—Shakespeare) was the only section to exhibit a large decrease in the wet concrete modulus of elasticity. 1998 modulus values for section 5 were half the value of the other test sections. Section 5 cores also had the most microcracking, gel, and reacted aggregate particles, identified by petrographic examination.
From petrographic studies of one core in 1998, sections 1 (1 percent LiOH (S)) and 2 (0.5 percent LiOH (S)) had fewer microcracks, gel, and reacted particles than the control. However, section 10 (1 percent LiOH (G)) with Grevey aggregate had similar distress as the control.
Sections 3 (Lomar (S)) and 4 (Class F (S)) had less microcracking than the control but similar numbers of reacted particles. All cores exhibit some internal microcracking, gel, and reacted particles.
ASR has not reduced serviceability of any of the test sections after 6 years. However, Class C fly ash addition with Shakespeare aggregate has accelerated deterioration. The addition of Class F fly ash, combined Class F and Class C fly ash, and Lomar (HRWA) may have improved the ASR resistance of concrete made with Shakespeare aggregate. However, none of the test materials has eliminated ASR only affected its rate. No clear or significant differences have been seen when using Class F fly ash, Class C fly ash, or 1 percent LiOH with Grevey aggregate. Continued monitoring of this test pavement is recommended.
| Section | Description |
|---|---|
| 1 1% LiOH(S) | Few instances of deterioration. The wearing surface has a slightly to moderately worn surface with occasional popouts over aggregate particles. Three microcracks were counted, and 24 occurrences of alkali-silica gel. Three coarse and 36 fine aggregate particles show slight evidence of reaction. |
| 2 0.5% LiOH(S) | The wearing surface has a moderately worn surface on which aggregate particles are occasionally exposed. The core is very slightly distressed. Seven cracks and 24 instances of alkali-silica gel were counted. Two coarse and 27 fine aggregate particles show evidence of reaction. One fine aggregate particle was severely distressed. |
| 3 Lomar(S) | The wearing surface is moderately severely worn with frequent exposed aggregate particles, some apparently in old, worn popouts. The core shows abundant evidence of reaction but little distress. Two microcracks and 68 occurrences of gel were detected. Two coarse and 35 fine aggregate particles show evidence of reaction or distress. |
| 4 Class F Fly Ash (S) | The wearing surface is severely worn with frequent exposed coarse and fine aggregate particles. Surface wear is too great to determine whether it included any popouts. The core shows evidence of reaction but little distress. Five microcracks were detected, and 51 instances of alkali-silica gel. Ten coarse and 51 fine aggregate particles showed evidence of distress or reaction. |
| 5 Class C Fly Ash(S) | The wearing surface is severely worn, with numerous exposed coarse and fine aggregate particles, one empty coarse aggregate particle socket, and five visible cracks, three of which intersect near the center of the core. The core is severely distressed. In addition to the features noted above, Two hundred fifty-four microcracks and 135 instances of alkali-silica gel were counted. Fifty-two coarse and 75 fine aggregate particles show evidence of reaction or distress. |
| 6 Control(S) | The wearing surface is moderately worn with occasional exposed coarse and fine aggregate particles. The core shows slight evidence of distress or deterioration. Twenty-six microcracks and 25 instances of alkali-silica gel were counted. Fourteen coarse and 32 fine aggregate particles show evidence of reaction or distress. |
| 7 Blended C & F Fly Ash(S) | The wearing surface is moderately worn with frequently exposed aggregate particles. The core shows considerable evidence of reaction but little evidence of distress. Ten microcracks and 92 occurrences of alkali-silica gel were counted. Twenty-four coarse and 54 fine aggregate particles showed evidence of distress or reaction. |
| 8 Class F Fly Ash(G) | The wearing surface is severely worn with frequent exposed aggregate particles. There is considerable evidence of reaction but little evidence of distress. Twenty-one microcracks, chiefly contained within reacted aggregate particles, and 45 occurrences of alkali-silica gel were counted. Sixteen coarse and 36 fine aggregate particles showed evidence of reaction or distress. |
| 9 Control(G) | The wearing surface is moderately severely worn with frequent exposed aggregate particles. Although the core contains substantial evidence of ASR, apparent distress is slight. Twentyash—one microcracksash—chiefly limited to aggregate particlesash—and 58 instances of alkali-silica gel were counted. Sixteen coarse and 45 fine aggregate particles show evidence of distress or reaction. |
| 10 1% LiOH(G) | The wearing surface is moderately worn with moderately frequent exposed aggregate particles. The core contains abundant evidence of reaction, but little evidence of distress. Eighteen microcracks—all contained in aggregate particles—and 77 instances of alkali—silica gel were counted. Twenty-one coarse and 51 fine aggregate particles showed evidence of reaction or distress. |
| 11 Class C Fly Ash(G) | The wearing surface is severely worn with frequent exposed aggregate particles. The core contains frequent evidence of reaction, but little evidence of distress. Eleven microcracks were counted, and 55 instances of alkali-silica gel. Sixteen coarse and 60 fine aggregate particles show evidence of distress or reaction. |
| Section No. | Microcracks | Gel | Reacted Coarse Particles | Reacted Fine Particles | Total Events |
|---|---|---|---|---|---|
| 1 | 3 | 24 | 3 | 36 | 66 |
| 2 | 7 | 24 | 2 | 27 | 60 |
| 3 | 2 | 68 | 2 | 35 | 107 |
| 4 | 5 | 51 | 10 | 51 | 117 |
| 5 | 254 | 135 | 52 | 75 | 516 |
| 6 | 26 | 25 | 14 | 32 | 97 |
| 7 | 10 | 93 | 24 | 54 | 181 |
| 8 | 21 | 45 | 16 | 36 | 118 |
| 9 | 21 | 58 | 16 | 45 | 140 |
| 10 | 18 | 77 | 21 | 51 | 167 |
| 11 | 11 | 55 | 16 | 60 | 142 |

