
Site selection methodology has been described previously in (Kimbrough, et al. 2008 and Kimbrough et al. 2011).
In brief, site selection and implementation consisted of seven steps (1) determining site selection criteria- previously established by FHWA and documented in the Monitoring Protocol 2; (2) develop list of candidate sites and supporting information; (3) apply site selection filter ("coarse" and "fine"), (4) site visit; (5) select candidate site(s) via team discussion; (6) obtain site access permission(s); and (7) implement site logistics.
The purpose of any site selection process is to gather and analyze sufficient data that would lead one to draw informed conclusions regarding the selection of the most appropriate site for the monitoring that will be performed in Detroit, Michigan.
Site selection in Detroit, MI shared several methods common to those employed in Las Vegas, NV 4 and described in (Kimbrough, et al. 2008 and Kimbrough et al. 2011)3,4. The site selection process provided sufficient data to inform the selection of the most appropriate site for the pollutant measurements to be performed in Detroit, MI.
A list of possible sites was developed using the monitoring protocol's site selection criteria (Table 6). The data used to formulate the recommendations were based on data developed by the Michigan Department of Transportation (MDOT) with input from Michigan Department of Environmental Quality (MDEQ) and Southeast Michigan Council of Government (SEMCOG). In addition, geographic information system (GIS) data, tools and techniques and on-site visits by project team members were used to develop supporting information regarding each potential site. The Michigan Department of Transportation (MDOT) provided annual average daily traffic (AADT) counts. Other types of spatial data (e.g., street network) were downloaded from the Michigan GIS web site as well as other relevant web sites. The National Climatic Data Center
Table 6. All Sites Considered for Detroit Site Selection.
Site ID |
Site |
AADT |
Meteorology |
Roadway to Site Characteristics |
Nearby Sources |
Downwind Sampling |
Comments |
|
|---|---|---|---|---|---|---|---|---|
Elevation |
Direction |
|||||||
A |
I-696 (Illitch Property) |
157,800 |
W, SW |
At Grade |
North |
N |
S |
Property is privately owned some of the land is leased by the City of Farmington Hills for soccer fields |
B |
I-696 |
157,800 |
W, SW |
Slightly Below Grade |
North |
N |
S |
On boundary of two commercial properties, some vegetation obstructions |
C |
I-696 (Farmington Hills High School) |
167,500 |
W, SW |
Below Grade |
Northeast |
N |
S |
Steep, heavily vegetated embankment, school grounds have many out-buildings |
D |
M-39 (Garden View Estates) |
151,200 |
SW, S |
At Grade |
East |
CM; R |
R; C |
P33 housing project funded U.S. Department of Housing and Urban Development, HOPE VI f. Nothing built on site; area completely fenced-in |
E |
I-96 (Eliza Howell Park) |
165,300 |
SW, S |
Above Grade |
North |
R |
S; R |
Steep embankment from service drive to east side of park, broken gate into park |
F |
I-75 (Avondale High School) |
142,182 |
W, SW |
Below Grade |
East |
R |
R; V |
Steep, heavily vegetated embankment, power poles at strategic locations |
G |
I-275 (Schoolcraft Community College) |
197,700 |
W, SW |
Below Grade |
West |
CM; R |
R; C |
Site is located on the windward side of roadway, vegetated embankment, ramp |
H |
M-10 (Fairbanks Elementary School) |
117,034 |
SW, S |
Below Grade |
Northeast |
CM; R |
R; C; UT |
No unobstructed locatiion to place 250-300m monitor, AADT below 135,000 |
I |
I-75 (Amelia Earhart Middle School) |
105,500 |
SW, S |
Below Grade |
Northwest |
CM; R |
R; C; UT |
Heavily used service drive, AADT below 135, 000 |
J |
I-275/I-96 |
193,700 |
SW, S |
At Grade |
Northeast |
CM; R |
R; C; S |
Commercial Property in Livonia east of I-275/I-96 and north of 7 Mile Road I275/I96-7MI RD |
Nearby Sources N = None; UT = Urban Traffic; CM = Commercial; R = Residential |
||||||||
Downwind Sampling R = Residential; C = Complex (mixed commercial) ; S = Semi-open fields; V = Vegetation |
||||||||
Joint-agency team meetings were held, which resulted in the reduction of the number of sites from a list of 10 to approximately three sites 14,15. A review of the full table of candidate sites was conducted during these team meetings and sites that obviously did not meet minimum site criteria requirements (Table 6) were eliminated. The site selection criteria were applied as a set of "filters" and most candidate sites were eliminated during this process. For example, the first filter eliminated sites with low AADT (i.e., < 150,000) or the placement of a 300 meter downwind (250 - 350 meter) site would not be possible. Additional important criteria, while not explicitly stated in the monitoring protocol, include restricted downwind sampling, presence of confounding air pollutant sources and site access (administrative and physical) 4.
During the first site visit to Detroit in June 2008, all sites were visited as shown in Table 6, Supplemental Information. Several promising sites had to be eliminated due to impending construction activity. Two additional sites were considered unsuitable due to the inability to site the 300 meter downwind monitor (250-300 meter) monitor in an unobstructed location and a heavily used service drive, respectively. Two sites had AADT below 135,000. Five of the remaining sites did not represent Detroit's urban landscape. Another site was located on the windward side of the roadway and had to be eliminated. In addition, this site as well as another site was eliminated due to vegetated embankments. MDOT, Michigan DEQ and SEMCOG staff helped to obtain local meteorological and roadway information during the site visit that would have been otherwise unavailable 14,15.
Geospatial tools used to support this site selection process included Environmental Systems Research Institute's (ESRI) ArcGIS and GoogleEarth Pro. Relevant data layers were developed (Table 7) and maps were created based on these data layers and site selection criteria. The advantages and disadvantages of each site were "weighed". From this process, one site was selected for measuring MSAT compounds.
Table 7. Data Inputs for Detroit Site Selection Process.
Data Input |
Source |
Comments |
|---|---|---|
Spatial Data |
||
AADT |
Michigan DOT SEMCOG |
http://www.michigan.gov/mdot/0,4616,7-151-11151_11033-22141--,00.html |
Topology |
Michigan DOT |
Site visits by Michigan DOT personnel. |
EPA/FHWA Personnel |
Site visits by EPA/FHWA Personnel. |
|
Potentially confounding air pollutant sources |
EPA/FHWA Personnel |
Site visits by EPA/FHWA Personnel. |
Street Data |
Michigan GIS |
|
Points of Interest |
||
Administrative Boundaries |
||
Schools |
||
Aerial Imagery |
GlobeXplorer |
ImageConnect Service (ArcGIS) |
Google Earth |
||
Non-spatial Data |
||
Selection Criteria |
Settlement Agreement |
|
Monitoring Protocol |
||
Geometric Design, Geographic Location |
Aerial Photos - Digital Globe |
Aerial images downloaded using ArcGIS tools. |
Availability of Traffic Volume Data |
Michigan DOT |
Conference calls, site visit by EPA/FHWA Personnel. |
Meteorology |
National Climatic Data Center |
|
Downwind Sampling |
EPA/FHWA Personnel |
Site visits by EPA/FHWA Personnel. |
ArcGIS 9.2 16 was used to create the maps used in the site selection process. Spatial data were downloaded from relevant web sites. Table 7 shows the sources of data used for this site selection process. It should be noted that the use of maps for the site selection process is only a tool in the site selection process. It is very important in this process to perform site visits, establish contacts with state/local transportation agencies and environmental agencies. Typically, these groups will be able to provide up-to-date information as to site conditions that may ultimately influence site selection decisions.
Following the application of the selection criteria3,4, the candidate sites were further prioritized during a series of team discussions between U.S. EPA, U.S. FHWA, Michigan DOT, and SEMCOG staff. The pros and cons of each site were discussed. Initially, Site E was not considered a viable site as there was going to be an extensive wastewater construction project at that location. This construction project was cancelled due to budget issues. Site E was reconsidered and selected for site development. Site E met or exceeded the AADT requirements (> 150,000), did not have noise barriers, did have acceptable downwind sampling and acceptable meteorology (Figure 1, Figure 12, and Figure 14).
Proper siting of downwind sampling locations was an important criterion for this project. Any location where proper siting of downwind sampling sites was restricted due to topology, existing structures, meteorology, etc., excluded otherwise suitable sites for consideration and inclusion in this study.
As shown in Figure 13 the wind direction for Site E did have acceptable meteorological conditions. Since Detroit is an urbanized industrial city, influences from nearby sources are a factor.
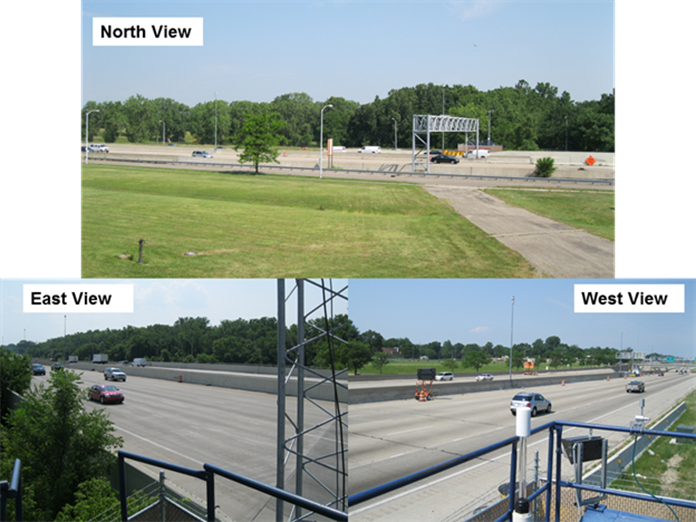
It should be noted that construction activity on the M-39, an adjacent connecting freeway, may have influenced traffic patterns during a portion of this study. The field team noted that construction did take place on the M-39 during the late-winter/early-spring of 2011. In addition, a bridge replacement project took place adjacent to the sites during the late spring/summer of 2011. This bridge replacement project involved Schoolcraft Road, a service street on either side of I-96. The sites most impacted by the bridge replacement project included Site 1 (10 m roadside) and Site 4 (100 m upwind).
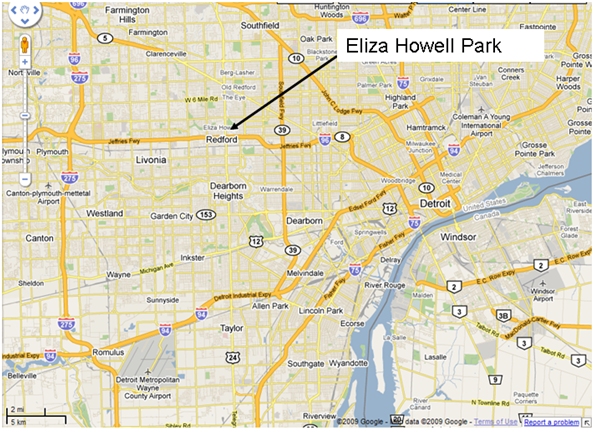
Figure 12. Overview map of Detroit.
Meteorological data from the National Climatic Data Center for the Detroit-Wayne County International Airport indicate that the wind flow is generally from the west and southwest (Figure 13).
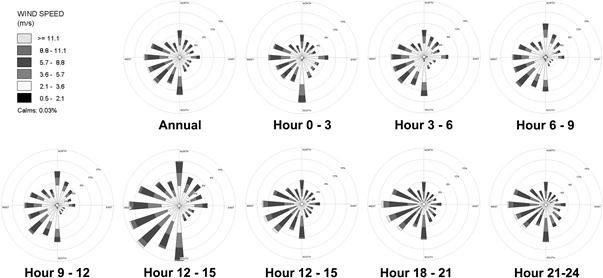
Figure 13. Wind roses for Detroit Area.
The project participants recognized that no perfect air monitoring site was possible; trade-offs were a factor of the Detroit study and would be a factor with almost any other environmental study conducted within any other city. It was a question of balancing benefits with risks and costs. The selection was further complicated by external constraints and drivers. The principal constraint was the legal mandates of the Settlement Agreement, especially the data that must be derived pursuant to the monitoring protocol. Few, if any, design decisions can be made exclusively from a single perspective. These decisions can be visualized as attractions within a force field. If the factors are evenly distributed and weighted, the diagram might appear as that in Figure 15a and b. But, as a given differential force increases, that factor will progressively drive the decision. In the present case study, the decision is most directly influenced by legal requirements, but which also needs to be scientifically credible and economically feasible (Figure 15a).
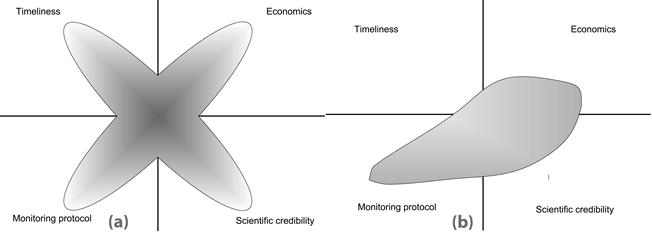
Figure 15a. Decision Force Field - Equal Weight Factors. (b). Decision Force Field - Unequal Weight Factors. Source: Adapted from D. Vallero and C. Brasier. (2008). Sustainable Design: The Science of Sustainability and Green Engineering. John Wiley & Sons, Inc. Hoboken, NJ.
As shown in Figure 15a, a number of factors have nearly equal weight in a design decision, Figure 15b indicates a decision that is most strongly influenced by legal constraints and drivers. For example, the stronger the influence of a factor (e.g. high AADT, the greater the decision will be drawn to that perspective. If the monitoring protocol is somewhat ambiguous, a number of alternatives are available, costs are flexible, and scientific credibility is minimally impacted, the design has a relatively large degree of latitude and elasticity. Note that all factors drive the decision, but that the monitoring protocol and other legal instruments have the greatest influence on the decision.
There is also the question of the best use of resources for this project. For example, a site could be chosen that would call for additional monitoring (and concomitantly additional resources) to overcome certain physical constraints (i.e., above/below grade, noise barriers). Or, a site could be chosen that has some other issue such as low AADT or where traffic monitoring equipment would have to be installed.
Site E had high AADT (206,000 AADT for 2006), no noise barriers, meteorological and traffic data availability, manageable site logistics including right-of-way access, "clean geometric design", and favorable wind direction. Clean geometric design was defined as a facility that did not impede the effective data collection of MSATs and PM2.5 2. For example, a clean geometric design would be a site that did not include multiple on/off ramps, interchanges, or other complicating facility characteristics. Of the disadvantages, Site E did not afford a perpendicular transect for all shelters. Moreover, Detroit is an industrialized urban area which means that nearby sources are part of the urban landscape. The wind blows predominately from the west-southwest quadrant. The wind roses shown in Figure 13 have been developed from meteorological data downloaded from the National Climatic Data Center, Years 1977 - 2007.
Site logistics included but was not limited to, obtaining site access permissions, gaining access to electrical power, communications connectivity, county/city permits, arranging for security fencing, etc. Site logistics, while not explicitly included in the monitoring protocol, was mission critical. Any location where site logistics, was restricted or prohibited either due to administrative or physical issues, was highly problematic and eliminated a site from further development. Obtaining site access permissions, obtaining the proper electrical feed, communications connectivity and being able to establish security fencing was vital to the project.
Electrical and communications connectivity is also challenging. Utility companies have a multitude of requirements for obtaining their services. This is a very involved process that requires interactions with utility companies as well as local (i.e., county or city) inspections departments. Implementation of site logistics may require more time than is needed to obtain ambient air measurements for a given project.
Site E was the site of choice with the most advantages and fewest disadvantages compared to other monitoring sites that have been considered. Site E had high AADT (206,000 AADT for 2006), no noise barriers, meteorological and traffic data availability, manageable site logistics including ROW access, and favorable wind direction.
Meetings, teleconferences, site visits, written reports, etc. are key activities to any site selection process. These activities ensure that all interested parties are aware of the selection process. Moreover, this ensures that the pros and cons of each site are thoroughly considered and discussed and trade-offs among the various sites are weighed. Throughout this process, trade-offs will and do occur. For example, an ideal site for the air quality modelers (e.g., complex terrain) is not necessarily an ideal site from the perspective of the field researchers (e.g., less complex terrain, site access, etc.). For this project, a group consensus was reached, culminating in a written report for FHWA and U.S. EPA management.

