
In order to be comparable to previous validation reports [Rochat 2002] [Rochat 2004], this study used the same sites, measurements, models (with updates to pavements and ground types as needed), and analysis procedures. A brief review of the measured data parameters, TNM modeling parameters, and data processing procedures are given in this section. More detailed descriptions can be found in Rochat [2002] and Rochat [2004].
2.1 Measured Data Parameters
Measurement sites were chosen to provide a range of commonly encountered characteristics, which are modeled by TNM users. All sites were adjacent to highways and were generally flat. Sites varied by: geographical location, number of lanes, pavement type, ground type, traffic characteristics, and by the presence / absence of barriers. Measurements were made at multiple locations for each site. Table 1 summarizes the measurement site parameters.
| Site Type | Number of Sites | Ranges of Microphone Distances d=dist from roadway bb=dist behind barrier |
|
|---|---|---|---|
| open area | acoustically soft ground | 4 | d = 50 to 800 ft |
| acoustically hard ground | 4 | d = 50 to 1273 ft | |
| noise barrier | 8 | bb = 50 to 300 ft | |
2.2 TNM Modeling Parameters
Originally, 17 sites were measured for inclusion in the phase 1 validation studies, however, Site 07CA was excluded due to insufficient site survey data and Site 04CT was excluded due to high winds. Site 10 was composed of two-subsites, so data will be presented for 16 sites in total. The TNM models used in the 2004 addendum were used for this report, except the pavement types for all sites and the ground types for some sites were modified. Details are given in Section 2.2.1 and 2.2.2.
2.2.1 Pavement Types
TNM v2.5 contains an emissions database for several pavement types, including Portland cement concrete (PCC), dense-graded asphaltic concrete (DGAC), and open-graded asphaltic concrete (OGAC), and Average. The emission levels for each pavement type used in TNM were based on data representative of PCC, DGAC, and OGAC at the time of the REMEL analysis [Menge 1998]. Eight PCC sites were used in the development of TNM’s PCC pavement; twenty-nine DGAC sites were used in the development of TNM’s DGAC pavement; and three OGAC sites were used in the development of TNM’s OGAC pavement. Average pavement was developed by averaging the data from both PCC and DGAC sites [Fleming 1995].
In previous validation studies, Average pavement was used because FHWA requires the use of Average pavement for federal-aid projects; using Average pavement allowed the assessment of TNM’s accuracy as modeled by those working on federal-aid projects, which represents a majority of TNM users. In the current study, the roadways for each site model were updated to use the emissions associated with each site’s documented pavement type for two reasons. The previous studies had already assessed modeling following current user requirements, that is, using Average pavement and using site-specific pavement types allows for the assessment of model accuracy in the case that the use of site-specific pavements becomes allowed for federal-aid projects. The pavement types used for each site model are shown in Table 2.
| Site | Pavement | Site | Pavement |
|---|---|---|---|
| 01MA | DGAC | 10CA-open | PCC |
| 02MA | DGAC | 11CA | DGAC |
| 03MA | DGAC | 12CA | PCC |
| 05CA | PCC | 13CA | OGAC |
| 06CA | DGAC | 14CA | DGAC |
| 08CA | PCC w/ DGAC HOV | 15CA | DGAC |
| 09CA | PCC | 16MA | DGAC |
| 10CA-berm | PCC | 17CT | DGAC |
In general, the use of DGAC or OGAC pavement in the model will lower the total sound pressure level relative to Average pavement, so for a DGAC or an OGAC site, the use of the specific pavement will help to reduce over-predicted sound levels obtained by using Average pavement. Similarly, the use of PCC pavement in the model will increase the total sound pressure level relative to Average pavement, so for a PCC site, the use of the specific pavement will help to increase under-predicted sound levels obtained by using Average pavement. The results of including the specific pavement types are shown in Section 3.
2.2.2 Ground Types
TNM modeling results are sensitive to the effective flow resistivity (EFR) of the ground, which is a single parameter that is used to model sound absorption by ground [Embleton 1983] [Menge 1998]. Sound waves propagating over acoustically soft ground experience increased sound absorption and destructive interference, while sound waves propagating over acoustically hard ground experience increased sound reflection and decreased destructive interference. The 2004 addendum [Rochat 2004] suggested that there may be better estimates for the ground types of some ground zones in the validation models.
Table 3 provides a description of the pre-defined ground types used in TNM v2.5. Previous validation modeling used best available classification of site ground types, however, over the years, the understanding of how ground should be classified in order to obtain correct EFR values has improved. Additional analysis of the literature [Crocker 1998] [Anderson 1999] [Anderson 2006] [Attenborough 2007] and conversations with area experts [Menge 2004] have increased the understanding of how ground types should be used in TNM. A more detailed listing of ground type classification is given in Table 4.
| TNM v2.5 Ground Type Classification [Anderson 1998] | EFR (cgs Rayls) |
|---|---|
| Powder snow | 10 |
| Granular snow | 40 |
| Field grass | 150 |
| Lawn | 300 |
| Gravel, loose soil | 500 |
| Hard Soil | 5000 |
| Asphalt, concrete, water | 20000 |
| Ground Type Description | Additional Detail | EFR (cgs Rayls) | Avg EFR |
|---|---|---|---|
| Dry snow | 0.1 m of newly fallen over 0.4 m older snow | 10 to 30 | 20 |
| Sugar snow | 25 to 50 | 37.5 | |
| Forest floor | pine or hemlock | 20 to 80 | 50 |
| Grass | 11.9% to 16.5% moisture content | 41 to 75 | 58 |
| Grass root layer in loamy sand | Porosity (volume %) 43.5 to 59.8% | 62 to 314 | 188 |
| Grass | rough pasture, around public buildings | 125 to 300 | 212.5 |
| Grass | various ratios of dirt & vegetation | 150 to 600 | 375 |
| Soil | various types | 106 to 450 | 278 |
| Sand | various types | 40 to 906 | 473 |
| Roadside dirt | ill-defined small rocks up to 0.1 m mesh | 300 to 800 | 550 |
| Dirt | roadside with rocks smaller than 4" diameter | 300 to 800 | 550 |
| Sandy silt | hard packed by vehicles | 800 to 2500 | 1650 |
| Limestone chips | 1/2 to 1 mesh | 1500 to 4000 | 2750 |
| Old dirt road | filled mesh | 2000 to 4000 | 3000 |
| Exposed dirt | rain-packed | 4000 to 8000 | 6000 |
| Asphalt | new, various particle size | 5000 to 15000 | 10000 |
| Quarry dust | hard packed | 5000 to 20000 | 12500 |
| Asphalt | old, sealed with dust | 25000 to 30000 | 27500 |
| Concrete | depends on finish | 30000 to 100000 | 65000 |
| Concrete | Painted | 200000 | 200000 |
| Upper limit | set by thermal-conduction and viscous boundary layer | 200000 to 1000000 | 600000 |
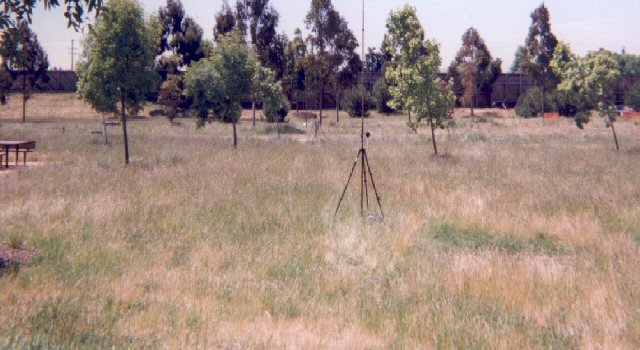
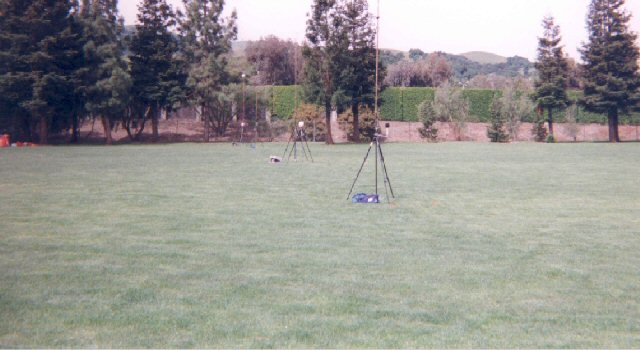
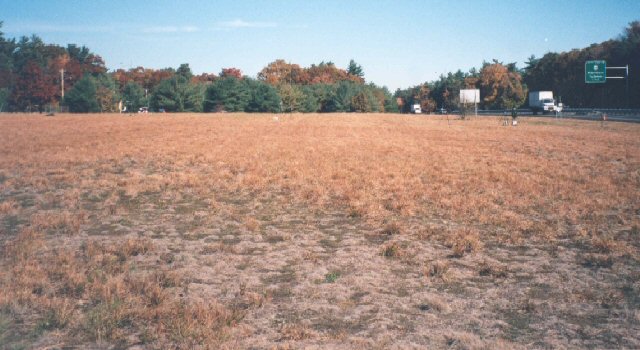
The descriptions given in Table 4 indicate some of the finer nuances involved with ground type classifications. For example, there is a wide range of classifications that grass can fall into and these classifications are dependent on moisture content, porosity, amount of exposed dirt, and other parameters. Conversations with Embleton [Menge 2004] indicated that for a grass to be considered a “field grass” with an EFR value of about 150 cgs Rayls (see Table 3), a strong root structure was required to break up the soil. Because many un-groomed fields have large patches of exposed dirt, only sparse grass, and little root structure, they would be better classified with a higher EFR value like 500 or 600 cgs Rayls. Upon reevaluation of the ground characteristics at validation sites, it has been determined that there are many areas adjacent to roads which were originally modeled as field grass, but may have been more appropriately modeled as lawn or loose soil in TNM.
It can also be seen by comparing Table 3 and Table 4 that the default EFR value of 20,000 cgs Rayls for asphalt, concrete, and pavement does not reflect the true range of EFR values for acoustically hard surfaces. Consider that in Table 4, asphalt can range from 5000 to 30,000 cgs Rayls. It was asserted in a report to Caltrans that the hard site EFR values are often over-estimated when using TNM’s pavement ground type since few sites are truly “hard” [Anderson 1999]. Previous TNM validation models have applied an EFR value of 20,000 cgs Rayls to all pavement ground zones, however, results for many of these sites had over-predictions which may indicate that many of these ground zones may have been more appropriately modeled with a lower EFR value, such as 10,000 cgs Rayls. Although water is not listed in Table 4, it is generally presumed that it is an acoustically hard surface, as indicated in Table 3. However, most areas modeled using water ground zones can have some scattering due to the roughness of the water surface. It was conjectured that a lower EFR value such as 10,000 cgs Rayls could improve predicted results for sites containing water ground zones.
Site 11CA – Originally modeled as Field Grass, no change
Site 12CA – Originally modeled as Lawn, no change
Site 01MA – Originally modeled as Field Grass, now modeled as Loose Soil
Site 05CA – Originally modeled as Field Grass, now modeled as Lawn
Site 13CA – Originally modeled as Water (20,000 cgs Rayls), now modeled as Custom (10,000 cgs Rayls)
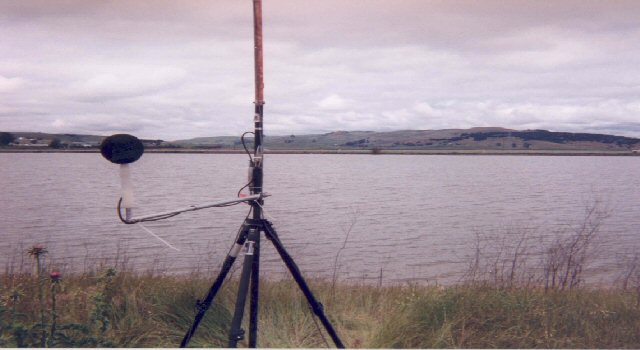
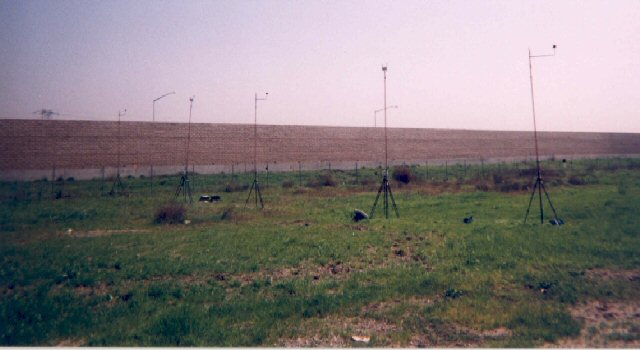
Figure 1: Ground Type Examples
In order to model validation sites’ ground types more appropriately and to understand the sensitivity of TNM’s acoustic algorithms, ground types were modified for a subset of the validation sites. Not all sites were remodeled since several sites were already considered to have the most appropriate ground types for their site. For example, sites 11CA and 12CA provide good representations of field grass and lawn ground types respectively. See Figure 1. Some sites were remodeled because improved understanding of ground type classification indicated that a change should be made. This was the case for many sites with field grass and also for sites with asphaltic pavement which were originally modeled as having an EFR value of 20,000 cgs Rayls. Site 01MA was remodeled using loose soil instead of field grass because the vegetation was much sparser than, say for example, site 11CA. Site 05CA was remodeled using lawn instead of field grass, because, although unkempt, the vegetation is relatively short and of the same general type as site 12CA for example. Site 02MA was remodeled because, even though the ground was grass covered, it was very wet and partially frozen. For this site, several EFR values were evaluated and the best results (from using 1500 cgs Rayls) are included in this report. In addition, the EFR value for water ground zones was also reduced in order to see if the model was sensitive to this change. This is particularly of interest since water can have different surface characteristics if the surface is smooth or rough, see site 13CA in Figure 1 for an example of a water surface that is somewhat rough. The modifications to the sites are listed in Table 5.
| Validation Site | Original Ground Type | Modified Ground Type |
|---|---|---|
| 01MA | Field Grass (150 cgs Rayls) | Loose Soil (500 cgs Rayls) |
| 02MA | Field Grass (150 cgs Rayls) | Custom (1500 cgs Rayls) |
| 05CA | Field Grass (150 cgs Rayls) | Lawn (300 cgs Rayls) |
| 09CA | Field Grass (150 cgs Rayls) | Lawn (300 cgs Rayls) |
| 13CA | Water (20000 cgs Rayls) | Custom (10,000 cgs Rayls) |
| 15CA | Pavement (20000 cgs Rayls) | Custom (10,000 cgs Rayls) |
| 16MA | Field Grass (150 cgs Rayls) | Loose Soil (500 cgs Rayls) |
| Pavement (20000 cgs Rayls) | Custom (10,000 cgs Rayls) | |
| 17CT | Water (20000 cgs Rayls) | Custom (10,000 cgs Rayls) |
2.3 Data Calibration
In accordance with previous studies, high wind data (wind speeds> 11 mph) were excluded and the remaining data were examined with and without calibration. Calibration was performed by using the reference microphone for each site (to minimize possible site-specific biases – described further in Section 3.3.1). For sites without a barrier, the reference microphone was located approximately 50 ft from the center line of the near travel lane and 5 ft above the roadway elevation. For sites with barriers, the reference microphone was approximately 5 ft above the top of the barrier or to the side of the barrier at 5 ft above the roadway elevation. For each site, the measured sound level at the reference microphone was subtracted from the predicted sound level for the same position for each 15 minute data block, LAeq15min,predicted – LAeq15min,measured. This calibration value was then subtracted from the predicted sound levels for all other microphone locations at the study site.

