

Chapter 1. Literature Review (continued)
Project Selection and Related Tools
Project selection is a level of decisionmaking that entails the evaluation of the attributes of different candidate projects for the purpose of funding and implementation. As a decisionmaking level, it addresses decisions pertaining to network-level analysis and functions as a bridge between high-level network decisions and site-specific, detailed project-level decisionmaking. The project selection analysis is based on information that is aggregate enough to show the big picture of the competitive projects and, therefore, identify and assess their usefulness and overall impact. However, it is also detailed enough to capture the individuality of each project, provide accurate cost estimates, and identify implementation implications for the agencies and the users.
Within the framework of Asset Management, the nature of project selection is unique because in many cases the candidate projects concern different assets and treatments. As an example, tradeoffs may consider the rehabilitation of an existing flexible pavement through milling and repaving versus the maintenance of a concrete pavement through crack sealing. As another example, tradeoffs may consider the maintenance of the roadside drainage system of a particular segment of a highway versus the rehabilitation of a bridge's concrete deck or the replacement of its steel railings.
The different types of work that may be encountered by an agency responsible for the management of roadway assets are rehabilitation, maintenance, and new construction. Furthermore, typical roadway assets that are part of an agency's roadway transportation network are pavements, bridges, tunnels, signs, culverts, drainage systems, markings, medians, etc. Table 1 presents a list of roadway assets identified by the VDOT with their corresponding definitions.
According to Hudson et al. (1997), the project selection follows the overall network programming decisions regarding the general funds to be allocated in the different types of agency works. After the agency has decided on the amount of funds to be spent in maintenance, rehabilitation, or new construction (or reconstruction), then the candidate projects that fall into each of these work programs need to be determined.
The selection of the different projects or different groups of projects to be included in a work program is heavily constrained by available budgets and usually resorts to some type of prioritization model. These models usually employ optimization, near-optimization, or other techniques to obtain results that can be used by the transportation officials to support decisionmaking (Haas et al. 1994). The most used prioritization methods have been summarized by Hudson et al. (1997) and are presented in table 2 along with their advantages and disadvantages.
| Roadway Assets | Definition |
|---|---|
| Pavements | Flexible pavements hot-mix asphalt, portland cement concrete pavements, unpaved roads, paved shoulders, and unpaved shoulders. |
| Roadsides | Vegetation and aesthetics, trees, shrubs and brush, historic markers, and right-of-way fence. |
| Drainage Structures | Cross pipes and box culverts, entrance pipes, curb and gutter, paved ditches, unpaved ditches, edge drains and underdrains, storm water ponds, and drop inlets. |
| Traffic | Attenuators, guardrail, pavement striping, pavement markings, raised pavement markers, delineators, signs, and highway lighting. |
| Structures and Bridges | Overhead sign structures, structural culverts, overall bridges, sound barriers, and retaining walls. |
| Special Facilities | Movable bridges, rest areas, river and mountain tunnels, weigh stations, and traffic monitoring systems. |
| Class of Method | Advantages/Disadvantages |
|---|---|
| Simple subjective ranking of projects based on judgment. | Quick and simple; subject to bias and inconsistency; may be far from optimal. |
| Ranking based on parameters, such as level of service and condition. | Simple and easy to use; may be far from optimal. |
| Ranking based on parameters with economic analysis. | Reasonably simple; should be closer to optimal. |
| Optimization by mathematical programming model for year-by-year basis. | Less simple; may be close to optimal; effects of timing notconsidered. |
| Near-optimization using a marginal cost-effectiveness approach. | Reasonably simple; close to optimal results. |
| Comprehensive optimization by mathematical programming model, taking into account the effects of "which," "what," and "when." | Most complex; can give optimal program (maximization ofbenefits, minimization of costs). |
Worldwide practice in the area of project prioritization has shown that in order for the analysis to be comprehensive and as accurate as possible, the effects of economic and timing parameters should be considered. Recent research in this area has focused in proposing models that include economic analysis and multiyear prioritization in the optimization process. Some of these models also take into account the effects of certainty, risk, and uncertainty in the outcome of the prioritization results (Li and Sinha 2004).
Asset management implementation has focused attention on the economic parameters of infrastructure management and their effects on the project selection. There has been extensive research on economic evaluation methods and techniques, most of which are not new and have been used by transportation agencies in the past. The most commonly used techniques include the following: benefit/cost ratio, internal rate of return, present worth method or net present value, equivalent uniform annual costs (EUAC), and cost-effectiveness (Haas et al. 2004).
The development of tools for engineering economic analysis and the development of specified software have advanced rapidly. Flintsch and Kuttesch (2004) identified various pavement engineering economic analysis software tools and listed their area of application as well as their advantages and disadvantages. The reviewed software tools constitute valid approaches for supporting project selection decisionmaking, provided that they are used in full recognition of their capabilities and limitations.
Because the way project selection is carried out by most agencies involves tools similar to the ones described above, it is reasonable to assume that the data needs of this particular level of decisionmaking should include the type and amount of data that form the inputs of these models and techniques. In other words, project selection data needs should be focused on the particular inputs that the project evaluation models require. As different agencies employ different models and techniques, the particular data needed for each agency are also bound to be different.
Data Collection, Management, and IntegrationData collection, data management, and data integration are essential parts of the Asset Management framework that are critical to its success. Timely and accurate data lead to information and form the basis for effective and efficient decisionmaking. Besides, the goal of Asset Management is the development of decision-support systems that provide "access to quantitative data on an organization's resources and its facilities' current and future performance" (Nemmers 1997).
Data collection is very much dependent on the intended use of the data. It is obvious that the level of detail and the depth needed for the collected data vary according to the hierarchical level of the decisions to be made. Although all decisionmaking levels are undisputedly part of the overall Asset Management process, data collection requirements have to specifically consider how the collected information is going to be used at the various management decision levels. Data needs for supporting the strategic, network, or project level are significantly different in terms of degree of detail and required accuracy. Broadly speaking, the data collection requirements can be categorized in the following three groups:
- Location: actual location of the asset as denoted using a linear referencing system or geographic coordinates.
- Physical attributes: description of the considered assets, which can include material type, size, length, etc.
- Condition: condition assessment data can be different from one asset category to another according to the set performance criteria. The data can be qualitative and generic (e.g., good, bad, etc.), or detailed and quantitative in accordance to establish practices and standards (e.g., pavement condition index, bridge health indices, etc.).
Researchers have defined information quality levels (IQL) to link the amount of information detail with the level of decision supported. According to the World Bank (2004), there are five information quality levels in road management (IQL 1-5). These levels relate the different types of road management information, their corresponding degree of sophistication, and the required methods for data collection and processing to the type of decisions supported, as illustrated in figure 4 and table 3. The IQL requires different levels of detail and quality in the collected data to support the corresponding decisionmaking processes, which translate into different methods and frequencies of data collection. Therefore, it is imperative for the determination of data needs to prespecify the decision level of interest. The tailoring of the data collected for effective decisionmaking within the decision level can lead to more specific and focused data collection efforts. This is investigated in the following section for the project selection decision level.
Data Collection MethodsThe various methods and technologies used for infrastructure data collection have shown a trend toward automation and computerization. Methods used for the collection of Asset Management data include (1) manual, (2) automated, (3) semiautomated, and (4) remote collection. Regardless of the method used, the existence of an effective quality control and quality assurance (QC/QA) program is vital for the success and reliability of the collection. A brief description of each method follows (VDOT 2004).
Figure 4. Information quality level concept.
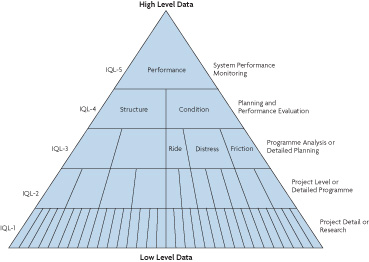
| IQL | Amount of Detail |
|---|---|
| 1 | Most comprehensive level of detail, such as that which would be used as a reference benchmark for other measurement methods or in fundamental research. Would also be used in detailed field investigations for an indepth diagnosis of problems and for high-class project design. Normally used at project level in special cases; unlikely to be used for network monitoring. Requires high-level skill and institutional resources to support and utilize collection methods. |
| 2 | A level of detail sufficient for comprehensive programming models and for standard design methods. For planning, would be used only on sample coverage. Sufficient to distinguish the performance and economic returns of different technical options with practical differences in dimensions or materials. Standard acquisition methods for project level data collection. Would usually require automated acquisition methods for network surveys and use for network level programming. Requires reliable institutional support and resources. |
| 3 | Sufficient detail for planning models and standard programming models for full network coverage. For project design, it would suit elementary methods such as catalog type with meager data needs and low-volume road/ bridge design methods. Can be collected in network surveys by semiautomated methods or combined automated and manual methods. |
| 4 | The basic summary statistics of inventory, performance, and utilization that are of interest to providers and users. Suitable for the simplest planning and programming models, but for projects is suitable only for standardized designs of very low-volume roads. The simplest, most basic collection methods, either entirely manual or entirely semiautomated, provide direct but approximate measures and suit small or resource- poor agencies. Alternatively, the statistics may be computed from more detailed data. |
Manual Collection
This method employs two or more data collectors and a distance-measuring device. The collected data are documented either with pen and paper, or in more recent cases, with handheld computers equipped with GPS (Larson and Skrypczuk 2004a). At a particular location, the data collectors walk from one site to the other and inspect and record the condition of the considered assets. A variation of this method, the windshield survey, uses a vehicle to perform the inspection while driving; the recording is still done manually. Manual surveys allow for very detailed data collection but are very labor intensive and require more time per asset than automated or semiautomated methods.
Automated CollectionThis method involves the use of a multipurpose vehicle equipped with a distance-measuring device as well as combinations of video cameras (downward- or forward-looking), gyroscopes, laser sensors, computer hardware, and GPS antennas in order to capture, store, and process the collected data. The gyroscope and GPS are used to capture location data. The laser sensors are used to acquire pavement surface properties, and the downward-looking cameras are used to assess pavement surface properties (usually distresses).
The forward-looking cameras are used to determine the location of roadside assets and assess performance measures. Specifically developed software is generally used to visualize in three dimensions the location of the transportation assets from the digital two-dimension frames. The newest data collection equipment has achieved high automation and accuracy and is capable of very fast, comprehensive data collection (Peggar et al. 2004; Rada et al. 2004). In most cases, however, even with the use of automated methods, some post processing of the data is required.
Semiautomated CollectionThis method involves similar equipment as the completely automated method but with a lesser degree of automation. It is very popular within transportation agencies and yields comprehensive and accurate data collection when properly implemented.
Remote CollectionThis last method pertains to the use of satellite imagery and remote sensing applications. These methods involve high-resolution images acquired through satellites or other types of images and scans obtained by remote sensing technologies (e.g., lasers, aerial photos, etc.). The images are used in conjunction with ground information in order to reference the location of the transportation assets and to assess asset condition or capture various asset attributes and characteristics (NASA 2000; NCRST 2001).
The general progression of automatic transportation Asset Management data collection is as follows (VDOT 2004):
- Photolog: This was the original data collection method and was used from the 1960s to the 1980s. Data had to be viewed through sequential image access or film (VDOT 2004).
- Videolog: This was mainly used during the 1980s, but in some cases it is still in use today. Data could be randomly accessed if they were placed on a laser disk. Today's practice uses mostly digital video.
- Regular resolution digital images (i.e., 640 by 480 dpi): This has been mainly used from the mid 1990s to present. Images are placed on various storage media (magnetic tapes, CDs, DVDs, etc.) and on network servers.
- High-resolution digital images (i.e., 1,300 by 1,000 dpi or Linescan cameras
with up to 4,000 pixels per line): This has been mainly used from the end of the 1990s until present. Images also can be placed on magnetic disks but are mainly on network servers and databases for network sharing.
The collection of data for transportation assets can have various purposes, such as inventory, inspection, tort reliability, and performance monitoring. The frequency of data collection may vary accordingly to its purpose. Data collection frequency usually depends on asset type, asset condition, and other factors. More information on data collection frequency can be found elsewhere in VDOT (2004).
 |
The literature review of how agencies worldwide deal with decisionmaking has brought to light particular attributes and characteristics that the collected data should possess in order to be useful for this purpose. Regardless of the particular type or category that the collected data fall into, it is of paramount importance that, when incorporated in a database, they exhibit the following characteristics (Deighton 1991):
- Integrity: Whenever two data elements represent the same piece of information, they should be equal.
- Accuracy: The data values represent as closely as possible the considered piece of information.
- Validity: The given data values are correct in terms of their possible and potential ranges of values.
- Security: Restricting access and properly ensuring systematic and frequent backups in other storage media protect sensitive, confidential, and important data.
It is also recommended that the data elements be rigorously defined in a data dictionary and that-in the most ideal of all cases-these definitions be common between all agencies and parties involved in this area of practice (Deighton 1991).
In addition, the Western European Road Directors (WERD 2003) highlighted the importance of the following criteria when selecting data required by an agency or organization:
- Relevance: Every data item collected and stored should support an explicitly defined decision need.
- Appropriateness: The amount of collected and stored data and the frequency of their updating should be based on the needs and resources of the agency or organization.
- Reliability: The data should exhibit the required accuracy, spatial coverage, completeness, and currency.
- Affordability: The collected data are in accordance with the agency's financial and staff resources.
According to the same source (WERD 2003), agencies planning to engage in data collection should consider and determine the following parameters:
- Specification of the data to be collected.
- Frequency of collection.
- Accuracy and quality that the data should exhibit.
- Completeness and currency.
As a general recommendation, it is noted that the accuracy, quality, and currency of the data should be decided based on the cost of the data collection and the value and benefit associated with the data in question, "Data should only be collected if the benefits that they provide outweigh the cost of their collection and maintenance" (WERD 2003). Data collection costs can and should be minimized by collecting only the needed data and only when needed. The data collection activities and methods used should be based on and produce results that match the levels of accuracy, precision, and resolution required by the decision processes to be supported (Smith and Lytton 1992).
Data ManagementThe data acquired by one or more of the above described methods and technologies are stored in various formats and storage media. Data formats include paper, electronic databases, and geo-referenced database systems (such as GIS). The storage media employed can be paper forms (still in use in many agencies), hard disks, magnetic tapes, CDs, DVDs, and combinations of these. Electronic data are the easiest to share and can exist in various forms such as text, graphics, photos, and videos. They can be stored either in flat files or in structured database files (relational, object-oriented), which can be standalone or part of a database system.
Organizational culture has traditionally prompted agencies to create database and information management systems that support specific applications such as pavement, bridge, sign, equipment, finance, and other management systems. These independent, legacy, stovepipe systems have to be linked in order to efficiently support Asset Management. The realization of this goal has proved to be extremely challenging because the aforementioned systems often use different data management technologies and information system environments (e.g., database design, software, hardware, etc.; FHWA 2001f). This is the focus of the next section.
Data IntegrationAs transportation asset data have been collected at different times by different units using different methods stored in varying formats and media, there is naturally a need for data integration. Data integration is essential to transform the data into information that is able to support decisionmaking at the various management levels. Transportation agencies must organize the available data into suitable forms for applications at the different organizational levels of decisionmaking. This venture presents a significant challenge because of the difficulty of data integration.
According to FHWA (2001b, 2001e, 2001f), data integration alternatives include two main approaches: (1) a fused database and (2) many interoperable databases. In the first case, the integration strategy leads to the creation of one database that contains all integrated data; in the second case existing or newly created databases are linked together, and the integration of the data is achieved with the use of queries that provide a view of the linked data.
The choice between the two integration strategies depends on many factors and is clearly a judgment call for the agency officials. The factors to be considered include the following:
- Intended use of the integrated data (by whom and for what purpose).
- Characteristics of the existing databases or information systems.
- Type and volume of the data to be integrated.
- Currently available information technology.
- Level of staff and resource allocation that will be dedicated to the process.
- Structure of the agency or organization itself (business units and their roles, data needs, people, and information systems).
Because location is an important property of all transportation assets, it has served in many cases as the common platform used for data integration. For example, various State DOTs have used GIS and other geospatial tools for data integration (Flintsch et al. 2004). GIS software and related functionalities can alternatively be incorporated in the databases as external software that enhances the analytical and reporting capabilities of the system (FHWA 2001f).
Another aid for the integration and interoperability of databases is the use of commonly accepted data definitions and consistent formats across systems. A standard data dictionary or global standard for data definition, representation, storage, and communication could be vital to data integration regardless of the integration strategy implemented. However, agencies have identified many challenges in developing and implementing data standards and converting existing legacy data to these new standards. These challenges include agreeing on suitable data formats, models, and protocols when the existing databases present extreme diversity; achieving support from the agency staff and getting people to conform to the new standards; and reducing the effort and resources needed as much as possible and implementing the standards (FHWA 2001f).
Decision Processes and Data CollectionIndependent of the data integration strategy chosen and the level of integration achieved, there are many dimensions inherent in the analytical and decisionmaking processes concerning transportation assets that need be taken into account. Decision processes can (1) be at an operational level (i.e., how to repair a bridge component) or at a more generalized strategic level (i.e., how often to resurface a road), (2) address a specific project that is geographically restricted and has a narrow scope (i.e., a route or a highway section) or a complete network of roadways (i.e., all State rural arterials), and (3) refer to resource allocation and analysis of alternatives across different assets (i.e., pavements, bridges, tunnels, signs, etc.) or different governmental jurisdictions (i.e., counties, districts, etc.). Therefore, large diverse data are needed to fully support the decision processes in all their possible dimensions and in all levels of decisionmaking within the agencies.
In addition, the resulting system's complexity is high enough to intimidate even carefully designed strategies and high levels of data integration (FHWA 2001f). A carefully conceptualized thought process of rationalizing which data is needed to support which type or level of decision processes needs to be developed. This process can lead to more effective and efficient data integration within the intended scope of the data and the decision systems they support.
The data needed to populate a complete database and inventory for the assets managed by a State transportation agency are enormous and costly. Data should be collected according to their intended use and therefore data collection should be carefully planned according to these needs. This is a notion that has been identified early in the development of Asset Management (Nemmers 1997), but occasionally seems to be forgotten. In that context, transportation agencies and organizations need a cost effective and rational approach to data collection. For this purpose, the existence of specific links between the collected data and the actual decisions they are intended to support have to be investigated.