Base Case with Inspection and Maintenance Program
|
Speed(mph) |
0 |
10 |
20 |
30 |
40 |
50 |
60 |
70 |
80 |
90 |
|---|---|---|---|---|---|---|---|---|---|---|
|
Idle |
-56.83% |
-56.67% |
-56.58% |
-56.58% |
-56.68% |
-56.85% |
-57.07% |
-56.45% |
-53.86% |
-50.86% |
|
3.4 |
-54.29% |
-54.13% |
-54.08% |
-54.16% |
-54.41% |
-54.83% |
-55.41% |
-55.24% |
-52.91% |
-49.93% |
|
7.1 |
-45.42% |
-45.25% |
-45.34% |
-45.73% |
-46.49% |
-47.75% |
-49.50% |
-50.73% |
-49.10% |
-46.01% |
|
12.1 |
-35.29% |
-35.12% |
-35.33% |
-36.03% |
-37.29% |
-39.37% |
-42.26% |
-44.73% |
-43.49% |
-40.02% |
|
19.5 |
-23.97% |
-23.78% |
-24.12% |
-25.11% |
-26.88% |
-29.80% |
-33.87% |
-37.65% |
-36.83% |
-33.01% |
|
35.9 |
46.40% |
46.43% |
45.34% |
42.90% |
38.80% |
32.34% |
23.54% |
16.03% |
18.90% |
27.27% |
Table A.1.2. 2005 Carbon Monoxide Composite Emission Factor forMobile 5b
at Different Ambient Temperatures and Average Speeds
Base Case with Inspection and Maintenance Program
|
Speed(mph) |
0 |
10 |
20 |
30 |
40 |
50 |
60 |
70 |
80 |
90 |
|---|---|---|---|---|---|---|---|---|---|---|
|
Idle |
521.95 |
461.54 |
408.01 |
360.41 |
317.89 |
284.12 |
256.88 |
231.11 |
227.36 |
242.69 |
|
3.4 |
160.45 |
141.98 |
125.60 |
111.04 |
98.03 |
87.70 |
79.36 |
71.47 |
70.36 |
75.13 |
|
7.1 |
90.65 |
80.30 |
71.12 |
62.96 |
55.67 |
49.88 |
45.20 |
40.78 |
40.18 |
42.92 |
|
12.1 |
63.22 |
55.98 |
49.57 |
43.87 |
38.77 |
34.73 |
31.46 |
28.37 |
27.94 |
29.83 |
|
19.5 |
48.02 |
42.48 |
37.57 |
33.20 |
29.29 |
26.19 |
23.69 |
21.33 |
20.98 |
22.38 |
|
35.9 |
23.68 |
20.96 |
18.55 |
16.41 |
14.50 |
12.98 |
11.75 |
10.59 |
10.42 |
11.12 |
Table A.1.3. 2005 Carbon Monoxide Composite Emission Factor forMobile 6
at Different Ambient Temperatures and Average Speeds
Base Case with Inspection and Maintenance Program.
|
Speed(mph) |
0 |
10 |
20 |
30 |
40 |
50 |
60 |
70 |
80 |
90 |
|---|---|---|---|---|---|---|---|---|---|---|
|
Idle |
225.32 |
199.99 |
177.15 |
156.49 |
137.72 |
122.61 |
110.27 |
100.64 |
104.91 |
119.26 |
|
3.4 |
73.34 |
65.13 |
57.68 |
50.90 |
44.69 |
39.61 |
35.38 |
31.99 |
33.13 |
37.62 |
|
7.1 |
49.47 |
43.96 |
38.88 |
34.17 |
29.79 |
26.06 |
22.83 |
20.09 |
20.45 |
23.17 |
|
12.1 |
40.91 |
36.32 |
32.06 |
28.06 |
24.31 |
21.05 |
18.16 |
15.68 |
15.79 |
17.89 |
|
19.5 |
36.51 |
32.37 |
28.50 |
24.86 |
21.42 |
18.39 |
15.67 |
13.30 |
13.25 |
14.99 |
|
35.9 |
34.67 |
30.70 |
26.97 |
23.45 |
20.12 |
17.17 |
14.51 |
12.28 |
12.39 |
14.16 |
Base Case with Inspection and Maintenance Program.
|
Speed(mph) |
0 |
10 |
20 |
30 |
40 |
50 |
60 |
70 |
80 |
90 |
|---|---|---|---|---|---|---|---|---|---|---|
|
Idle |
-79.50% |
-79.30% |
-79.18% |
-79.14% |
-79.20% |
-79.37% |
-79.63% |
-79.68% |
-78.85% |
-77.65% |
|
3.4 |
-77.90% |
-77.70% |
-77.61% |
-77.64% |
-77.81% |
-78.14% |
-78.62% |
-78.95% |
-78.25% |
-77.02% |
|
7.1 |
-72.39% |
-72.21% |
-72.23% |
-72.47% |
-72.98% |
-73.86% |
-75.08% |
-76.25% |
-75.90% |
-74.52% |
|
12.1 |
-66.81% |
-66.64% |
-66.75% |
-67.18% |
-68.01% |
-69.40% |
-71.33% |
-73.28% |
-73.21% |
-71.62% |
|
19.5 |
-61.01% |
-60.83% |
-61.00% |
-61.61% |
-62.74% |
-64.63% |
-67.26% |
-70.20% |
-70.86% |
-69.41% |
|
35.9 |
-21.52% |
-21.28% |
-21.80% |
-23.24% |
-25.81% |
-29.97% |
-35.69% |
-42.29% |
-44.41% |
-41.99% |
Table A.1.5. 2035 Carbon Monoxide Composite Emission Factor forMobile 5b
at Different Ambient Temperatures and Average Speeds
Base Case with Inspection and Maintenance Program.
|
Speed(mph) |
0 |
10 |
20 |
30 |
40 |
50 |
60 |
70 |
80 |
90 |
|---|---|---|---|---|---|---|---|---|---|---|
|
Idle |
483.35 |
426.72 |
376.78 |
332.59 |
293.33 |
262.51 |
237.97 |
214.83 |
211.53 |
224.95 |
|
3.4 |
149.80 |
132.34 |
116.94 |
103.31 |
91.20 |
81.69 |
74.12 |
66.98 |
65.98 |
70.16 |
|
7.1 |
85.67 |
75.77 |
67.04 |
59.31 |
52.44 |
47.05 |
42.76 |
38.71 |
38.16 |
40.55 |
|
12.1 |
60.48 |
53.48 |
47.31 |
41.85 |
36.99 |
33.18 |
30.15 |
27.29 |
26.89 |
28.58 |
|
19.5 |
46.51 |
41.09 |
36.31 |
32.08 |
28.32 |
25.37 |
23.02 |
20.81 |
20.49 |
21.77 |
|
35.9 |
22.12 |
19.55 |
17.29 |
15.28 |
13.50 |
12.10 |
10.98 |
9.93 |
9.78 |
10.39 |
Table A.1.6. 2035 Carbon Monoxide Composite Emission Factor forMobile 6
at Different Ambient Temperatures and Average Speeds
Base Case with Inspection and Maintenance Program.
|
Speed(mph) |
0 |
10 |
20 |
30 |
40 |
50 |
60 |
70 |
80 |
90 |
|---|---|---|---|---|---|---|---|---|---|---|
|
Idle |
99.09 |
88.33 |
78.46 |
69.38 |
61.00 |
54.15 |
48.48 |
43.65 |
44.74 |
50.27 |
|
3.4 |
33.11 |
29.51 |
26.18 |
23.10 |
20.24 |
17.86 |
15.85 |
14.10 |
14.35 |
16.12 |
|
7.1 |
23.65 |
21.05 |
18.62 |
16.33 |
14.17 |
12.30 |
10.66 |
9.19 |
9.20 |
10.33 |
|
12.1 |
20.07 |
17.84 |
15.73 |
13.73 |
11.83 |
10.15 |
8.65 |
7.29 |
7.21 |
8.11 |
|
19.5 |
18.14 |
16.10 |
14.16 |
12.32 |
10.55 |
8.97 |
7.54 |
6.20 |
5.97 |
6.66 |
|
35.9 |
17.36 |
15.39 |
13.52 |
11.73 |
10.01 |
8.47 |
7.06 |
5.73 |
5.44 |
6.03 |
Without Inspection and Maintenance Program.
|
Speed(mph) |
0 |
10 |
20 |
30 |
40 |
50 |
60 |
70 |
80 |
90 |
|---|---|---|---|---|---|---|---|---|---|---|
|
Idle |
-55.52% |
-55.38% |
-55.31% |
-55.33% |
-55.45% |
-55.62% |
-55.83% |
-55.19% |
-52.59% |
-49.60% |
|
3.4 |
-53.11% |
-52.97% |
-52.93% |
-53.03% |
-53.29% |
-53.69% |
-54.22% |
-53.99% |
-51.63% |
-48.65% |
|
7.1 |
-44.81% |
-44.65% |
-44.74% |
-45.12% |
-45.84% |
-47.01% |
-48.62% |
-49.67% |
-47.95% |
-44.87% |
|
12.1 |
-35.32% |
-35.16% |
-35.36% |
-36.01% |
-37.19% |
-39.12% |
-41.77% |
-43.96% |
-42.60% |
-39.19% |
|
19.5 |
-24.76% |
-24.57% |
-24.88% |
-25.79% |
-27.44% |
-30.13% |
-33.87% |
-37.36% |
-36.65% |
-33.16% |
|
35.9 |
44.08% |
44.15% |
43.17% |
40.92% |
37.13% |
31.17% |
23.10% |
16.05% |
18.43% |
25.96% |
Table A.2.2. 2005 Carbon Monoxide Composite Emission Factor forMobile 5b
at Different Ambient Temperatures and Average Speeds
Without Inspection and Maintenance Program.
|
Speed(mph) |
0 |
10 |
20 |
30 |
40 |
50 |
60 |
70 |
80 |
90 |
|---|---|---|---|---|---|---|---|---|---|---|
|
Idle |
570.12 |
504.02 |
445.60 |
393.76 |
347.58 |
311.15 |
281.99 |
254.45 |
250.75 |
267.57 |
|
3.4 |
175.10 |
154.89 |
137.03 |
121.18 |
107.06 |
95.91 |
86.99 |
78.57 |
77.47 |
82.69 |
|
7.1 |
98.86 |
87.53 |
77.52 |
68.64 |
60.72 |
54.47 |
49.47 |
44.75 |
44.16 |
47.15 |
|
12.1 |
68.98 |
61.06 |
54.06 |
47.85 |
42.32 |
37.95 |
34.45 |
31.15 |
30.73 |
32.80 |
|
19.5 |
52.46 |
46.39 |
41.03 |
36.26 |
32.02 |
28.68 |
26.00 |
23.47 |
23.13 |
24.67 |
|
35.9 |
25.85 |
22.87 |
20.24 |
17.91 |
15.83 |
14.19 |
12.87 |
11.63 |
11.47 |
12.24 |
Table A.2.3. 2005 Carbon Monoxide Composite Emission Factor forMobile 6
at Different Ambient Temperatures and Average Speeds
Without Inspection and Maintenance Program.
|
Speed(mph) |
0 |
10 |
20 |
30 |
40 |
50 |
60 |
70 |
80 |
90 |
|---|---|---|---|---|---|---|---|---|---|---|
|
Idle |
253.60 |
224.90 |
199.12 |
175.88 |
154.86 |
138.09 |
124.56 |
114.02 |
118.89 |
134.85 |
|
3.4 |
82.10 |
72.85 |
64.49 |
56.91 |
50.01 |
44.42 |
39.82 |
36.15 |
37.47 |
42.46 |
|
7.1 |
54.56 |
48.45 |
42.84 |
37.67 |
32.89 |
28.87 |
25.42 |
22.52 |
22.99 |
25.99 |
|
12.1 |
44.61 |
39.59 |
34.94 |
30.62 |
26.58 |
23.11 |
20.06 |
17.46 |
17.64 |
19.95 |
|
19.5 |
39.47 |
34.99 |
30.82 |
26.91 |
23.24 |
20.04 |
17.19 |
14.70 |
14.65 |
16.49 |
|
35.9 |
37.24 |
32.97 |
28.98 |
25.23 |
21.70 |
18.61 |
15.84 |
13.50 |
13.58 |
15.41 |
Without Inspection and Maintenance Program.
|
Speed(mph) |
0 |
10 |
20 |
30 |
40 |
50 |
60 |
70 |
80 |
90 |
|---|---|---|---|---|---|---|---|---|---|---|
|
Idle |
-76.34% |
-76.10% |
-75.94% |
-75.86% |
-75.87% |
-75.95% |
-76.08% |
-75.91% |
-74.74% |
-73.29% |
|
3.4 |
-74.82% |
-74.59% |
-74.45% |
-74.43% |
-74.54% |
-74.77% |
-75.10% |
-75.17% |
-74.12% |
-72.65% |
|
7.1 |
-69.58% |
-69.35% |
-69.30% |
-69.47% |
-69.88% |
-70.59% |
-71.60% |
-72.42% |
-71.68% |
-70.07% |
|
12.1 |
-64.24% |
-64.01% |
-64.03% |
-64.35% |
-65.04% |
-66.21% |
-67.83% |
-69.35% |
-68.86% |
-67.06% |
|
19.5 |
-58.68% |
-58.43% |
-58.50% |
-58.96% |
-59.90% |
-61.51% |
-63.75% |
-66.26% |
-66.71% |
-65.29% |
|
35.9 |
-17.66% |
-17.25% |
-17.55% |
-18.69% |
-20.85% |
-24.41% |
-29.34% |
-35.05% |
-36.72% |
-34.36% |
Table A.2.5. 2035 Carbon Monoxide Composite Emission Factor forMobile 5b
at Different Ambient Temperatures and Average Speeds
Without Inspection and Maintenance Program.
|
Speed(mph) |
0 |
10 |
20 |
30 |
40 |
50 |
60 |
70 |
80 |
90 |
|---|---|---|---|---|---|---|---|---|---|---|
|
Idle |
531.99 |
469.56 |
414.62 |
366.12 |
323.14 |
289.61 |
263.11 |
238.17 |
234.92 |
249.82 |
|
3.4 |
164.76 |
145.51 |
128.58 |
113.62 |
100.36 |
90.02 |
81.85 |
74.16 |
73.17 |
77.81 |
|
7.1 |
94.12 |
83.21 |
73.61 |
65.14 |
57.62 |
51.76 |
47.13 |
42.77 |
42.22 |
44.87 |
|
12.1 |
66.45 |
58.74 |
51.96 |
45.97 |
40.66 |
36.51 |
33.24 |
30.16 |
29.76 |
31.63 |
|
19.5 |
51.16 |
45.18 |
39.93 |
35.28 |
31.17 |
27.96 |
25.42 |
23.03 |
22.72 |
24.14 |
|
35.9 |
24.31 |
21.48 |
18.99 |
16.79 |
14.84 |
13.31 |
12.11 |
10.98 |
10.83 |
11.51 |
Table A.2.6. 2035 Carbon Monoxide Composite Emission Factor forMobile 6
at Different Ambient Temperatures and Average Speeds
Without Inspection and Maintenance Program.
|
Speed(mph) |
0 |
10 |
20 |
30 |
40 |
50 |
60 |
70 |
80 |
90 |
|---|---|---|---|---|---|---|---|---|---|---|
|
Idle |
125.88 |
112.20 |
99.75 |
88.38 |
77.97 |
69.65 |
62.93 |
57.39 |
59.35 |
66.73 |
|
3.4 |
41.49 |
36.98 |
32.85 |
29.05 |
25.56 |
22.72 |
20.38 |
18.42 |
18.94 |
21.28 |
|
7.1 |
28.64 |
25.50 |
22.60 |
19.89 |
17.36 |
15.22 |
13.39 |
11.80 |
11.95 |
13.43 |
|
12.1 |
23.77 |
21.14 |
18.69 |
16.39 |
14.21 |
12.34 |
10.69 |
9.24 |
9.27 |
10.42 |
|
19.5 |
21.14 |
18.78 |
16.57 |
14.48 |
12.50 |
10.76 |
9.22 |
7.77 |
7.56 |
8.38 |
|
35.9 |
20.02 |
17.77 |
15.66 |
13.65 |
11.74 |
10.06 |
8.56 |
7.13 |
6.85 |
7.55 |
3-Years-Newer Average Age Fleet Distribution for Light-duty Vehicles and Trucks.
|
Speed(mph) |
0 |
10 |
20 |
30 |
40 |
50 |
60 |
70 |
80 |
90 |
|---|---|---|---|---|---|---|---|---|---|---|
|
Idle |
-55.81% |
-55.63% |
-55.53% |
-55.50% |
-55.56% |
-55.66% |
-55.80% |
-55.09% |
-52.41% |
-49.38% |
|
3.4 |
-52.86% |
-52.69% |
-52.63% |
-52.71% |
-52.94% |
-53.33% |
-53.87% |
-53.67% |
-51.29% |
-48.26% |
|
7.1 |
-42.66% |
-42.51% |
-42.62% |
-43.05% |
-43.88% |
-45.22% |
-47.08% |
-48.47% |
-46.90% |
-43.74% |
|
12.1 |
-31.34% |
-31.21% |
-31.49% |
-32.27% |
-33.67% |
-35.93% |
-39.07% |
-41.90% |
-40.83% |
-37.29% |
|
19.5 |
-18.89% |
-18.75% |
-19.18% |
-20.30% |
-22.26% |
-25.47% |
-29.93% |
-34.27% |
-33.75% |
-29.87% |
|
35.9 |
57.15% |
57.04% |
55.71% |
52.91% |
48.31% |
41.14% |
31.37% |
22.44% |
24.42% |
32.79% |
Table A.3.2. 2005 Carbon Monoxide Composite Emission Factors forMobile 5b
at Different Ambient Temperatures and Average Speeds
3-Years-Newer Average Age Fleet Distribution for Light-duty Vehicles and Trucks.
|
Speed(mph) |
0 |
10 |
20 |
30 |
40 |
50 |
60 |
70 |
80 |
90 |
|---|---|---|---|---|---|---|---|---|---|---|
|
Idle |
411.60 |
364.23 |
322.05 |
284.31 |
250.39 |
223.06 |
200.66 |
179.35 |
175.72 |
187.60 |
|
3.4 |
126.85 |
112.34 |
99.41 |
87.85 |
77.45 |
69.08 |
62.21 |
55.67 |
54.59 |
58.31 |
|
7.1 |
71.94 |
63.79 |
56.53 |
50.04 |
44.20 |
39.49 |
35.63 |
31.96 |
31.37 |
33.52 |
|
12.1 |
50.24 |
44.54 |
39.46 |
34.91 |
30.82 |
27.53 |
24.83 |
22.25 |
21.84 |
23.32 |
|
19.5 |
38.16 |
33.79 |
29.89 |
26.40 |
23.27 |
20.74 |
18.67 |
16.70 |
16.36 |
17.46 |
|
35.9 |
18.75 |
16.61 |
14.71 |
13.00 |
11.47 |
10.24 |
9.23 |
8.27 |
8.11 |
8.66 |
Table A.3.3. 2005 Carbon Monoxide Composite Emission Factors forMobile 6
at Different Ambient Temperatures and Average Speeds
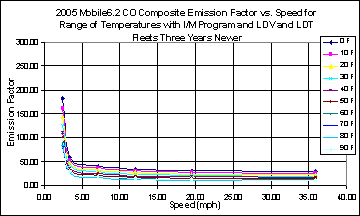
3-Years-Newer Average Age Fleet Distribution for Light-duty Vehicles and Trucks.
|
Speed(mph) |
0 |
10 |
20 |
30 |
40 |
50 |
60 |
70 |
80 |
90 |
|---|---|---|---|---|---|---|---|---|---|---|
|
Idle |
181.90 |
161.60 |
143.22 |
126.52 |
111.28 |
98.90 |
88.69 |
80.55 |
83.63 |
94.97 |
|
3.4 |
59.79 |
53.15 |
47.09 |
41.54 |
36.45 |
32.24 |
28.69 |
25.79 |
26.59 |
30.17 |
|
7.1 |
41.25 |
36.68 |
32.44 |
28.49 |
24.81 |
21.63 |
18.85 |
16.47 |
16.66 |
18.86 |
|
12.1 |
34.49 |
30.64 |
27.03 |
23.64 |
20.45 |
17.64 |
15.13 |
12.93 |
12.92 |
14.63 |
|
19.5 |
30.95 |
27.45 |
24.16 |
21.04 |
18.09 |
15.46 |
13.08 |
10.98 |
10.84 |
12.24 |
|
35.9 |
29.46 |
26.08 |
22.90 |
19.89 |
17.02 |
14.45 |
12.12 |
10.12 |
10.09 |
11.49 |
3-Years-Newer Average Age Fleet Distribution for Light-duty Vehicles and Trucks.
|
Speed(mph) |
0 |
10 |
20 |
30 |
40 |
50 |
60 |
70 |
80 |
90 |
|---|---|---|---|---|---|---|---|---|---|---|
|
Idle |
-78.55% |
-78.35% |
-78.23% |
-78.20% |
-78.25% |
-78.40% |
-78.62% |
-78.63% |
-77.73% |
-76.46% |
|
3.4 |
-76.73% |
-76.55% |
-76.47% |
-76.51% |
-76.68% |
-77.02% |
-77.50% |
-77.81% |
-77.05% |
-75.74% |
|
7.1 |
-70.54% |
-70.39% |
-70.44% |
-70.73% |
-71.29% |
-72.24% |
-73.55% |
-74.83% |
-74.47% |
-72.98% |
|
12.1 |
-64.29% |
-64.16% |
-64.32% |
-64.83% |
-65.75% |
-67.27% |
-69.37% |
-71.55% |
-71.55% |
-69.85% |
|
19.5 |
-57.78% |
-57.64% |
-57.89% |
-58.59% |
-59.86% |
-61.93% |
-64.82% |
-68.11% |
-68.92% |
-67.37% |
|
35.9 |
-15.03% |
-14.90% |
-15.58% |
-17.26% |
-20.12% |
-24.71% |
-31.02% |
-38.43% |
-40.94% |
-38.36% |
Table A.3.5. 2035 Carbon Monoxide Composite Emission Factors forMobile 5b
at Different Ambient Temperatures and Average Speeds
3-Years-Newer Average Age Fleet Distribution for Light-duty Vehicles and Trucks.
|
Speed(mph) |
0 |
10 |
20 |
30 |
40 |
50 |
60 |
70 |
80 |
90 |
|---|---|---|---|---|---|---|---|---|---|---|
|
Idle |
385.09 |
340.26 |
300.49 |
265.04 |
233.32 |
207.98 |
187.40 |
167.87 |
164.46 |
174.84 |
|
3.4 |
119.50 |
105.67 |
93.39 |
82.46 |
72.67 |
64.85 |
58.50 |
52.47 |
51.44 |
54.67 |
|
7.1 |
68.48 |
60.63 |
53.67 |
47.47 |
41.91 |
37.47 |
33.87 |
30.45 |
29.88 |
31.74 |
|
12.1 |
48.33 |
42.79 |
37.87 |
33.48 |
29.55 |
26.42 |
23.87 |
21.46 |
21.05 |
22.35 |
|
19.5 |
37.11 |
32.82 |
29.01 |
25.62 |
22.58 |
20.15 |
18.18 |
16.31 |
15.98 |
16.97 |
|
35.9 |
17.68 |
15.65 |
13.84 |
12.23 |
10.78 |
9.63 |
8.69 |
7.81 |
7.65 |
8.13 |
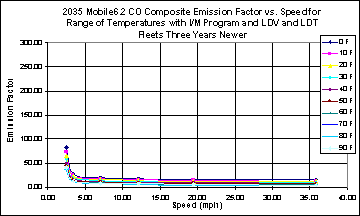
Table A.3.6. 2035 Carbon Monoxide Composite Emission Factors forMobile 6
at Different Ambient Temperatures and Average Speeds
3-Years-Newer Average Age Fleet Distribution for Light-duty Vehicles and Trucks.
|
Speed(mph) |
0 |
10 |
20 |
30 |
40 |
50 |
60 |
70 |
80 |
90 |
|---|---|---|---|---|---|---|---|---|---|---|
|
Idle |
82.62 |
73.66 |
65.41 |
57.79 |
50.74 |
44.93 |
40.06 |
35.87 |
36.63 |
41.16 |
|
3.4 |
27.80 |
24.78 |
21.98 |
19.37 |
16.94 |
14.90 |
13.16 |
11.64 |
11.80 |
13.26 |
|
7.1 |
20.17 |
17.95 |
15.86 |
13.90 |
12.03 |
10.40 |
8.96 |
7.67 |
7.63 |
8.58 |
|
12.1 |
17.26 |
15.33 |
13.51 |
11.78 |
10.12 |
8.65 |
7.31 |
6.11 |
5.99 |
6.74 |
|
19.5 |
15.67 |
13.90 |
12.22 |
10.61 |
9.06 |
7.67 |
6.40 |
5.20 |
4.97 |
5.54 |
|
35.9 |
15.03 |
13.32 |
11.68 |
10.12 |
8.61 |
7.25 |
6.00 |
4.81 |
4.52 |
5.01 |
3-Years-Older Average Age Fleet Distribution for Light-duty Vehicles and Trucks.
|
Speed(mph) |
0 |
10 |
20 |
30 |
40 |
50 |
60 |
70 |
80 |
90 |
|---|---|---|---|---|---|---|---|---|---|---|
|
Idle |
-56.25% |
-56.09% |
-56.00% |
-56.01% |
-56.12% |
-56.33% |
-56.63% |
-56.11% |
-53.66% |
-50.73% |
|
3.4 |
-53.81% |
-53.64% |
-53.59% |
-53.68% |
-53.93% |
-54.39% |
-55.03% |
-54.95% |
-52.76% |
-49.85% |
|
7.1 |
-45.25% |
-45.06% |
-45.12% |
-45.50% |
-46.25% |
-47.52% |
-49.31% |
-50.61% |
-49.15% |
-46.17% |
|
12.1 |
-35.16% |
-34.95% |
-35.13% |
-35.79% |
-37.03% |
-39.11% |
-42.01% |
-44.55% |
-43.53% |
-40.22% |
|
19.5 |
-23.70% |
-23.45% |
-23.74% |
-24.68% |
-26.40% |
-29.31% |
-33.38% |
-37.27% |
-36.76% |
-33.19% |
|
35.9 |
45.30% |
45.45% |
44.50% |
42.20% |
38.25% |
31.93% |
23.26% |
15.55% |
17.55% |
25.19% |
Table A.4.2. 2005 Carbon Monoxide Composite Emission Factors forMobile 5b
at Different Ambient Temperatures and Average Speeds
3-Years-Older Average Age Fleet Distribution for Light-duty Vehicles and Trucks.
|
Speed(mph) |
0 |
10 |
20 |
30 |
40 |
50 |
60 |
70 |
80 |
90 |
|---|---|---|---|---|---|---|---|---|---|---|
|
Idle |
623.42 |
551.04 |
487.04 |
430.25 |
379.65 |
339.70 |
307.70 |
277.48 |
273.39 |
291.83 |
|
3.4 |
191.12 |
169.03 |
149.50 |
132.16 |
116.72 |
104.52 |
94.75 |
85.52 |
84.31 |
90.02 |
|
7.1 |
107.50 |
95.17 |
84.26 |
74.57 |
65.94 |
59.13 |
53.67 |
48.52 |
47.87 |
51.13 |
|
12.1 |
74.75 |
66.15 |
58.55 |
51.81 |
45.79 |
41.05 |
37.25 |
33.65 |
33.19 |
35.44 |
|
19.5 |
56.66 |
50.09 |
44.28 |
39.12 |
34.53 |
30.91 |
28.01 |
25.26 |
24.89 |
26.56 |
|
35.9 |
28.21 |
24.96 |
22.08 |
19.53 |
17.25 |
15.46 |
14.02 |
12.66 |
12.48 |
13.32 |
Table A.4.3. 2005 Carbon Monoxide Composite Emission Factors forMobile 6
at Different Ambient Temperatures and Average Speeds
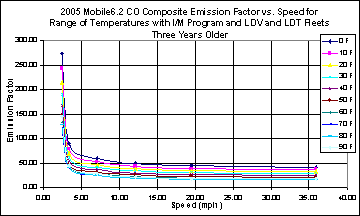
3-Years-Older Average Age Fleet Distribution for Light-duty Vehicles and Trucks.
|
Speed(mph) |
0 |
10 |
20 |
30 |
40 |
50 |
60 |
70 |
80 |
90 |
|---|---|---|---|---|---|---|---|---|---|---|
|
Idle |
272.73 |
241.97 |
214.28 |
189.26 |
166.58 |
148.33 |
133.46 |
121.78 |
126.69 |
143.79 |
|
3.4 |
88.28 |
78.37 |
69.39 |
61.22 |
53.77 |
47.67 |
42.61 |
38.53 |
39.82 |
45.14 |
|
7.1 |
58.86 |
52.29 |
46.24 |
40.64 |
35.45 |
31.03 |
27.21 |
23.96 |
24.34 |
27.52 |
|
12.1 |
48.47 |
43.04 |
37.98 |
33.26 |
28.84 |
25.00 |
21.60 |
18.66 |
18.75 |
21.19 |
|
19.5 |
43.23 |
38.34 |
33.77 |
29.47 |
25.42 |
21.85 |
18.66 |
15.85 |
15.74 |
17.74 |
|
35.9 |
40.99 |
36.30 |
31.91 |
27.77 |
23.85 |
20.39 |
17.28 |
14.63 |
14.67 |
16.68 |
3-Years-Older Average Age Fleet Distribution for Light-duty Vehicles and Trucks.
|
Speed(mph) |
0 |
10 |
20 |
30 |
40 |
50 |
60 |
70 |
80 |
90 |
|---|---|---|---|---|---|---|---|---|---|---|
|
Idle |
-80.32% |
-80.11% |
-79.99% |
-79.95% |
-80.03% |
-80.21% |
-80.50% |
-80.60% |
-79.84% |
-78.69% |
|
3.4 |
-78.79% |
-78.59% |
-78.49% |
-78.52% |
-78.69% |
-79.03% |
-79.54% |
-79.89% |
-79.25% |
-78.08% |
|
7.1 |
-73.57% |
-73.37% |
-73.37% |
-73.59% |
-74.08% |
-74.94% |
-76.14% |
-77.30% |
-77.01% |
-75.71% |
|
12.1 |
-68.27% |
-68.08% |
-68.16% |
-68.56% |
-69.35% |
-70.69% |
-72.56% |
-74.46% |
-74.43% |
-72.94% |
|
19.5 |
-62.78% |
-62.57% |
-62.71% |
-63.28% |
-64.36% |
-66.18% |
-68.72% |
-71.54% |
-72.19% |
-70.82% |
|
35.9 |
-25.03% |
-24.72% |
-25.17% |
-26.50% |
-28.94% |
-32.94% |
-38.45% |
-44.79% |
-46.84% |
-44.56% |
Table A.4.5. 2035 Carbon Monoxide Composite Emission Factor forMobile 5b
at Different Ambient Temperatures and Average Speeds
3-Years-Older Average Age Fleet Distribution for Light-duty Vehicles and Trucks.
|
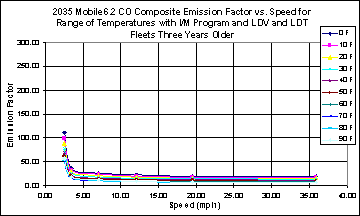
Speed(mph) |
0 |
10 |
20 |
30 |
40 |
50 |
60 |
70 |
80 |
90 |
|---|---|---|---|---|---|---|---|---|---|---|
|
Idle |
566.25 |
499.63 |
441.08 |
389.48 |
343.82 |
308.35 |
280.46 |
254.24 |
251.02 |
266.99 |
|
3.4 |
175.38 |
154.84 |
136.79 |
120.87 |
106.79 |
95.86 |
87.25 |
79.17 |
78.19 |
83.16 |
|
7.1 |
100.18 |
88.55 |
78.32 |
69.30 |
61.31 |
55.11 |
50.24 |
45.65 |
45.11 |
47.95 |
|
12.1 |
70.72 |
62.50 |
55.27 |
48.90 |
43.26 |
38.87 |
35.43 |
32.19 |
31.80 |
33.80 |
|
19.5 |
54.43 |
48.06 |
42.46 |
37.52 |
33.15 |
29.76 |
27.09 |
24.58 |
24.27 |
25.80 |
|
35.9 |
25.86 |
22.84 |
20.19 |
17.85 |
15.78 |
14.17 |
12.90 |
11.71 |
11.57 |
12.29 |
Table A.4.6. 2035 Carbon Monoxide Composite Emission Factors forMobile 6
at Different Ambient Temperatures and Average Speeds
3-Years-Older Average Age Fleet Distribution for Light-duty Vehicles and Trucks.
|
Speed(mph) |
0 |
10 |
20 |
30 |
40 |
50 |
60 |
70 |
80 |
90 |
|---|---|---|---|---|---|---|---|---|---|---|
|
Idle |
111.45 |
99.36 |
88.27 |
78.08 |
68.68 |
61.02 |
54.68 |
49.31 |
50.61 |
56.89 |
|
3.4 |
37.19 |
33.15 |
29.42 |
25.96 |
22.76 |
20.10 |
17.86 |
15.92 |
16.22 |
18.23 |
|
7.1 |
26.48 |
23.58 |
20.86 |
18.30 |
15.89 |
13.81 |
11.99 |
10.36 |
10.37 |
11.65 |
|
12.1 |
22.44 |
19.95 |
17.60 |
15.37 |
13.26 |
11.39 |
9.72 |
8.22 |
8.13 |
9.15 |
|
19.5 |
20.26 |
17.99 |
15.83 |
13.78 |
11.82 |
10.07 |
8.47 |
7.00 |
6.75 |
7.53 |
|
35.9 |
19.39 |
17.19 |
15.11 |
13.12 |
11.21 |
9.50 |
7.94 |
6.47 |
6.15 |
6.82 |
30% Decrease in Light-duty Vehicles VMT Fraction.
|
Speed(mph) |
0 |
10 |
20 |
30 |
40 |
50 |
60 |
70 |
80 |
90 |
|---|---|---|---|---|---|---|---|---|---|---|
|
Idle |
-56.89% |
-56.69% |
-56.57% |
-56.53% |
-56.57% |
-56.67% |
-56.81% |
-56.32% |
-54.23% |
-51.73% |
|
3.4 |
-54.49% |
-54.29% |
-54.21% |
-54.25% |
-54.45% |
-54.79% |
-55.26% |
-55.20% |
-53.35% |
-50.87% |
|
7.1 |
-46.16% |
-45.97% |
-46.02% |
-46.37% |
-47.05% |
-48.18% |
-49.75% |
-50.98% |
-49.77% |
-47.19% |
|
12.1 |
-36.46% |
-36.26% |
-36.43% |
-37.05% |
-38.20% |
-40.10% |
-42.72% |
-45.09% |
-44.22% |
-41.29% |
|
19.5 |
-25.49% |
-25.25% |
-25.51% |
-26.38% |
-27.98% |
-30.65% |
-34.36% |
-37.94% |
-37.45% |
-34.18% |
|
35.9 |
40.61% |
40.66% |
39.67% |
37.41% |
33.61% |
27.69% |
19.65% |
12.57% |
14.72% |
21.85% |
Table A.5.2. 2005 Carbon Monoxide Composite Emission Factors forMobile 5b
at Different Ambient Temperatures and Average Speeds
30% Decrease in Light-duty Vehicles VMT Fraction.
|
Speed(mph) |
0 |
10 |
20 |
30 |
40 |
50 |
60 |
70 |
80 |
90 |
|---|---|---|---|---|---|---|---|---|---|---|
|
Idle |
531.47 |
469.94 |
415.52 |
367.19 |
324.08 |
289.77 |
262.03 |
235.83 |
232.10 |
248.11 |
|
3.4 |
163.82 |
144.99 |
128.33 |
113.54 |
100.34 |
89.83 |
81.33 |
73.31 |
72.21 |
77.23 |
|
7.1 |
93.20 |
82.61 |
73.24 |
64.92 |
57.49 |
51.58 |
46.80 |
42.28 |
41.70 |
44.61 |
|
12.1 |
65.03 |
57.62 |
51.07 |
45.24 |
40.05 |
35.91 |
32.56 |
29.40 |
28.98 |
30.99 |
|
19.5 |
49.26 |
43.58 |
38.56 |
34.09 |
30.11 |
26.94 |
24.38 |
21.95 |
21.61 |
23.08 |
|
35.9 |
24.68 |
21.85 |
19.35 |
17.13 |
15.15 |
13.57 |
12.30 |
11.09 |
10.93 |
11.68 |
Table A.5.3. 2005 Carbon Monoxide Composite Emission Factors forMobile 6
at Different Ambient Temperatures and Average Speeds
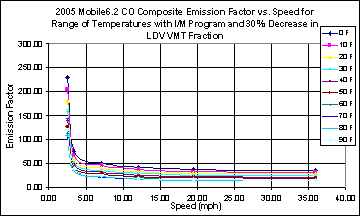
30% Decrease in Light-duty Vehicles VMT Fraction.
|
Speed(mph) |
0 |
10 |
20 |
30 |
40 |
50 |
60 |
70 |
80 |
90 |
|---|---|---|---|---|---|---|---|---|---|---|
|
Idle |
229.13 |
203.51 |
180.45 |
159.62 |
140.74 |
125.55 |
113.17 |
103.01 |
106.24 |
119.75 |
|
3.4 |
74.56 |
66.28 |
58.77 |
51.94 |
45.71 |
40.61 |
36.39 |
32.84 |
33.69 |
37.94 |
|
7.1 |
50.18 |
44.63 |
39.53 |
34.82 |
30.44 |
26.72 |
23.51 |
20.72 |
20.94 |
23.56 |
|
12.1 |
41.32 |
36.73 |
32.46 |
28.48 |
24.75 |
21.51 |
18.65 |
16.15 |
16.17 |
18.20 |
|
19.5 |
36.71 |
32.58 |
28.72 |
25.10 |
21.68 |
18.68 |
16.00 |
13.62 |
13.52 |
15.19 |
|
35.9 |
34.70 |
30.74 |
27.03 |
23.54 |
20.24 |
17.33 |
14.71 |
12.49 |
12.54 |
14.23 |
30% Decrease in Light-duty Vehicles VMT Fraction.
|
Speed(mph) |
0 |
10 |
20 |
30 |
40 |
50 |
60 |
70 |
80 |
90 |
|---|---|---|---|---|---|---|---|---|---|---|
|
Idle |
-79.65% |
-79.42% |
-79.26% |
-79.18% |
-79.20% |
-79.31% |
-79.48% |
-79.49% |
-78.71% |
-77.59% |
|
3.4 |
-78.17% |
-77.94% |
-77.82% |
-77.81% |
-77.93% |
-78.19% |
-78.58% |
-78.85% |
-78.18% |
-77.03% |
|
7.1 |
-73.04% |
-72.84% |
-72.82% |
-73.01% |
-73.46% |
-74.23% |
-75.32% |
-76.36% |
-75.98% |
-74.66% |
|
12.1 |
-67.77% |
-67.57% |
-67.63% |
-68.00% |
-68.74% |
-69.98% |
-71.71% |
-73.45% |
-73.29% |
-71.74% |
|
19.5 |
-62.22% |
-61.99% |
-62.10% |
-62.61% |
-63.61% |
-65.31% |
-67.67% |
-70.32% |
-70.83% |
-69.38% |
|
35.9 |
-25.28% |
-24.96% |
-25.35% |
-26.60% |
-28.87% |
-32.59% |
-37.71% |
-43.63% |
-45.38% |
-43.03% |
Table A.5.5. 2035 Carbon Monoxide Composite Emission Factors forMobile 5b
at Different Ambient Temperatures and Average Speeds
30% Decrease in Light-duty Vehicles VMT Fraction.
|
Speed(mph) |
0 |
10 |
20 |
30 |
40 |
50 |
60 |
70 |
80 |
90 |
|---|---|---|---|---|---|---|---|---|---|---|
|
Idle |
488.10 |
430.56 |
379.91 |
335.15 |
295.44 |
264.19 |
239.23 |
215.72 |
212.22 |
225.69 |
|
3.4 |
151.88 |
134.10 |
118.45 |
104.62 |
92.34 |
82.68 |
74.97 |
67.70 |
66.64 |
70.86 |
|
7.1 |
87.56 |
77.44 |
68.53 |
60.64 |
53.65 |
48.14 |
43.75 |
39.61 |
39.02 |
41.46 |
|
12.1 |
61.94 |
54.77 |
48.46 |
42.87 |
37.91 |
34.01 |
30.90 |
27.97 |
27.54 |
29.26 |
|
19.5 |
47.59 |
42.03 |
37.12 |
32.79 |
28.95 |
25.92 |
23.50 |
21.23 |
20.89 |
22.19 |
|
35.9 |
22.98 |
20.30 |
17.95 |
15.86 |
14.01 |
12.56 |
11.40 |
10.30 |
10.14 |
10.77 |
Table A.5.6. 2035 Carbon Monoxide Composite Emission Factors forMobile 6
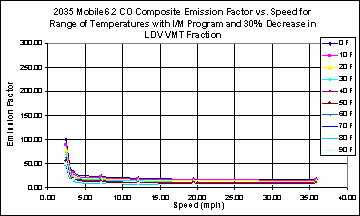
at Different Ambient Temperatures and Average Speeds
30% Decrease in Light-duty Vehicles VMT Fraction.
|
Speed(mph) |
0 |
10 |
20 |
30 |
40 |
50 |
60 |
70 |
80 |
90 |
|---|---|---|---|---|---|---|---|---|---|---|
|
Idle |
99.31 |
88.60 |
78.79 |
69.76 |
61.44 |
54.67 |
49.09 |
44.24 |
45.18 |
50.57 |
|
3.4 |
33.16 |
29.58 |
26.28 |
23.22 |
20.38 |
18.03 |
16.06 |
14.32 |
14.54 |
16.27 |
|
7.1 |
23.61 |
21.04 |
18.63 |
16.37 |
14.24 |
12.40 |
10.80 |
9.37 |
9.37 |
10.51 |
|
12.1 |
19.96 |
17.76 |
15.69 |
13.72 |
11.85 |
10.21 |
8.74 |
7.43 |
7.36 |
8.27 |
|
19.5 |
17.98 |
15.97 |
14.07 |
12.26 |
10.53 |
8.99 |
7.60 |
6.30 |
6.09 |
6.79 |
|
35.9 |
17.17 |
15.24 |
13.40 |
11.64 |
9.97 |
8.47 |
7.10 |
5.81 |
5.54 |
6.14 |
30% Increase in Light-duty Vehicles VMT Fraction.
|
Speed(mph) |
0 |
10 |
20 |
30 |
40 |
50 |
60 |
70 |
80 |
90 |
|---|---|---|---|---|---|---|---|---|---|---|
|
Idle |
-56.82% |
-56.69% |
-56.64% |
-56.68% |
-56.82% |
-57.07% |
-57.39% |
-56.63% |
-53.51% |
-50.00% |
|
3.4 |
-54.14% |
-54.00% |
-53.98% |
-54.11% |
-54.41% |
-54.92% |
-55.61% |
-55.32% |
-52.48% |
-48.97% |
|
7.1 |
-44.68% |
-44.53% |
-44.65% |
-45.09% |
-45.92% |
-47.31% |
-49.25% |
-50.47% |
-48.40% |
-44.76% |
|
12.1 |
-34.08% |
-33.93% |
-34.19% |
-34.96% |
-36.33% |
-38.61% |
-41.78% |
-44.35% |
-42.71% |
-38.67% |
|
19.5 |
-22.41% |
-22.27% |
-22.69% |
-23.79% |
-25.72% |
-28.92% |
-33.37% |
-37.34% |
-36.17% |
-31.78% |
|
35.9 |
52.64% |
52.66% |
51.48% |
48.86% |
44.48% |
37.46% |
27.82% |
19.86% |
23.52% |
33.28% |
Table A.6.2. 2005 Carbon Monoxide Composite Emission Factors forMobile 5b
at Different Ambient Temperatures and Average Speeds
30% Increase in Light-duty Vehicles VMT Fraction.
|
Speed(mph) |
0 |
10 |
20 |
30 |
40 |
50 |
60 |
70 |
80 |
90 |
|---|---|---|---|---|---|---|---|---|---|---|
|
Idle |
512.90 |
453.52 |
400.83 |
353.90 |
311.92 |
278.65 |
251.89 |
226.51 |
222.74 |
237.41 |
|
3.4 |
157.22 |
139.07 |
122.96 |
108.62 |
95.78 |
85.61 |
77.43 |
69.67 |
68.53 |
73.06 |
|
7.1 |
88.15 |
78.02 |
69.03 |
61.02 |
53.86 |
48.18 |
43.61 |
39.28 |
38.66 |
41.22 |
|
12.1 |
61.42 |
54.36 |
48.08 |
42.50 |
37.50 |
33.54 |
30.35 |
27.33 |
26.89 |
28.67 |
|
19.5 |
46.79 |
41.38 |
36.58 |
32.30 |
28.48 |
25.45 |
23.01 |
20.70 |
20.35 |
21.68 |
|
35.9 |
22.70 |
20.08 |
17.76 |
15.69 |
13.84 |
12.38 |
11.20 |
10.08 |
9.91 |
10.57 |
Table A.6.3. 2005 Carbon Monoxide Composite Emission Factors forMobile 6
at Different Ambient Temperatures and Average Speeds
30% Increase in Light-duty Vehicles VMT Fraction.
|
Speed(mph) |
0 |
10 |
20 |
30 |
40 |
50 |
60 |
70 |
80 |
90 |
|---|---|---|---|---|---|---|---|---|---|---|
|
Idle |
221.48 |
196.43 |
173.82 |
153.32 |
134.68 |
119.64 |
107.33 |
98.24 |
103.55 |
118.72 |
|
3.4 |
72.10 |
63.97 |
56.58 |
49.84 |
43.67 |
38.60 |
34.37 |
31.13 |
32.56 |
37.28 |
|
7.1 |
48.76 |
43.28 |
38.21 |
33.51 |
29.13 |
25.39 |
22.13 |
19.46 |
19.95 |
22.77 |
|
12.1 |
40.49 |
35.91 |
31.64 |
27.64 |
23.88 |
20.59 |
17.67 |
15.21 |
15.41 |
17.58 |
|
19.5 |
36.31 |
32.17 |
28.28 |
24.62 |
21.15 |
18.09 |
15.33 |
12.97 |
12.99 |
14.79 |
|
35.9 |
34.65 |
30.65 |
26.90 |
23.36 |
20.00 |
17.01 |
14.31 |
12.08 |
12.25 |
14.08 |
30% Increase in Light-duty Vehicles VMT Fraction.
|
Speed(mph) |
0 |
10 |
20 |
30 |
40 |
50 |
60 |
70 |
80 |
90 |
|---|---|---|---|---|---|---|---|---|---|---|
|
Idle |
-79.28% |
-79.12% |
-79.03% |
-79.04% |
-79.15% |
-79.39% |
-79.73% |
-79.83% |
-78.95% |
-77.66% |
|
3.4 |
-77.55% |
-77.39% |
-77.33% |
-77.40% |
-77.63% |
-78.03% |
-78.61% |
-79.00% |
-78.27% |
-76.95% |
|
7.1 |
-71.64% |
-71.49% |
-71.54% |
-71.84% |
-72.42% |
-73.41% |
-74.79% |
-76.10% |
-75.77% |
-74.32% |
|
12.1 |
-65.71% |
-65.58% |
-65.74% |
-66.25% |
-67.18% |
-68.73% |
-70.87% |
-73.05% |
-73.08% |
-71.44% |
|
19.5 |
-59.62% |
-59.50% |
-59.75% |
-60.47% |
-61.75% |
-63.85% |
-66.76% |
-70.01% |
-70.85% |
-69.38% |
|
35.9 |
-17.21% |
-17.07% |
-17.74% |
-19.41% |
-22.30% |
-26.96% |
-33.36% |
-40.74% |
-43.25% |
-40.77% |
Table A.6.5. 2035 Carbon Monoxide Composite Emission Factors forMobile 5b
at Different Ambient Temperatures and Average Speeds
30% Increase in Light-duty Vehicles VMT Fraction.
|
Speed(mph) |
0 |
10 |
20 |
30 |
40 |
50 |
60 |
70 |
80 |
90 |
|---|---|---|---|---|---|---|---|---|---|---|
|
Idle |
477.09 |
421.58 |
372.55 |
329.08 |
290.40 |
260.12 |
236.09 |
213.39 |
210.32 |
223.62 |
|
3.4 |
147.26 |
130.18 |
115.09 |
101.71 |
89.80 |
80.49 |
73.09 |
66.11 |
65.17 |
69.28 |
|
7.1 |
83.54 |
73.91 |
65.39 |
57.84 |
51.12 |
45.86 |
41.69 |
37.74 |
37.22 |
39.56 |
|
12.1 |
58.85 |
52.06 |
46.05 |
40.73 |
36.00 |
32.29 |
29.35 |
26.57 |
26.20 |
27.84 |
|
19.5 |
45.31 |
40.06 |
35.42 |
31.30 |
27.64 |
24.77 |
22.50 |
20.35 |
20.05 |
21.31 |
|
35.9 |
21.21 |
18.75 |
16.58 |
14.66 |
12.95 |
11.61 |
10.55 |
9.54 |
9.41 |
10.00 |
Table A.6.6. 2035 Carbon Monoxide Composite Emission Factors forMobile 6
at Different Ambient Temperatures and Average Speeds
30% Increase in Light-duty Vehicles VMT Fraction.
|
Speed(mph) |
0 |
10 |
20 |
30 |
40 |
50 |
60 |
70 |
80 |
90 |
|---|---|---|---|---|---|---|---|---|---|---|
|
Idle |
98.85 |
88.05 |
78.13 |
68.99 |
60.55 |
53.62 |
47.87 |
43.05 |
44.28 |
49.95 |
|
3.4 |
33.06 |
29.44 |
26.09 |
22.98 |
20.09 |
17.68 |
15.63 |
13.88 |
14.16 |
15.97 |
|
7.1 |
23.70 |
21.07 |
18.61 |
16.29 |
14.10 |
12.19 |
10.51 |
9.02 |
9.02 |
10.16 |
|
12.1 |
20.18 |
17.92 |
15.78 |
13.75 |
11.81 |
10.10 |
8.55 |
7.16 |
7.05 |
7.95 |
|
19.5 |
18.30 |
16.22 |
14.25 |
12.37 |
10.57 |
8.95 |
7.48 |
6.10 |
5.85 |
6.53 |
|
35.9 |
17.56 |
15.55 |
13.64 |
11.81 |
10.06 |
8.48 |
7.03 |
5.66 |
5.34 |
5.92 |
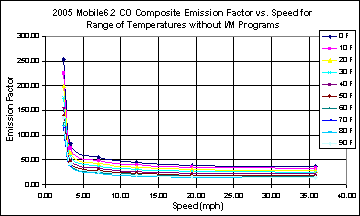
Base Case with I/M Program
Figure A.1.2. 2005 Carbon Monoxide Composite Emission Factor (g/mi) forMobile 5b
at Different Ambient Temperatures and Average Speeds
Base Case with I/M Program
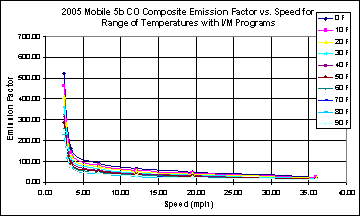
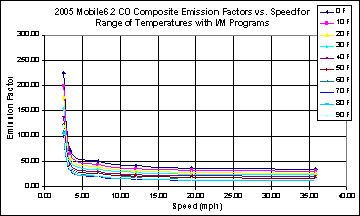
Figure A.1.3. 2005 Carbon Monoxide Composite Emission Factor forMobile 6 (g/mi)
at Different Ambient Temperatures and Average Speeds. Base Case with I/M Program
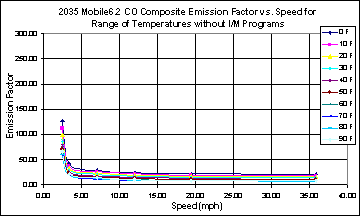
Base Case with I/M Program.=
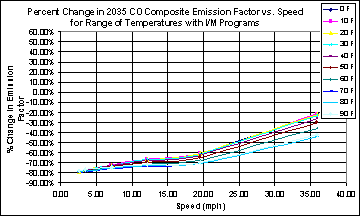
Figure A.1.5. 2035 Carbon Monoxide Composite Emission Factor (g/mi) forMobile 5b
at Different Ambient Temperatures and Average Speeds
Base Case with I/M Program
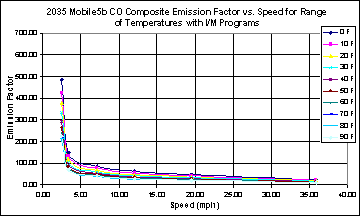
Figure A.1.6. 2035 Carbon Monoxide Composite Emission Factor (g/mi) forMobile 6
at Different Ambient Temperatures and Average Speeds
Base Case with I/MProgram
Without I/M Program.
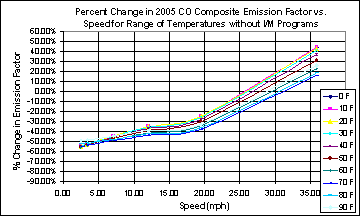
Figure A.2.2. 2005 Carbon Monoxide Composite Emission Factor (g/mi) forMobile 5b
at Different Ambient Temperatures and Average Speeds
Without I/M Program.
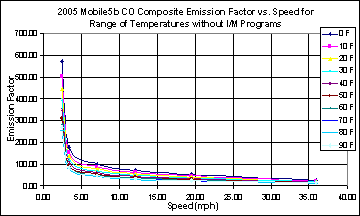
Figure A.2.3. 2005 Carbon Monoxide Composite Emission Factor (g/mi) forMobile 6
at Different Ambient Temperatures and Average Speeds
Without I/M Program.
Without /M Program
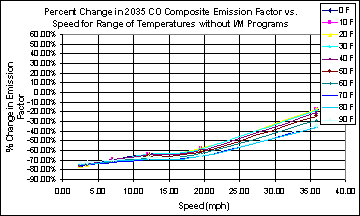
Figure A.2.5. 2035 Carbon Monoxide Composite Emission Factor (g/mi) forMobile 5b
at Different Ambient Temperatures and Average Speeds
Without I/M Program.
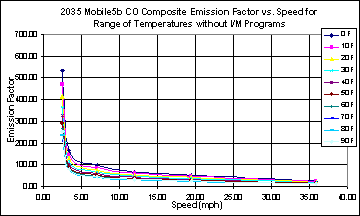
Figure A.2.6. 2035 Carbon Monoxide Composite Emission Factor (g/mi) forMobile 6
at Different Ambient Temperatures and Average Speeds
Without I/M Program.
3 Years Newer Average Age Fleet Distribution
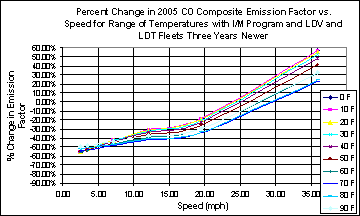
Figure A.3.2. 2005 Carbon Monoxide Composite Emission Factor (g/mi) forMobile 5b
at Different Ambient Temperatures and Average Speeds
3 Years Newer Average Age Fleet
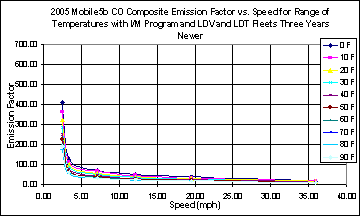
Figure A.3.3. 2005 Carbon Monoxide Composite Emission Factor (g/mi) forMobile 6
at Different Ambient Temperatures and Average Speeds
3 Years Newer Average Age Fleet
3 Years Newer Average Age Fleet.
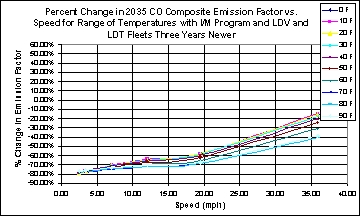
Figure A.3.5. 2035 Carbon Monoxide Composite Emission Factor (g/mi) forMobile 5b
at Different Ambient Temperatures and Average Speeds
3 Years Newer Average Age Fleet.
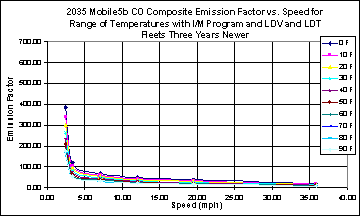
Figure A.3.6. 2035 Carbon Monoxide Composite Emission Factor (g/mi) forMobile 6
at Different Ambient Temperatures and Average Speeds
3 Years Newer Average Age Fleet.
3 Years Older Average Age Fleet.
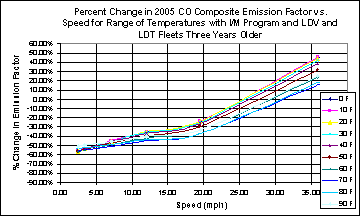
Figure A.4.2. 2005 Carbon Monoxide Composite Emission Factor (g/mi) forMobile 5b
at Different Ambient Temperatures and Average Speeds
3 Years Older Average Age Fleet.
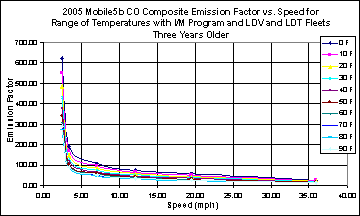
Figure A.4.3. 2005 Carbon Monoxide Composite Emission Factor (g/mi) forMobile 6
at Different Ambient Temperatures and Average Speeds
3 Years Older Average Age Fleet.
3 Years Older Average Age Fleet.
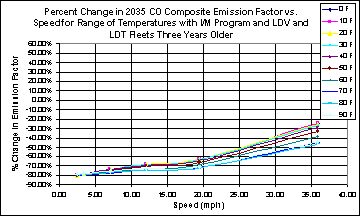
Figure A.4.5. 2035 Carbon Monoxide Composite Emission Factor (g/mi) forMobile 5b
at Different Ambient Temperatures and Average Speeds
3 Years Older Average Age Fleet..
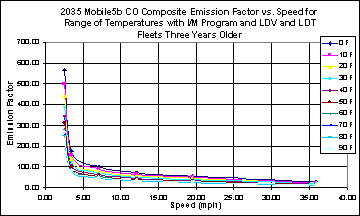
Figure A.4.6. 2035 Carbon Monoxide Composite Emission Factor (g/mi) forMobile 6
at Different Ambient Temperatures and Average Speeds
3 Years Older Average Age Fleet.
30% Decrease in LDV VMT Fraction.
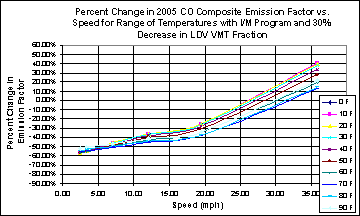
Figure A.5.2. 2005 Carbon Monoxide Composite Emission Factor (g/mi) forMobile 5b
at Different Ambient Temperatures and Average Speeds
30% Decrease in LDV VMT Fraction.
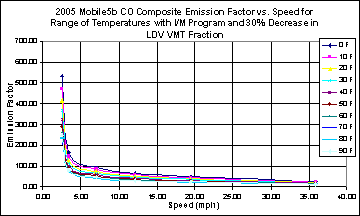
Figure A.5.3. 2005 Carbon Monoxide Composite Emission Factor (g/mi) forMobile 6
at Different Ambient Temperatures and Average Speeds
30% Decrease in LDV VMT Fraction.
30% Decrease in LDV VMT Fraction.
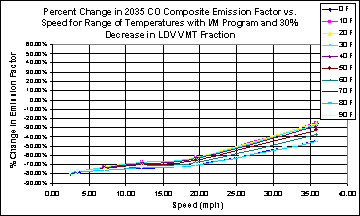
Figure A.5.5. 2035 Carbon Monoxide Composite Emission Factor (g/mi) forMobile 5b
at Different Ambient Temperatures and Average Speeds
30% Decrease in LDV VMT Fraction.
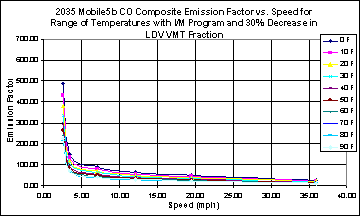
Figure A.5.6. 2035 Carbon Monoxide Composite Emission Factor (g/mi) forMobile 6
at Different Ambient Temperatures and Average Speeds
30% Decrease in LDV VMT Fraction.
30% Increase in LDV VMT Fraction.
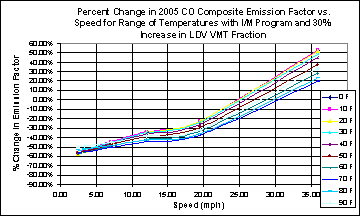
Figure A.6.2. 2005 Carbon Monoxide Composite Emission Factor (g/mi) forMobile 5b
at Different Ambient Temperatures and Average Speeds
30% Increase in LDV VMT Fraction.
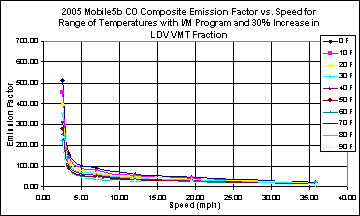
Figure A.6.3. 2005 Carbon Monoxide Composite Emission Factor (g/mi) forMobile 6
at Different Ambient Temperatures and Average Speeds
30% Increase in LDV VMT Fraction.
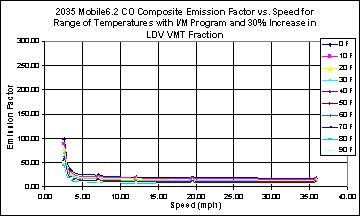
30% Increase in LDV VMT Fraction.
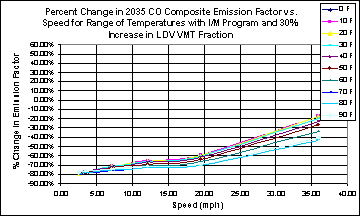
Figure A.6.5. 2035 Carbon Monoxide Composite Emission Factor (g/mi) forMobile 5b
at Different Ambient Temperatures and Average Speeds
30% Increase in LDV VMT Fraction.
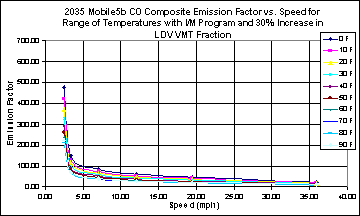
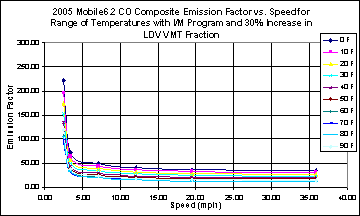
Figure A.6.6. 2035 Carbon Monoxide Composite Emission Factor (g/mi) forMobile 6
at Different Ambient Temperatures and Average Speeds
30% Increase in LDV VMT Fraction.