

The Implementation of Full Depth UHPC Waffle Bridge Deck Panels Final Report May 2013
2. WORK COMPLETED IN PHASE 1
This chapter summarizes the progress that was made in Phase 1 of the project. As mentioned previously, the objectives of Phase 1 were to prototype and model the demonstration bridge construction planned for Phase 2. These objectives were met by producing two prototype UHPC waffle deck panels based on preliminary design work completed by the Iowa DOT, modeling the section of the demonstration bridge that would undergo testing in Phase 1 using a finite element analysis (FEA) to predict the response of the system, and load testing the prototype waffle slabs to confirm the design assumptions and FEA validity.
Waffle Panel Design and Fabrication
The preliminary design of the waffle slab was completed in late August 2009, and shop drawings were completed by early September 2009. The project team consulted on the fabrication process and aspects of the design relating to ease of production and requirements for UHPC joint fill. The prototype panels were 8 feet wide by 9 feet, 9 inches long, with two layers of mild reinforcing in each rib and dowel bars extending out of the slab at the transverse panel-to-panel joint locations (see figure 1). The prototype panel modeled one girder-to-girder span along the length of the bridge. It was determined that two slabs would be necessary to test the transverse panel-to-panel joint.
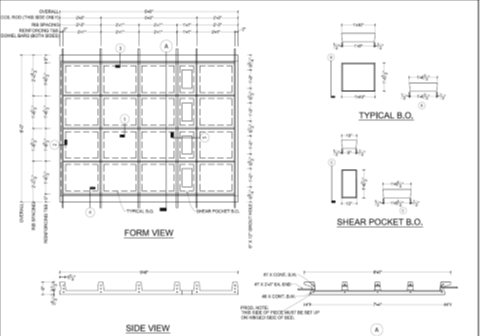
Figure 1. Diagram. Shop drawing of prototype panel
The two prototype panels were produced in September 2009 at the Coreslab Structures plant in LaPlatte, NE. The panels were cast using a displacement technique where the form was first partially filled with fluid UHPC. Then the voids, which make the ribs of the panel, were forced downward into the UHPC to displace the material, creating the shape of the panel. This technique was used to allow for the removal of the voids once the UHPC reached initial set, which is necessary to allow for unrestrained shrinkage and to maintain the random orientation and consistent meshing of the fiber reinforcement. An additional benefit of casting the panels in an inverted orientation is that the final driving surface will be cast into the panels through the use of a form liner. By eliminating the application of a wearing surface placed in the field, the cost of the system is further reduced, while the durability is increased. Figures 2 through 6 depict the casting and production sequence.
Figure 2 shows the reinforcing layout of the first casting. Uncoated reinforcing was used because the UHPC is effectively impermeable, eliminating the need for epoxy coated, galvanized, or stainless steel reinforcing to resist corrosion. The prototype panel formwork was made of wood to provide an inexpensive and temporary form. This strategy was employed because the design was preliminary, and changes to the rib size, spacing, and joint profiles were possible between the prototype and demonstration panels. The final formwork will be made of steel and adjustable for various panel configurations. In addition to the standard reinforcing, several strain gauges were cast into the panels to monitor the internal responses of the UHPC and reinforcing.
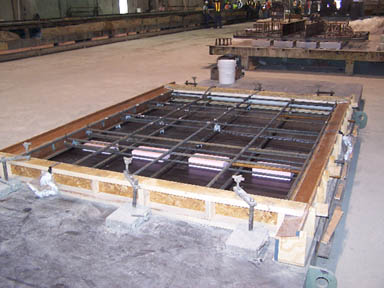
Figure 2. Photo. Prototype panel form setup
Figure 3 shows the placing of the UHPC into the form. The UHPC was placed with a specially designed bucket that is the same width as the form, which aligns the steel fibers in the UHPC in the longest direction of the panel. This alignment helps to increase the flexural strength of the panels. The bucket was moved along the length of the form and kept behind the leading edge of the flow to eliminate any discontinuity in the fiber orientation. The form was filled to a predetermined level equal to the required volume of the panel, and then the voids were set as an assembly (see figure 4). Each of the prototype panels required approximately 1 cubic yard of UHPC.
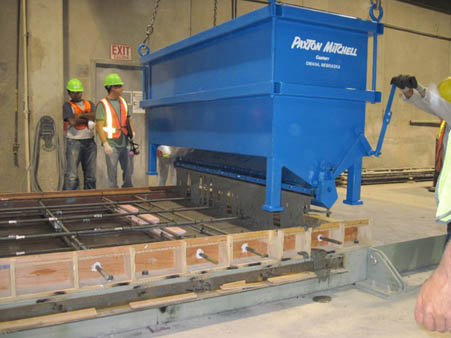
Figure 3. Photo. Casting
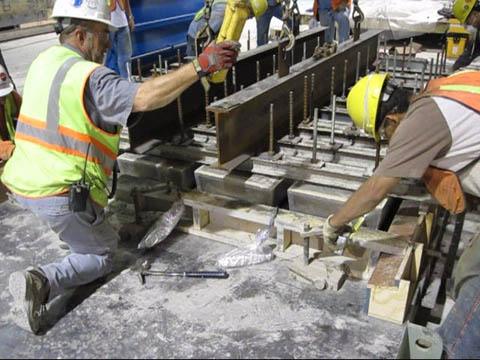
Figure 4. Photo. Placing the voids as they are lowered into position
By placing the voids as an assembly, the panels can be cast substantially faster and with more precision. The UHPC is displaced by the voids as they are lowered into position to create the final shape of the piece. Placing the voids prior to the casting would create a cold joint effect at the corners of the voids because, as the UHPC flows into itself around the corners of the voids, the fibers will not cross the intersection of the two flows of UHPC.
As mentioned previously, this casting method also allows the voids to be removed after the initial set of the UHPC, which allows the UHPC to shrink without inducing internal stresses. This is important because the UHPC will reach initial set within 12 to 14 hours but will not reach release strength until approximately 40 hours after casting. Damage from shrinkage can occur during this time if the appropriate precautions are not taken. Figure 5 shows the panel after the side forms and voids were removed.
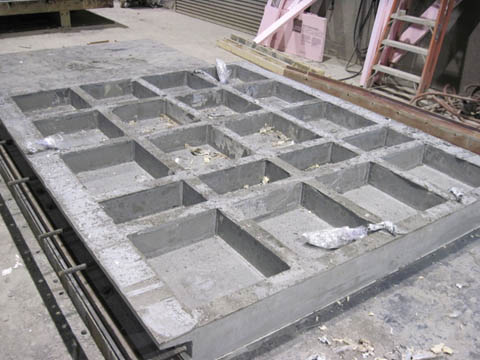
Figure 5. Photo. Formwork removed
After the panels reached the required 14,000 psi release strength, they were stripped from the form. The panels were lifted into the vertical position by the casting bed, rotated 180 degrees about a vertical axis, and lowered back to the horizontal position in the proper orientation by the casting bed. This technique was used to reduce the handling stresses on the panels. Even though the concrete strength is very high at release, the sections from which the panels are rotated are very thin, limiting the amount of stress that can be taken without cracking. The critical section is at the very thin area where the toe of the transverse joint edge and the longitudinal rib intersect. By rotating the piece with the casting bed, the issue of handling stresses is eliminated.
The panels were moved to the curing area and exposed to an accelerated steam curing cycle for 48 hours at 195 °F, as specified for maximum strength and durability. Before steam curing the panels measured approximately 15,000 psi compressive strength. A test cylinder was broken before the steam was turned off to verify that the panels had cured correctly, and the compressive strength of the UHPC at that time was 29,800 psi, exceeding the required design strength of 24,000 psi. After curing was complete, the panels were loaded on a truck and transported to Iowa State University to be load tested.
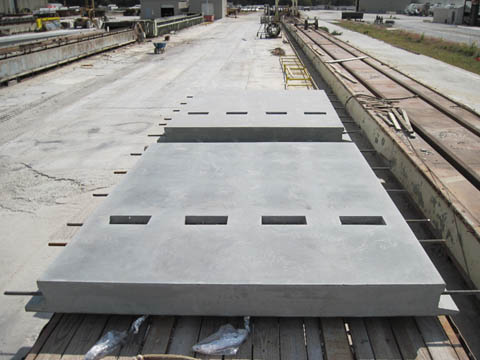
Figure 6. Photo. Completed prototype panels
Laboratory Load Testing
Laboratory load testing included testing the panels and the transverse joint in service, fatigue, and ultimate loading scenarios, along with investigating friction properties of textures for the driving surface. Table 1 shows the structural test protocols and sequence. The load magnitudes for testing were established using the American Association of State Highway and Transportation Officials (AASHTO) 16-kip service level truck wheel load with a factor of 1.33 for the panel and 1.75 for the joint to account for impact from moving loads.
To represent field conditions as closely as possible, it was determined that a prestressed concrete beam was needed to support the panels during testing. A beam similar to the one required for the demonstration bridge was used.
A UHPC joint casting was required and completed in the laboratory. The transverse joint between the panels, the shear pockets, and the longitudinal area along the length of the support beam were cast with Ductal UHPC in late November 2009. The laboratory joint fill followed the same processes and used the same equipment as planned for the full scale demonstration bridge construction.
| Test Number | Test Description | Loading Location | Maximum Load |
|---|---|---|---|
| 1 | Service load test panel-2 | Center of the panel | 1.33a x 16kips =21.3 kips |
| 2 | Service load test on transverse joint | Center of the joint | 1.75b x 16 kips = 28 kips |
| 3 | Fatigue test on the transverse Joint | Center of the joint | 28 kips (1 million cycles) |
| 4 | Ultimate load test of transverse joint | Center of the joint | 48 kips |
| 5 | Fatigue test on the panel-1 | Center of the panel | 21.3 kips (1 million cycles) |
| 6 | Ultimate load test of the panel | Center of the panel | 40 kips |
a, b – dynamic allowance factors from AASHTO table 3.6.2.1-1 (2)
Strength and Serviceability Testing
An FEA model of the completed test setup was created, and several runs were made to locate the worst case loading scenarios before the physical testing began. This helped limit the amount of physical testing required and decrease the amount of time required for the testing phase of the project. It was verified upon completion of the testing that the model closely represented the results of the physical tests and will enable future projects incorporating UHPC to be designed and investigated more efficiently and with less physical testing.
The results of the testing were promising. In summary, the 21.3-kip load placed on the panel caused two hairline cracks in the rib below the loading location, and the 28-kip load applied to the joint caused a barely visible crack to form on the bottom of the joint, as predicted by the FEA model. Fatigue loading applied for the specified 1,000,000 cycles did not have any noticeable effect on the strength or durability of the panels.
Surface Texture and Skid Resistance Testing
Five commercially available form liners were selected as possible driving surface textures, and 12-inch by 12-inch samples of the textures were cast in UHPC. The samples were tested according to ASTM E303(3), Standard Method for Measuring Surface Friction Properties, and the Transport and Road Research Laboratory (TRRL, formerly the Road Research Laboratory) Standard Sand Patch Test for Measuring Surface Texture Depth (4). Table 2 summarizes the results of both tests.
Any texture depth greater than 1/64 inch for the Standard Sand Patch Test is considered "open," according to the TRRL. An open sample indicates the texture can be worn substantially from its current condition before becoming smooth, which means it has good characteristics for use as a long-term wearing surface. The testing showed all samples met the criteria to be classified as open.
| Sample No. | Texture (Source) | Sand Patch Dia. (in.) | Average Dia. (in.) | Texture Depth (in.) | Texture Characterization |
|---|---|---|---|---|---|
| 1 | 2/61 Thames (Rekli) | 9.45, 8.66, 8.46, 8.86 | 8.86 | 0.05 | Open |
| 2 | 2/102 Parana (Rekli) | 7.87, 7.68, 7.87, 8.07 | 7.87 | 0.04 | Open |
| 3 | Broom Finish (Architectural Polymers) | 10.04, 9.25, 9.65, 9.06 | 9.50 | 0.06 | Open |
| 4 | Heavy Broom (Architectural Polymers) | 6.30, 6.30, 6.10, 5.90 | 6.15 | 0.10 | Open |
| 5 | Anti-Skid (Fitzgerald Formliners) |
8.66, 8.86, 9.06, 9.06 | 8.87 | 0.05 | Open |
The skid resistance value (SRV) was measured using a British Pendulum Tester (BPT), according to ASTM E303. The BPT is a dynamic pendulum impact-type tester used to measure the energy loss when a rubber slider edge is propelled over a test surface. The test was performed on the same set of sample textures as the Sand Patch Test, and four SRV tests were performed on each sample. The SRV test setup is shown in figure 7, and a summary of the SRV tests is presented in table 3.
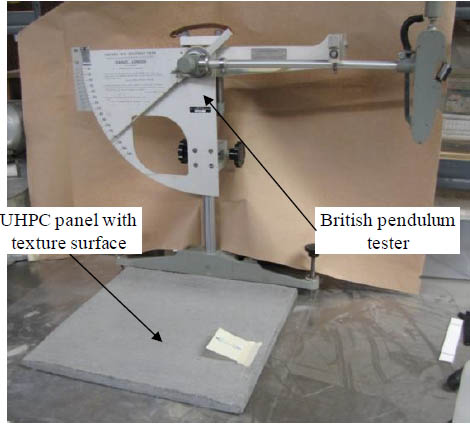
Photo. SRV testing setup
| Sample No. | Texture (Source) | Skid Resistance Value (BPN) | Average (BPN) |
|---|---|---|---|
| 1 | 2/61 Thames (Rekli) | 87, 88, 88, 88 | 87.75 |
| 2 | 2/102 Parana (Rekli) | 96, 96, 96, 96 | 96 |
| 3 | Broom Finish (Architectural Polymers) |
72, 70, 70, 70 | 70.5 |
| 4 | Heavy Broom (Architectural Polymers) | 80, 81, 80, 81 | 80.5 |
| 5 | Anti-Skid (Fitzgerald Formliners) |
80, 80, 80, 81 | 80.25 |
BPN = British Pendulum Number
The suggested minimum SRV for difficult sites is 65, as determined by the TRRL, so all the tested textures are excellent choices for all possible scenarios and roadway types. Based on the information gathered from these tests, sample 2 was chosen due to its extremely high SRV and good surface texture characteristics.
Conclusions
The researchers developed a preliminary design that is anticipated to perform well in service.
Casting was successful, and the prototype panels were produced without any major difficulties.
An FEA was developed that accurately represented the material and the overall structural performance.
Only minor cracking was observed during testing, and this amount of cracking is not anticipated to cause any long-term durability issues.
A suitable wearing surface was selected.
In general, the prototype panels performed very well and appeared to be more than capable of holding up to the rigors of use on a public highway. Additional information regarding the technical aspects of the strength and serviceability testing and associated results can be found in separate reports. (5,6) .