


![]()
![]()
![]()
![]()
Brien Desilets
Managing Director,
Claret Consulting

Patrick DeCorla -Souza
P3 Program Manager,
Federal Highway
Administration
This presentation will introduce Chapters 1- 4.
Infrastructure Delivery Options
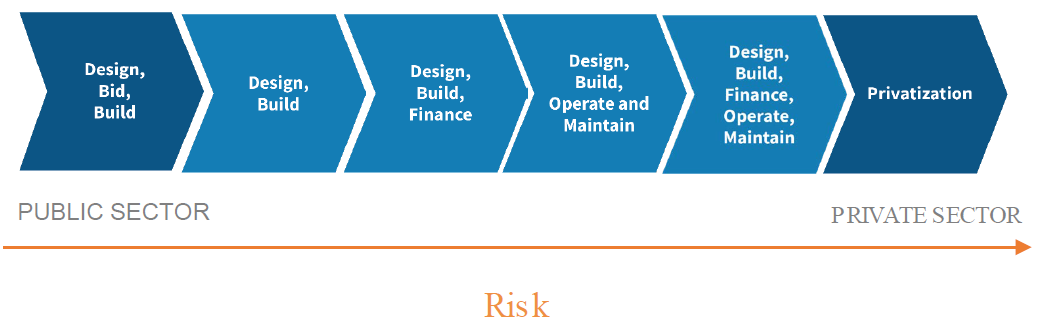
View larger version of Infrastructure Delivery Options flow chart
Design, Bid, Build » Design, Build » Design, Build, Finance » Design, Build, Operate and Maintain » Design, Build, Finance, Operate, Maintain » Privitization
(Moves from Public Sector to Private Sector with risk increasing towards Private Sector)
Degree of ownership, development integration, risk
transfer and extent of private financing
| Design-Bid-Build | P3 |
|---|---|
| Public sector takes on most risks (except construction) | Risks shared between public and private sectors |
| Public financing (mostly) | Private financing (mostly) |
| Lowest bidder | Best value for least net present cost |
| Operations and Maintenance (O&M) and ongoing rehabilitation (if any) carried out by public agency (or under fee for prescribed services) once constructed | O&M carried out by private sector; ongoing rehabilitation overseen by public sector stewardship of P3 |
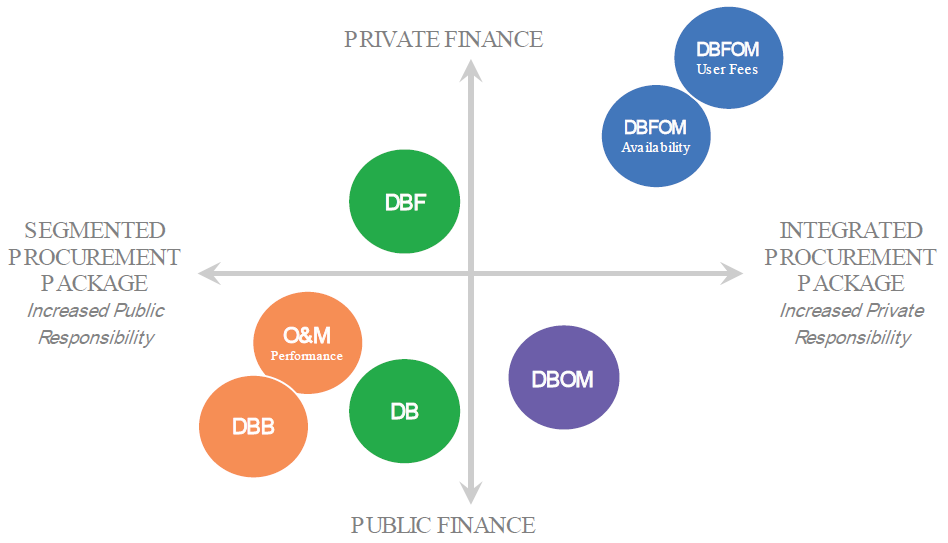
View larger version of P3 Delivery Models graph
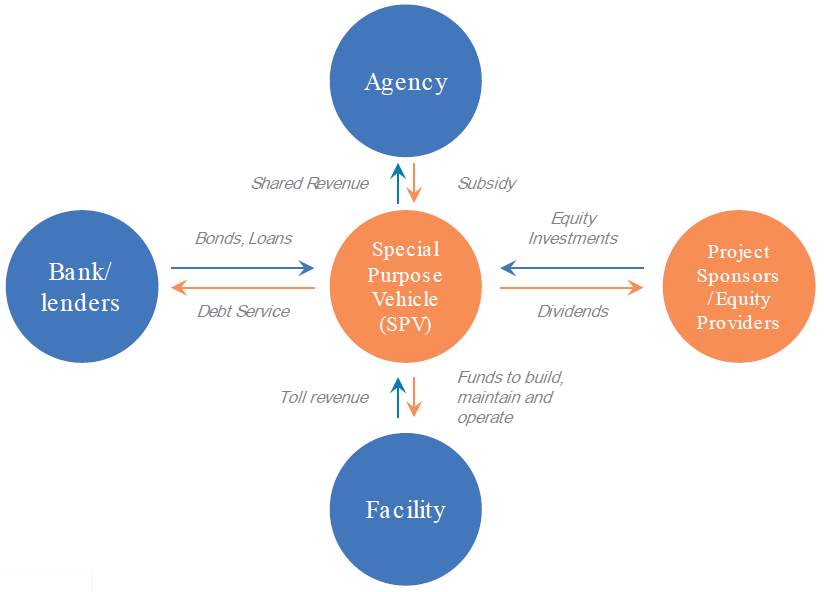
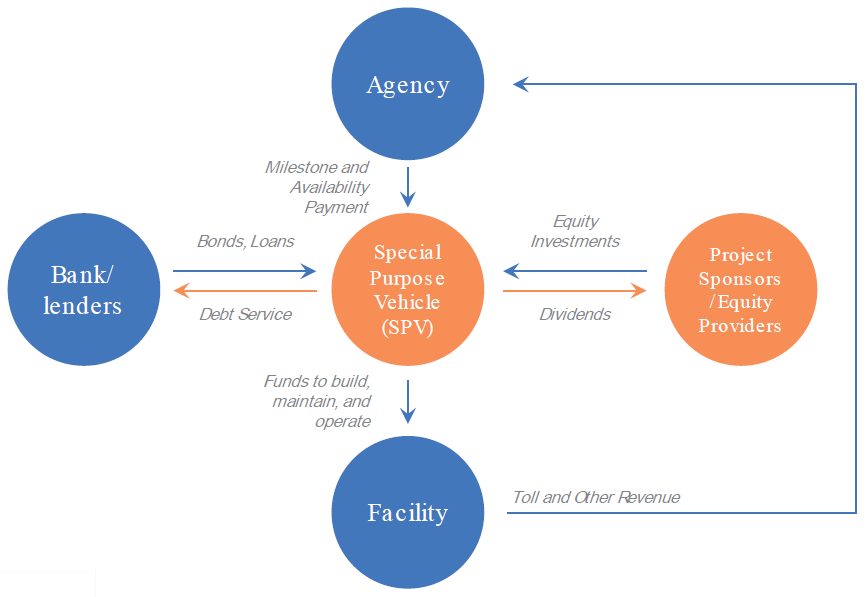
View larger version of Typical Toll Concessions P3 Structure graph
View larger version of Typical Availability P3 Structure graph
Submit a question using the chat box
| Public Sector | SPV | Subcontractor | |
|---|---|---|---|
| Development Phase | |||
| Planning & environmental process | ✔ | ||
| Political will | ✔ | ||
| Regulatory | ✔ | ||
| Site | |||
| Permitting | ✔ | ✔ | ✔ |
| Procurement | ✔ | ✔ | |
| Financing | ✔ | ||
| Construction Phase | |||
| Engineering & construction | ✔ | ||
| Changes in market conditions | ✔ | ||
| Operation Phase | |||
| Traffic | ✔ | ||
| Competing facilities | ✔ | ||
| Operations and maintenance | ✔ | ||
| Appropriation | ✔ | ✔ | |
| Financial default risk to public agency | ✔ | ||
| Refinancing | ✔ | ||
| Political | ✔ | ||
| Regulatory | ✔ | ||
| Handback | ✔ | ||
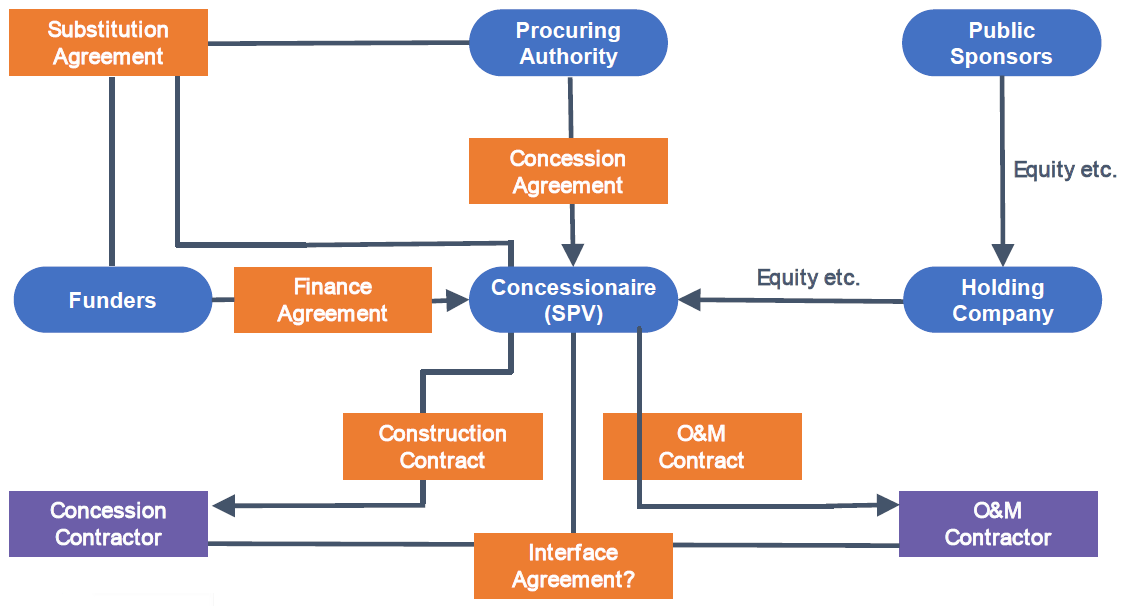
View larger version of SPV Arrangements flow chart
Submit a question using the chat box
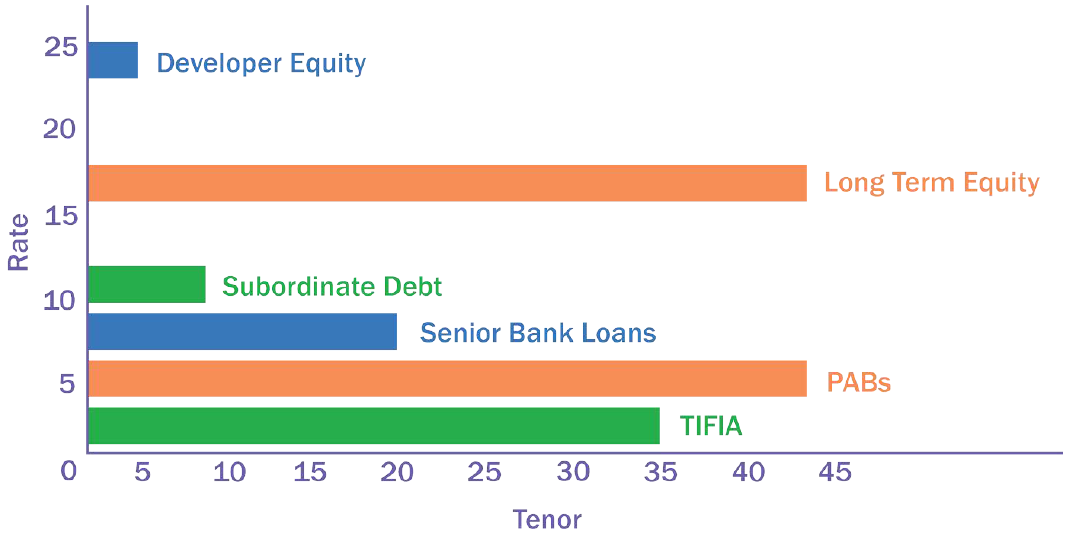
View larger version of Sources of Financing chart
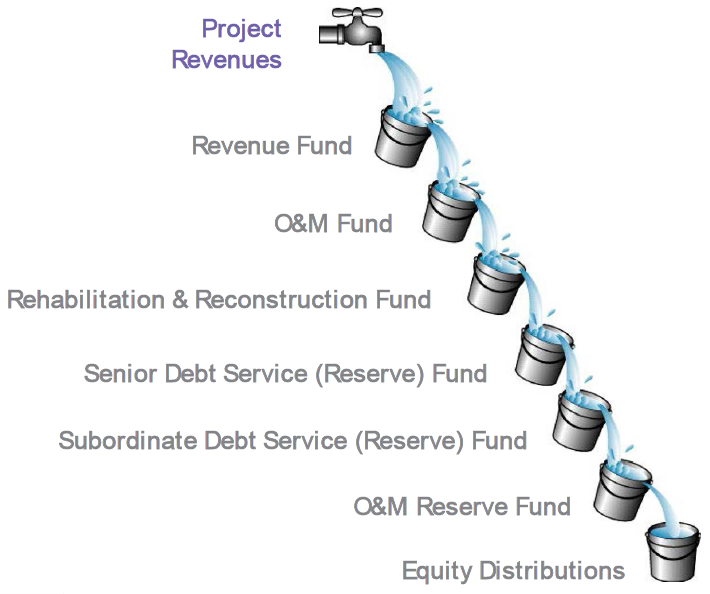
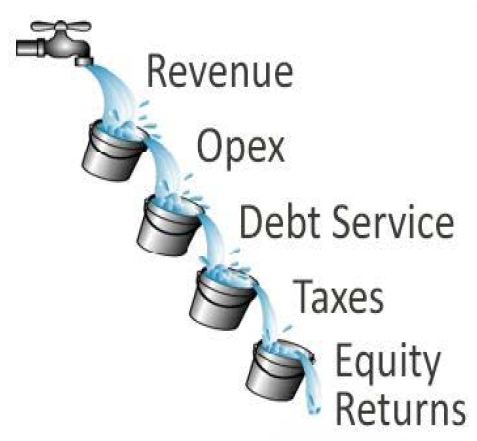
Text of Typical Cash Flow Waterfall diagram

Where DSCR = Cash Available for Debt Service (CADS) divided by debt service (principal + interest)
| Series |
Maturity |
Principal (US$) |
Coupon |
Yield* |
|---|---|---|---|---|
| A | 1/1/2022 |
670,000 | 4.25% | 4.45% |
| B | 1/1/2023 | 685,000 | 4.50% | 4.60% |
| C | 7/1/2023 | 1,775,000 | 5.00% | 4.60% |
| D | 1/1/2024 | 1,760,000 | 5.00% | 4.75% |
| E | 7/1/2024 | 2,900,000 | 5.00% | 4.75% |
| F | 1/1/2025 | 3,080,000 | 4.75% | 4.90% |
| G | 7/1/2025 | 4,875,000 | 5.00% | 4.90% |
| H | 1/1/2026 | 5,290,000 | 5.00% | 4.95% |
| I | 7/1/2026 | 6,700,000 |
5.00% | 4.95% |
| J | 1/1/2027 | 6,150,000 | 5.00% | 5.00% |
| K | 7/1/2027 | 8,480,000 | 5.00% | 5.00% |
| L | 1/1/2032 | 91,795,000 | 5.25% | 5.25% |
| M | 1/1/2037 | 209,185,000 | 6.00% | 5.32% |
| N | 1/1/2042 | 320,405,000 | 5.50% | 5.50% |
| *The rate is the rate offered to bond buyers. When bonds are sold, they often do not sell at face value but at either a premium or a discount. The yield indicates the actual return offered to bondholders based on the actual price paid. Source: Midtown Tunnel Official Statement available from MSRB EMMA database, CUSIP 928104LK2. | ||||
Advantages
Disadvantages
Transportation Infrastructure Finance and Innovation Act (TIFIA) also provides a form of subordinate debt
| Project | Amount | Rate (%) | Term (years) |
|---|---|---|---|
| I-95 HOT Lanes | $300.0 | 2.76 | 35.0 |
| Presidio Parkway Tranche A | $90.0 | 0.46 | 3.5 |
| Presidio Parkway Tranche B | $60.0 | 2.71 | 28.0 |
| Midtown Tunnel | $422.0 |
3.17 | 44.0 |
| LBJ-635 Corridor | $850.0 | 4.22 | 40.5 |
| North Tarrant Express | $650.0 | 4.51 | 35.0 |
| Port of Miami Tunnel | $341.0 | 4.31 | 35.0 |
| I-595 |
$603.0 | 3.63 | 35.0 |
| SH-130 Segment V-VI | $430.0 | 4.45 | 35.0 |
| I-495 HOT Lanes | $589.0 | 4.40 | 40.0 |
| TIFIA has been involved in almost all major US greenfield P3s and approximately a third of the projects in the TIFIA portfolio are P3s | |||
Submit a question using the chat box
No investor guarantee on returns and no investment recourse
| Investor | Strategy/Objective | Project Transaction Example |
|---|---|---|
| Subcontractors engaging in Design Build and Operations & Maintenance | Broadening participation and potential financial returns over the project term | Midtown Tunnel: Skanska is a 50% equity investor in the SPV and member of the DB contractor team |
| Financial institutions | Provide development capital and typically exit once the project is up and running or even before | Denver Fastracks Eagle P3: Macquarie sold its stake after the project reached financial close. |
| Pension funds and insurance companies | Seek long-term return; they prefer a larger share of the concession's cash flows | Florida I-595: TIAA-CREF acquired a 50% stake when the project neared substantial completion |
| Project/Investor | Amount ($millions) |
|---|---|
| East End Crossing | |
| Walsh Investors | $26.00 |
| VINCI Concessions SAS | $26.00 |
| Bilfinger Berger | $26.00 |
| I-95 HOT Lanes | |
| Fluor | $24.20 |
| DRIVe USA | $217.80 |
| Presidio Parkway | |
| Hochtief | $23.00 |
| Meridiam | $23.00 |
| Midtown Tunnel | |
| Skanska | $99.45 |
| Macquarie | $121.55 |
| LBJ-635 Corridor | |
| Cintra | $364.00 |
| Meridiam | $266.00 |
| Dallas Police / Fire Pension Fund | $70.00 |
| North Tarrant Express | |
| Cintra | $241.50 |
| Meridiam | $141.90 |
| Dallas Police / Fire Pension Fund | $42.60 |
| Port of Miami Tunnel | |
| Bouygues | $8.00 |
| Meridiam | $72.30 |
| I-595 | |
| ACS Iridium | $207.70 |
| SH-130 Segment 5-6 | |
| Cintra | $136.40 |
| Zachry | $73.40 |
| I-495 HOT Lanes | |
| Flour | $35.00 |
| Transurban | $315.00 |
| Phase | Risk-free Rate | Project Risk | Phase Risk | Equity Return |
|---|---|---|---|---|
| Construction | 6% | 2-4% | 4% | 12-14% |
| Ramp up | 6% | 2-4% | 2% | 10-12% |
| Long-term operation | 6% | 2-4% | - | 8-10% |
| Source: Adapted from Yescombe, E.R. (2007) Public-Private Partnerships: Principles of Policy and Finance. Oxford UK: Elsevier Ltd. | ||||
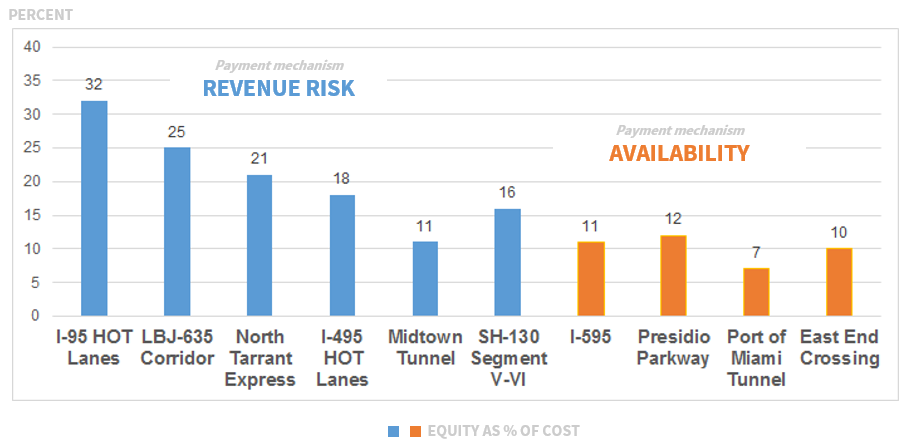
View larger version of Equity Share on US Transportation Projects
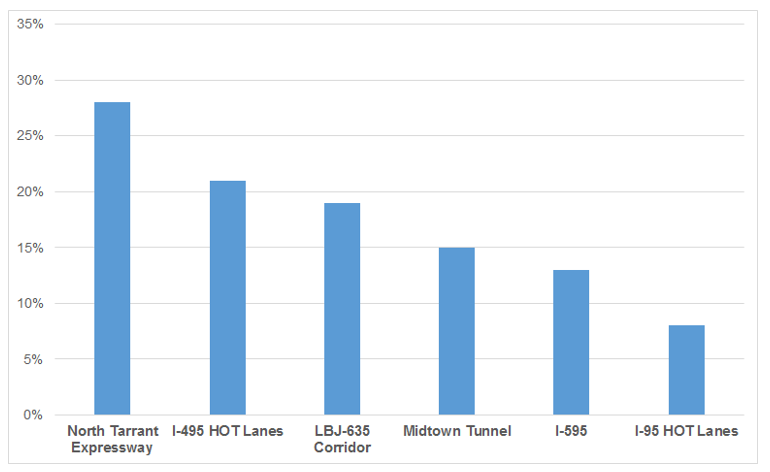
View larger version of Upfront Government Contributions on US P3 Projects
| Source of Funds | Terms and Conditions | Value | Availability |
|---|---|---|---|
| Cash reserves | Funded at financial close | Project specific | Immediate (*) |
| Cash reserves | Funded from project cash flows | Project dependent | Immediate once constituted |
| Letters & Lines of credit | On call from a financial institution Supports project cash flows during construction to avoid impact on schedule. | About 5-10% of contract value | Immediate (irrevocable and unconditional) |
| Parental guarantee | Guarantee of performance by ultimate parent of the Construction or the Operations & Maintenance contractor | Based on probable loss | Immediate subject to credit worthiness |
| Performance bond | Surety bond provides core performance support in case of contractor failure | 100% of contract value | Conditional and subject to process |
| Insurance | Provided by third party to subcontractors and SPV | Priced on coverage, insured | Conditional and subject to process |
| Notes (*) Lenders will only consent to use of the reserves for their designated purpose. In other words the debt service reserve is not available for maintenance purposes. | |||
Submit a question using the chat box
Project Development
|
||
|
|
||
Bid Preparation
|
||
Commercial & Financial Close
|
||
|
|
||
Concession Period
|
||
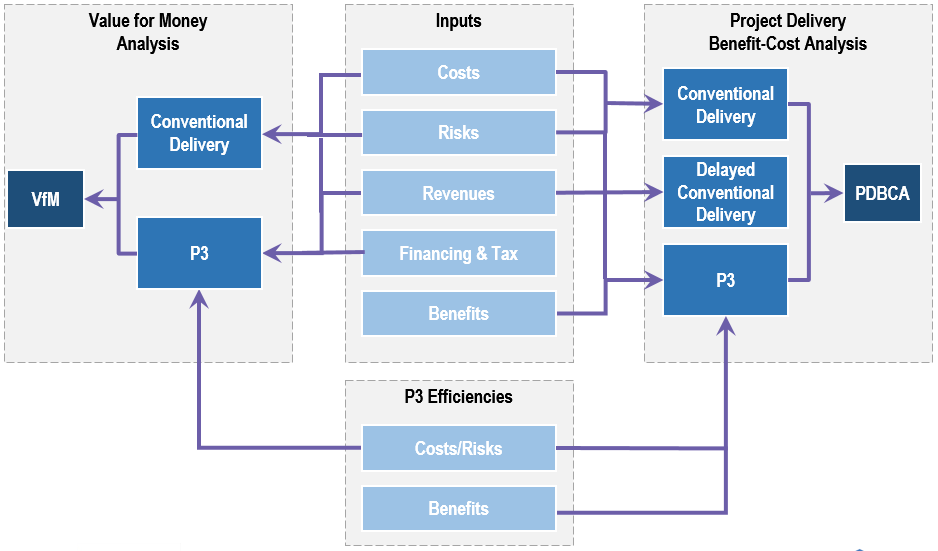
View larger version of P3-Value 2.0 Flow Chart
| Risk Assessment | Value for Money Analysis | ||
 |
|||
| Financial Viability Assessment | Project Delivery Benefit-Cost Analysis | ||
Submit a question using the chat box
Introductory
Advanced Analysis
To register for the webinars, please visit:
https://www.fhwa.dot.gov/ipd/p3/toolkit/toolkit_webinars/default.aspx
| Fact Sheets |
|
| Primers |
|
| Guides |
|
| Discussion Papers |
|
| Analytical Tools |
|
| Informational Reports |
|
Brien Desilets
Managing Director
Claret
Consulting
(703) 760-4491
bdesilets@claretconsult.com
Patrick DeCorla-Souza
P3 Program Manager
USDOT Build America Bureau
& FHWA Center for
Innovative Finance Support
(202) 366-4076
Patrick.DeCorla-Souza@dot.gov