February 28, 2017
Presentation:
Transcript:
Webinar Recording:
Environmental Justice Analysis, Tools and Approaches Virtual
Workshop
FHWA SPONSORED FEBRUARY 28, 2017
Agenda
- Objectives
- Speaker Introductions
- Introduction to the Congestion Pricing Program
- LA Metro: ExpressLanes Low-Income Impact Assessment
- NCTCOG: Influencing Travel Behavior with Sensitivity to Environmental
Justice
- Open discussion
Objectives
- Insight into FHWA's efforts towards supporting agencies with
Environmental Justice (EJ) aspects of their congestion pricing initiatives
- Learn about innovative EJ analysis approaches and tools through
real-life examples
- Gain perspective of the role of public perception and EJ population
concerns
- Broader conversation through open discussion and suggestions
for FHWA
Speaker Introductions
- Angela Jacobs, FHWA Office of Operations, Congestion Pricing
Manager
- Natalie Bettger, Senior Program Manager, Congestion Management
and System Operations, North Central Texas Council of Governments
(NCTCOG)
- Nancy Pfeffer, President, Network Public Affairs, LLC
FHWA's Congestion Pricing Program
- Congestion Pricing program and website provides information
and resources to help equip state agencies and practitioners with
an understanding and tools to implement congestion pricing projects
and incorporate pricing into transportation planning.
- Relevant Initiatives
- VPPP supported project in Texas
- Ongoing support to NCHRP 08-100 "Environmental
Justice Analysis when Considering Toll Implementation or Rate
Changes"
- Upcoming White Paper: "Impact of Congestion Pricing
on Low-Income Populations
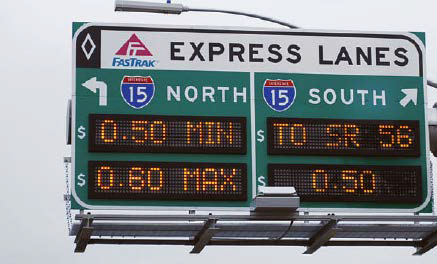
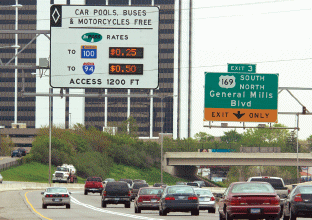
Impetus for the Workshop
"Agencies looking to implement priced-managed lanes
need to be cognizant about both the potential for genuine adverse impacts
on low-income populations, as well as the gap in public education leading
to a rejection of road pricing as inherently inequitable."
- There has been a significant amount of interest in the impact
of pricing on EJ populations.
- Very limited information filters to practitioners and the public
beyond the transportation agency involved in the action.
LA Metro: I-10/I-110 ExpressLanes
Low-Income
Impact Assessment
LA Metro - Overview
- Assessment of low-income impacts required by state authorizing
bill (SB 1422)
- Offered guidance as to methodology
- ExpressLane implementation would leave low-income commuters
better off:
- More travel choices
- Enhanced transit service
- However, some mitigations were recommended and implemented:
- Transponder account: administrative burdens
- "Equity Plan" - now called Low-Income Assistance
Plan
LA Metro - Methodology
- Define "low-income" -> Recommendation
- State and local assistance programs
- Federal poverty threshold
- Definitions used in project surveys
- Identify potential "low-income" users of express lanes
- Census data on commuting modes
- Regional MPO commuting survey
- Travel demand model: trip origins & demographics by
TAZ
- License plate survey
Income Distribution
in ExpressLane Corridors
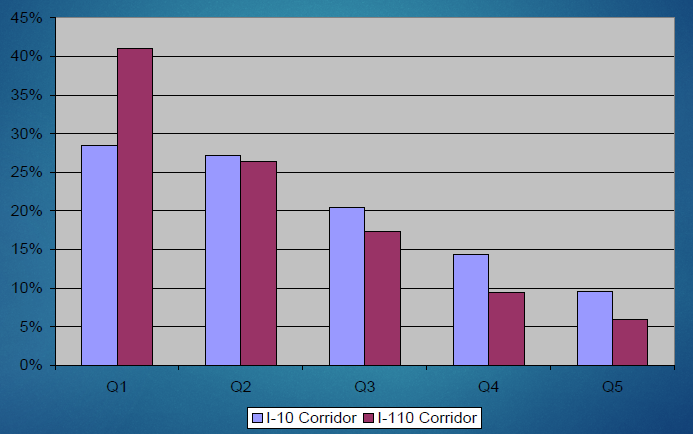
Source: 2008 data from SCAG; income distribution based on 2000
U.S. Census
LA Metro - Methodology
- Evaluate impacts on low-income commuters
- Travel demand model plus toll optimization model
- ***Toll model can be run to optimize revenue OR optimize
travel time***
- Comparison: low-income value of time with
marginal value of time: the value at which
the driver is indifferent between staying in the free lane or
entering the ExpressLane
- Conclusion: no instances where low-income commuters would choose
the express lanes, BUT
- ***Minimum toll level affected model results***
- Average value of time vs. instantaneous (range)
- Toll credits could help, along with different assumptions
about value of time
- Anyone may decide that the cost of toll is worth
the time saved
LA Metro - Additional Findings
- Overall cost- benefit analysis
- Ensure cost of contemplated toll and transit credits could
be covered
- Overall net social benefit (positive Net Present Value)
- Analysis of transponder account administrative burdens
- Prevalence of credit cards, bank accounts
LA Metro - Recommendations
- Credit account set-up fees for low-income households
- Versus on-going toll credit
- Implemented: one-time $25 credit per household
- Require lower minimum account balance for accounts not linked
to credit card
- Ensure wide local distribution of transponders
- Waive or reduce minimum monthly account charges
- Implemented - monthly $1 fee waived
- Transit credits can be earned
- Implemented via TAP cards
- ***Outcome: as of early 2015, over 5,000 low-income
households signed up***
Two Important Publications
- Equity of Evolving Transportation Finance Mechanisms,
2011 (TRB Special Report 303) suggests these key questions:
- Who is affected by the project?
- Who makes direct payments, and how are revenues spent?
- What are the benefits and impacts of the project [for low-income
drivers]?
- What travel alternatives are available (if needed)?
- Just Pricing: the distributional effects of congestion
pricing and sales taxes (L. Schweitzer, University of Southern
California, and Taylor, University of California, Los Angeles, 2008)
"Using sales taxes to fund roadways … shift[s]
some of the costs of driving from drivers to consumers at large,
and in the process disproportionately favors the more affluent at
the expense of the impoverished. Others have shown such transfers
to be inefficient; we argue it is inequitable as well."
Elements of Equity Assessment
- Demographic data (focus on low-income)
- Survey data
- Project funding/financing data
- Traffic modeling: time savings
- Toll modeling and value of time
- Travel alternatives
- Transponder issues
Equity Findings -
Project Finance Plans
- Funding can come from multiple sources
- Toll is paid by user for specific benefit (most equitable)
- Gas tax may be paid by non-users of I-10 & I-15 toll
lanes
- Sales tax may be paid by non-users

- There is no goal or standard for what is equitable
General Purpose Lane
Travel Time on I-15 Year 2030 from SR-60 to US 395
(in minutes to travel ~33 miles)
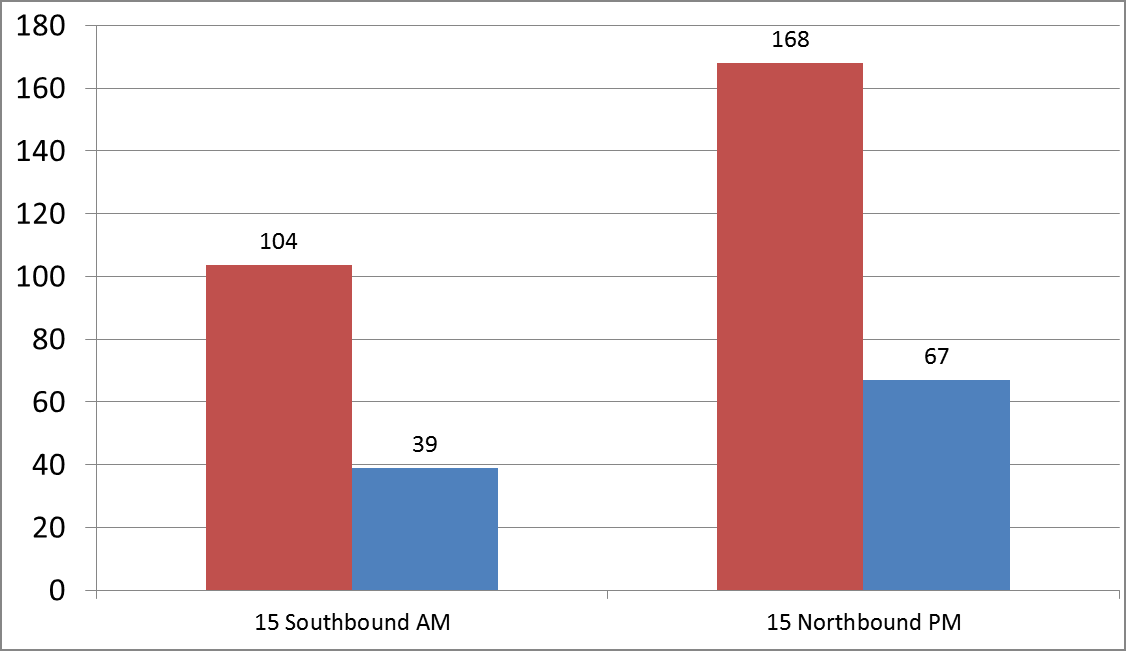
Source: CDM Smith traffic model results September 2013
Overall Recommendations
for Tolling Equity Analysis
- Analyze equity concerns early (if you can)
- Coordinate with other project analysts
- GIS staff
- Traffic modelers
- Financial projections
- Consistent findings for HOT lanes
- Positive findings for equity for low-income travelers: better
off with more travel choices, (possible) new transit service,
faster GP lanes
- Subsidy or special policies recommended for low-income households'
accounts
- ***Other forms of tolling may present more equity concerns***
NCTCOG: Influencing Travel Behavior with Sensitivity
to Environmental Justice
Project Overview Phases
- Develop Tool to Track Usage and Provide Incentives
- TryParkingIt
- DFW Connect-A-Ride
- Enhance Tool to Guide Operational Decisions on Managed Lanes
(ML)
- Goals And Performance Measures
- Determine and Measure Incentives through Survey
- Model Incentive Impacts and Incorporate Results into Tool
- Use the Tool to Help Determine IH-30 ML Policies
- Implement Incentives
- Marketing and Outreach
- Track Usage
- Compare Model Data to Real World Data
IH 30 Corridor Characteristics
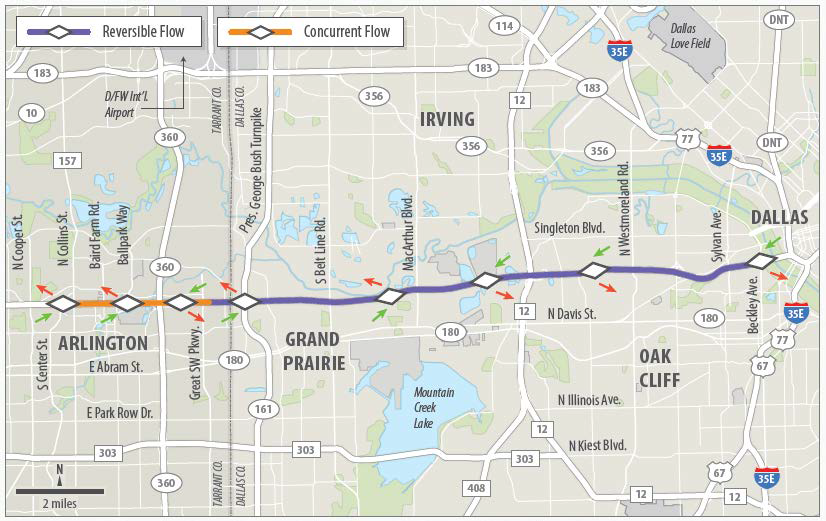
- Major East/West Facility
- Connects Dallas and Fort Worth
- Multiple Operators
- Managed Lane Corridor
- Over 80% Households in Corridor are disadvantaged
- NCTCOG's Commuter Tracking & Ride-matching System
- Purpose is to reduce journey-to- work trips
- App and Website
- NCTCOG's "real-time" ridesharing program
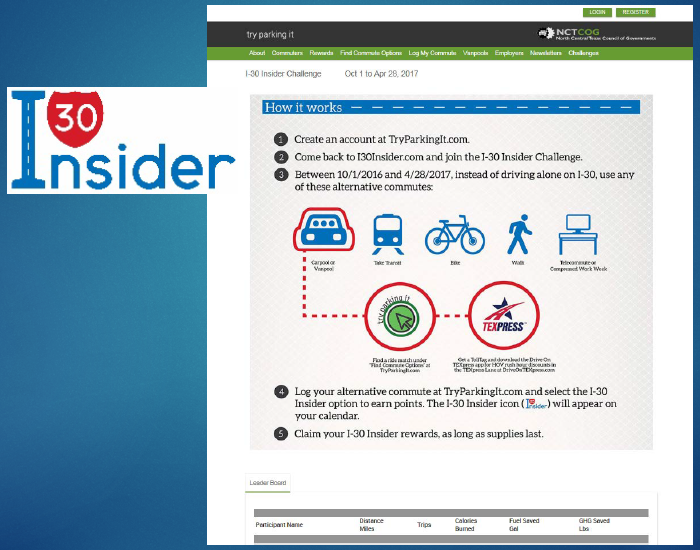
- Drive on TEXpress is a free mobile app and website for HOV users
to receive toll discounts
- Carpools using the app receive a 50% toll discount on ML


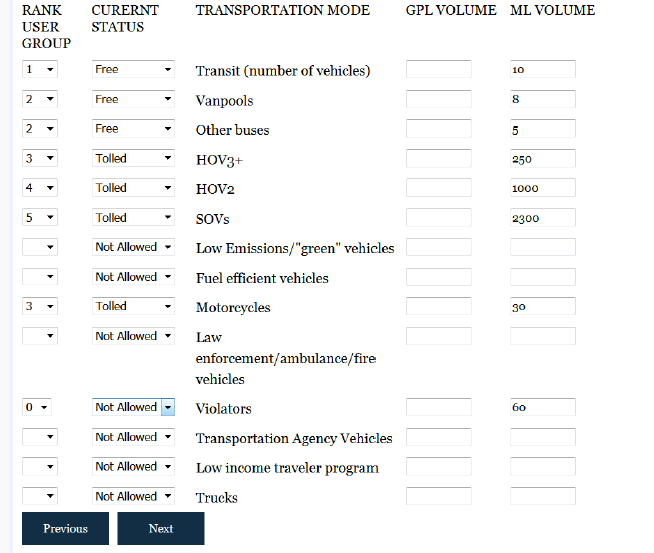
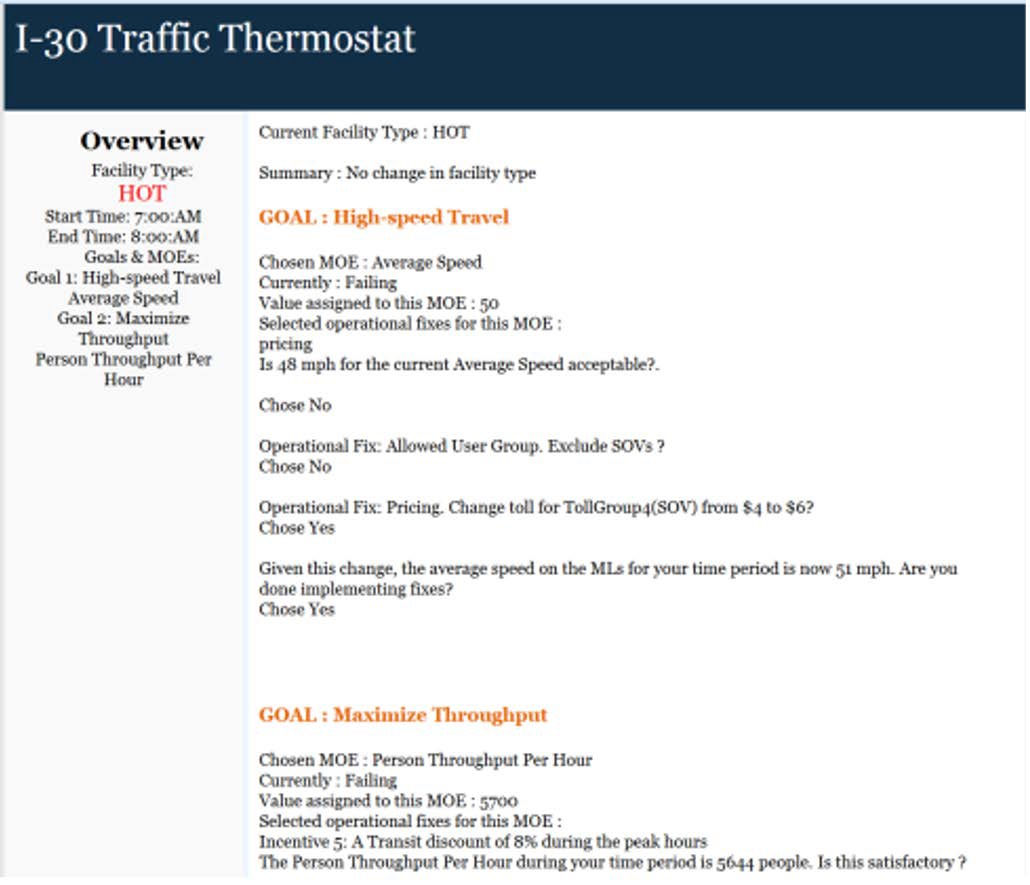
Traffic Thermostat Modeling Tool
| Goal |
MOEs |
| Safe Travel |
Number of Crashes |
| Incident Clearance Time |
| High-Speed Travel |
Average Speed |
| Travel Time |
| Reliable Travel |
Buffer Index |
| Days per Month Below Threshold |
| Provide Choice |
Public Perception of User Choice |
| Number of Unique Users |
| Maximize Throughput |
Person Throughput |
| Person Throughput in HOVs |
Traveler Characteristics - Survey
| Characteristic |
Percentage of Travelers |
| Gender |
| Male |
55.2 |
| Female |
44.8 |
| Age |
| 18-24 |
4.3 |
| 25-34 |
20.1 |
| 35-44 |
17.6 |
| 45-54 |
24.1 |
| 55-64 |
23.5 |
| 65+ |
10.2 |
| Ethnicity |
| White/Caucasian |
78.5 |
| Hispanic/Latino |
6.9 |
| African American |
6.6 |
| Asian American |
2.8 |
| Native American |
1.3 |
| Other |
3.8 |
| Education |
| Less than high school |
0 |
| High school graduate |
2.5 |
| Some college or vocational school |
21.9 |
| College graduate |
42.5 |
| Post-graduate college |
33.1 |
| Household Income |
| Less than $10,000 |
0 |
| $10,000 - $14,999 |
0.3 |
| $15,000 - $24,999 |
1.9 |
| $25,000 - $34,999 |
4.1 |
| $35,000 - $49,999 |
8.8 |
| $50,000 - $74,999 |
20.7 |
| $75,000 - $99,999 |
16.3 |
| $100,000 - $199,999 |
25.4 |
| $200,000 or more |
6 |
| Prefer not to answer |
16.7 |
Mode Choice
| Answer to Stated Preference Question 1 |
Percentage of Travelers |
| General Purpose Lane |
68.8 |
| Managed Lane Drive Alone |
15.7 |
| Managed Lane Car Pool |
11.7 |
| Transit |
3.7 |
| Average of SP2 and SP3 |
|
| General Purpose Lane |
60.2 |
| Managed Lane Drive Alone |
19.1 |
| Managed Lane Car Pool |
17.1 |
| Transit |
3.7 |
Express Lanes chosen 31% of the time without an incentive and 40%
when an incentive was offered
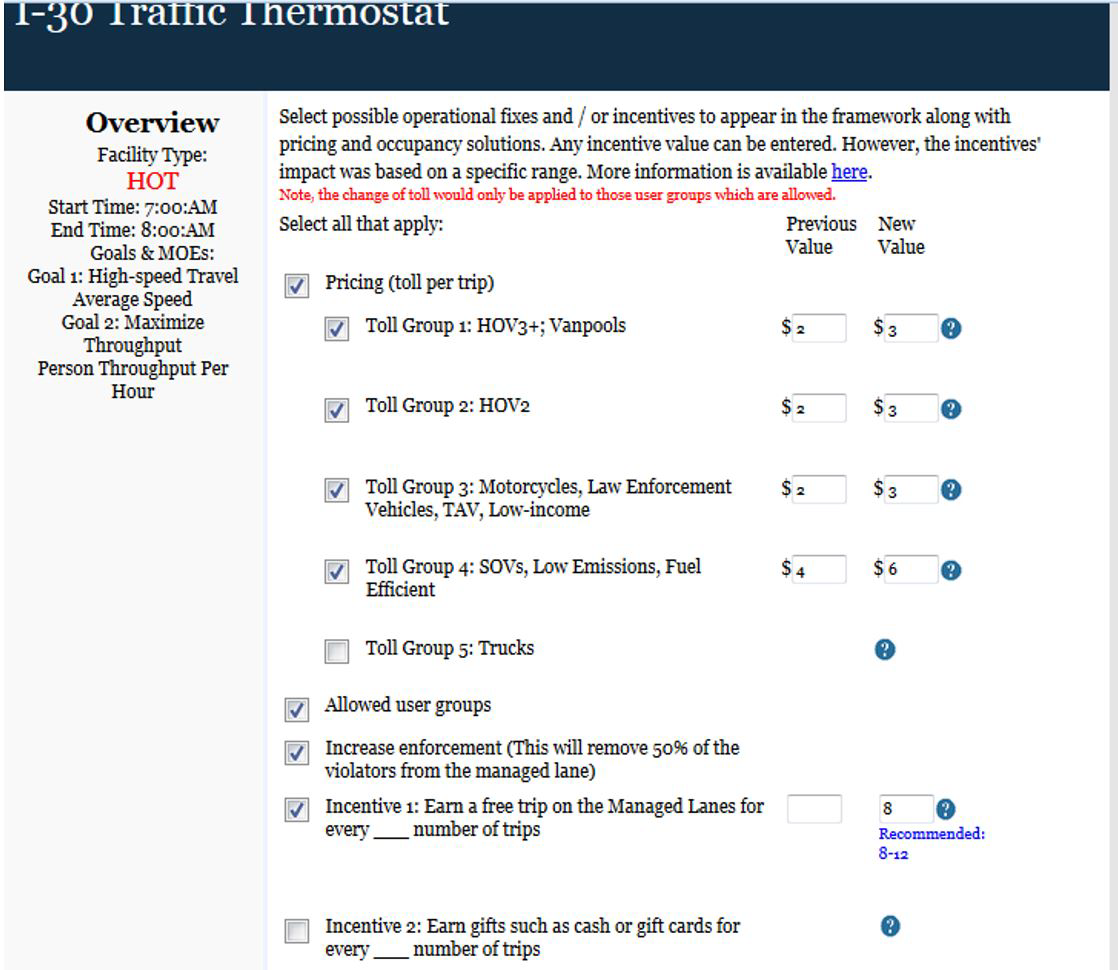
Incentives Chosen for Survey
- Earn a free trip for every X paid trips taken on the ML
- Earn gift cards worth $5 for every X peak-hour trips saved by
either telecommuting or by not traveling during the peak hours (7-9
am or 4-6 pm)
- X% discount offered through select businesses
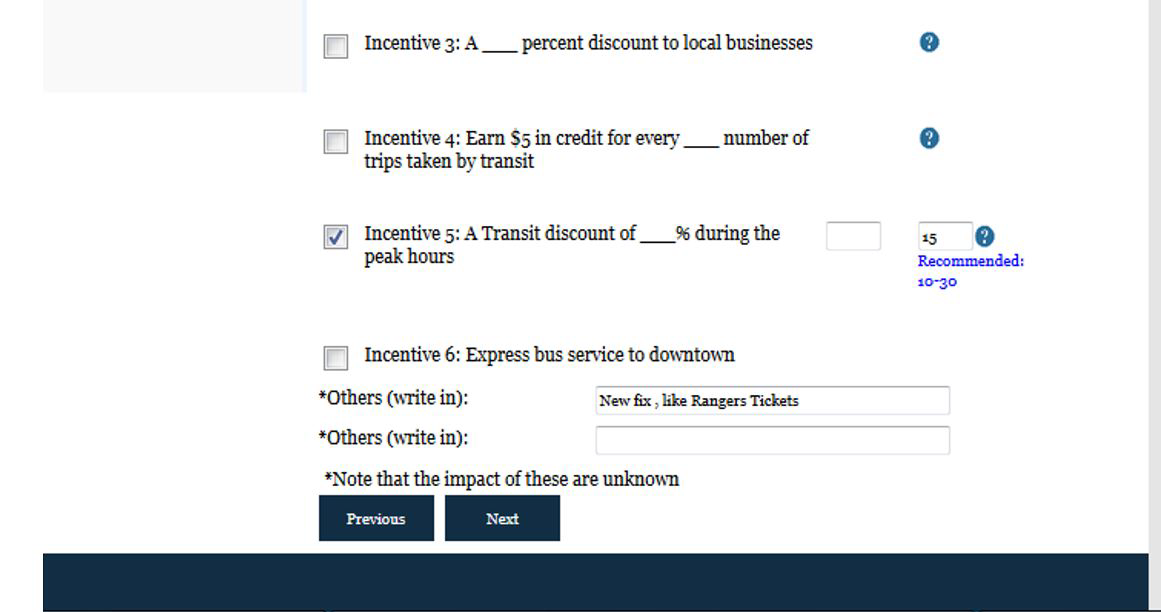
- For every X trips taken by transit, $5 in credits that can be
used on the Express Lanes
- A transit fare discount of X%
- Express bus service from park-and-ride lots to downtown
Traffic Thermostat Tool:
Inputs Page
Traffic Thermostat Operational
Fixes
Traffic Thermostat Output
Marketing &
Outreach Goals & Objectives
- Recruit participants for the I-30 Insider program
- Determine the effectiveness of several types of incentives to
encourage alternative commutes
- Specific focus low-income individuals
- October 2016 through April 2017
IH 30 Insider Infographic
Advertisements
- Social Media Advertising
- Digital Billboards
- Search Engine Optimization
- Targeted Digital Advertising
- CBS Radio
- Dallas Morning News
- KXAS / NBC 5

Challenges
- Challenging to develop a tool that is both accurate and flexible
- Quantifying impacts
- Changing operational fixes
- Conflicting goals
- Access to demographic data for specific users of the system.
- Have options not to answer
- Marketing and outreach to specific audience.
- How best to engage Environmental Justice disadvantaged community?
- Environmental Justice disadvantaged is high along corridor,
but not sure about travelers on the facility
Q&A
Open Discussion
- Other experiences with performing EJ analysis and equity concerns
related to congestion pricing projects
- Innovative approaches
- Tools developed
- Steps taken to mitigate any adverse impacts
- Communicating equity impacts to public
- Lessons learned


