Patrick DeCorla-Souza, Tolling and Pricing Program
Manager, FHWA
Lee Munnich, Humphrey Institute, University of
Minnesota
Kenneth Buckeye, Minnesota Department of Transportation
John Doan, SRF Consulting
Center for Innovative Finance Support
Federal Highway Administration
Eighteenth Part of a Webinar Series on Overcoming the Challenges
of Congestion Pricing.
Session 18: Synergies Among Congestion Pricing, Active Transportation and Demand Management (ATDM), and Other Market-Based Strategies - Presentations
Audio:
- Via Computer - No action needed
- Via Telephone - Mute computer speakers, call 1-866-863-9293 passcode 85722002
Presentations by:
Audience Q&A - addressed after each presentation, please type your questions into the chat area on the right side of the screen
Closed captioning is available at:
http://www.fedrcc.us//Enter.aspx?EventID=2550193&CustomerID=321
Recordings and Materials from Previous Webinars:
https://www.fhwa.dot.gov/ipd/tolling_and_pricing/resources/webinars/congestion_pricing_2011.aspx
Part A: Synergies Among Congestion Pricing, ATDM, and Other Market-Based Strategies
Angela Jacobs
FHWA Value Pricing Program
February 24, 2015

Synergies Among Congestion Pricing, ATDM, and Other Market-Based Strategies
- Through technological advances, we have witnessed an evolution in innovative solutions designed to alleviate congestion
- Priced Managed Lane corridors have utilized dynamic pricing as a congestion reduction strategy
- UPA/CRD programs encouraged the use of combined strategies with the "4 Ts"
- ICM and ATDM strategies further optimize congestion management efforts
- Webinar presenters will focus on the synergies among these complementary strategies
Active Demand Management - Definition
Complement to:
- Active Traffic Management
- Active Parking Management
FHWA:
Active Demand Management (ADM) uses information and technology to dynamically manage demand, which could include redistributing travel to less congested times of day or routes, or reducing overall vehicle trips by influencing a mode choice.
Active Demand Management - Strategies
- Dynamically managed lanes (occupancy, price. etc.)
- Shared use mobility (e.g., carshare, bikeshare)
- Dynamic ridesharing (carpooling and vanpooling)
- Dynamic routing
- Dynamic transit capacity assignment
- On-demand transit, dynamic fare reduction
- Transit connection protection
- Predictive traveler information
Synergies Among Congestion Pricing,
ATDM, and Other Market-Based Strategies
- Robert Sheehan, USDOT ITS Joint Program Office - Integrated Corridor Management
- Brian Kary, Minnesota DOT - ATDM and Congestion Pricing in Minnesota
- Tyler Patterson, Washington State DOT - A Case Study of SR 167 HOT Lanes Access Changes
Part B: Integrated Corridor Management
Bob Sheehan
ITS Multimodal Research Program Manager,
ITS Joint Program Office
U.S. DOT
The Reality: Operations Today
- Surface transportation systems are made up of several independent networks
- Freeways, bus/rail transit, arterials, etc.
- Most efforts to reduce congestion have focused on optimization of individual networks
- Agency/facility/mode - specific ITS systems & strategies
- Minimal cross-network management in response to increased demand / reduction in demand
ICM Vision
- An opportunity exists to realize significant improvements in the efficient movement of people and goods through integrated and proactive management of major multimodal transportation corridors.
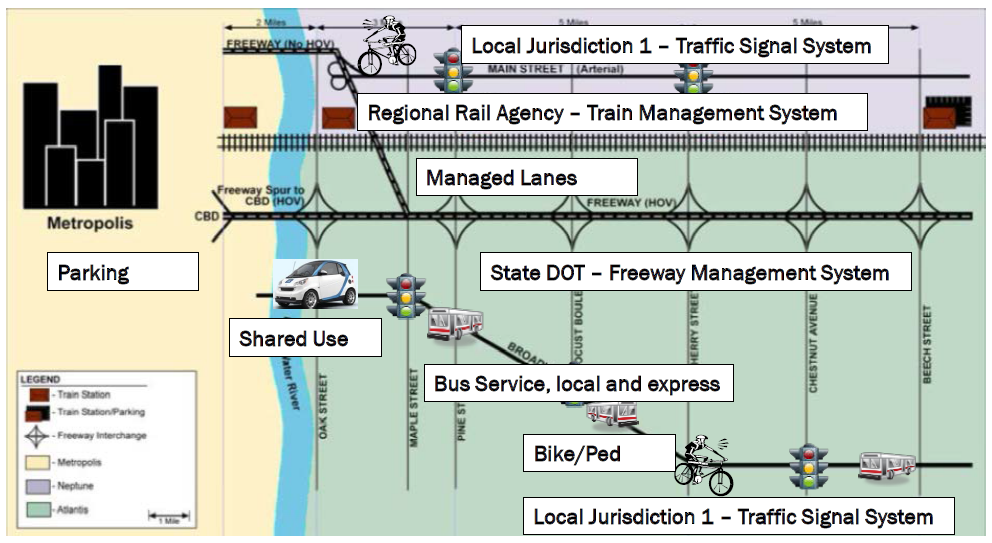
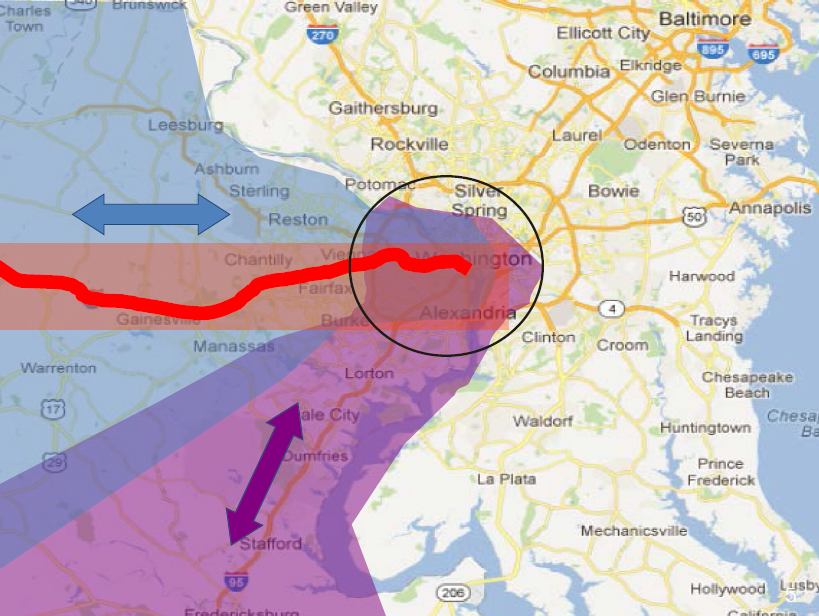
Generic Corridor
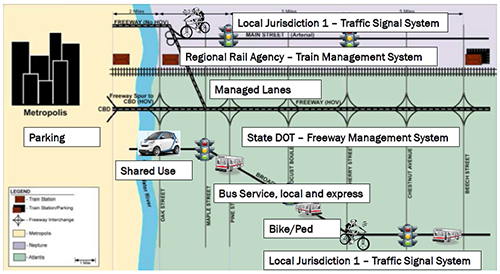
View larger version of Generic Corridor map
View larger version of the sample corridor map
Integration
Institutional Integration - Coordination to collaboration between various agencies and jurisdictions that transcends institutional boundaries.
Operational Integration - Multi-agency and cross-network operational strategies to manage the total capacity and demand of the corridor.
Technical Integration - Sharing and distribution of information, and system operations and control functions to support the immediate analysis and response.
ICM Operational Approaches
- Information Sharing / Distribution
- Improve Operational Efficiency at Network Junctions
- Accommodate (Passive) / Promote (Active) Cross Network Route and Modal Shifts
- Modify Capacity, Short Term - Demand Relationship Within Corridor
- Modify Capacity, Long Term - Demand Relationship Within Corridor
Approach D: Manage Capacity-Demand Relationship Within Corridor in "Real-time"/Short-Term
- Capacity Oriented
- Lane use control (reversible lanes / contra-flow).
- Convert regular lanes to "transit-only" or "emergency-only."
- Add transit capacity by adjusting headways and # of vehicles.
- Add transit capacity by adding temporary new service.
- Add capacity at parking lots (temporary lots).
- Increase roadway capacity by opening HOV/ HOT lanes/ shoulders.
- Modify HOV restrictions.
- Restrict ramp access (metering rates, closures).
- Convert regular lanes to "truck-only."
- Coordinate scheduled maintenance and construction.
- Demand Oriented
- Variable speed limits (based on Demand, Time of Day, construction, weather conditions).
- Modify toll / HOT pricing.
- Modify transit fares to encourage ridership.
- Modify parking fees.
- Variable truck restrictions (lane, speed, network, time of day).
- Restrict / Reroute Commercial Traffic.
- Incentives
KEY: Implemented at a corridor-level, multi-jurisdictional, multi-modal fashion
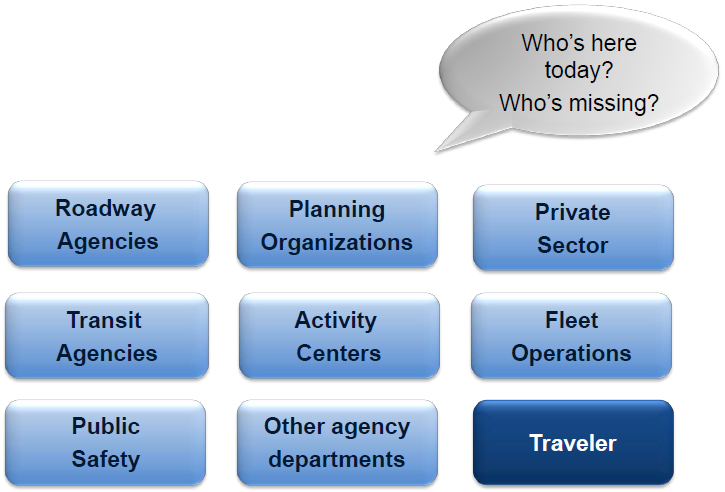
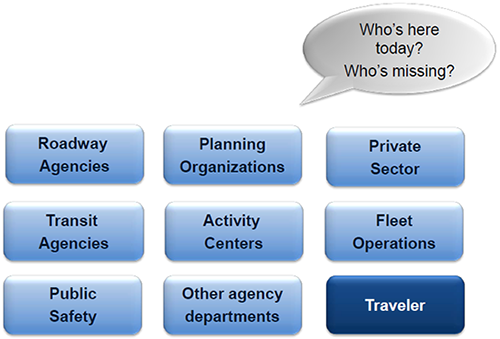
Stakeholders
View larger version of the flow chart
ICM and Pricing
- Pricing to influence demand
- Incentives to influence demand
- Options
- Modify toll / HOT pricing.
- Modify transit fares to encourage ridership.
- Modify parking fees.
- Incentives.
Opportunities for integration
- As part of an integrated approach, travelers would be given more complete information regarding their decision to pay for use of a managed lane vs. other options
- These lanes could enhance the capabilities of ICM strategies by providing options that are already programmed and signed by regional agencies.
Challenges to Integration
- Agencies implementing managed lanes using congestion pricing typically have a primary objective of providing a "congestion-free" option for travelers who are willing to pay.
- Operators seek to provide a driving experience that customers perceive to be more valuable than the toll paid.
- Ensuring travel time reliability is an important element in providing the managed lane driver with this experience, especially when compared to uncertain travel times in general purpose lanes.
- Pricing is a powerful tool to influence demand
- The decision to alter pricing for a corridor objective cannot be taken lightly.
- Example: Priced facility with considerable transit service; Objective of the corridor is based on PMT and Person Delay; Major incident on general purpose lanes!!; Managed lanes will be priced to maintain maximum flow (assuming no cap);
What about the corridor objective? Should the restriction on the managed lanes be lifted? How does that affect the managed lane customer? How does that affect transit reliability and captured riders? Choice riders?
USDOT ICM Core Team
Neil Spiller
Federal Highway Administration
neil.spiller@dot.gov
Steve Mortensen
Federal Transit Administration
steven.mortensen@dot.gov
Bob Sheehan
ITS Joint Program Office
robert.sheehan@dot.gov
James Colyar
Federal Highway Administration
james.colyar@dot.gov
Learn More
Part C: ATDM and Congestion Pricing in Minnesota
Brian Kary
Minnesota Department of Transportation
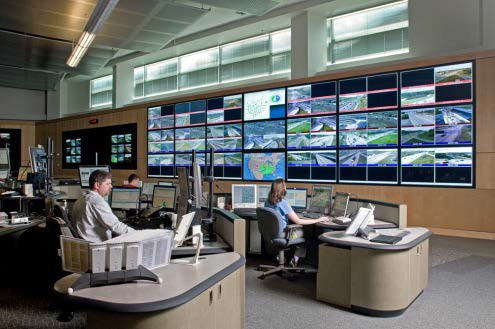
Regional Transportation Management Center
- Shared Operations Center
- MnDOT Traffic Operations
- MnDOT Maintenance Dispatch
- State Patrol Dispatch
- 400 miles of freeway management system
- Cameras
- Changeable Message Signs
- Freeway Service Patrol
- Adaptive Ramp Metering
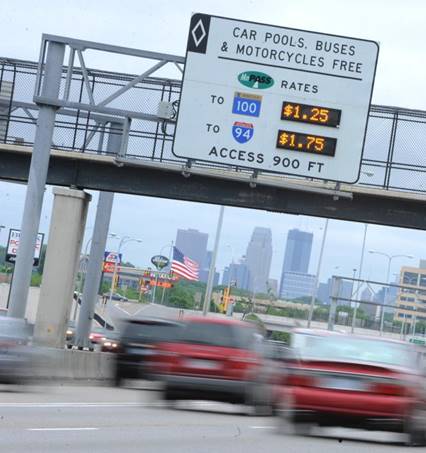
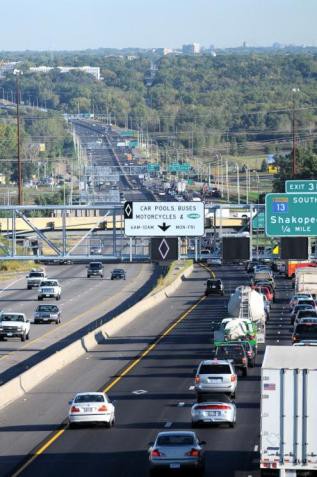
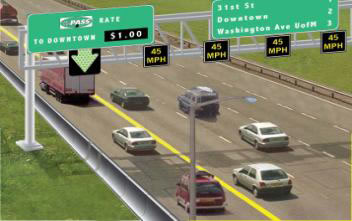
MnPASS System
- High Occupancy Toll Lanes
- Provide for faster, safer and more reliable travel options
- Travel benefits for transit, carpoolers, motorcycles and MnPASS customers
- Dynamic Pricing
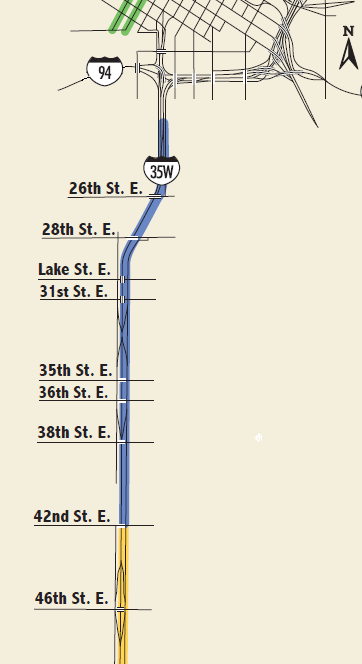
I-35W: The 21ST Century Highway
- Expanded MnPASS System
- Smart Lanes
- Priced Dynamic Shoulder Lane
- Bus Rapid Transit and Stations
- Integrated Park and Rides
- Low cost/high benefit capacity
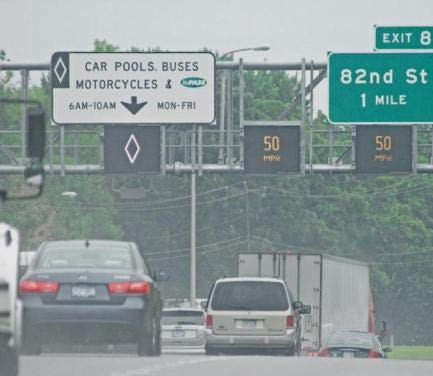
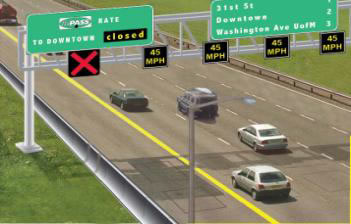
I-35W Smart Lanes
- Intelligent Lane Control Signals (ILCS) located every ½ mile over every lane.
- A total of 297 ILCS.
- 187 ILCS on I-35W
- 110 ILCS on I-94
- ILCS are a 4ft x 5ft full color matrix signs.
- Use of the ILCS is for incident management , variable speeds and priced dynamic shoulder lane
ILCS Sign Options
 |
Blank - default |
 |
Green - Lane Open |
 |
Flashing Yellow - Caution |
 |
Red X - Closed |
 |
Lane Closed Ahead |
 |
Merge Left |
 |
Merge Right |
 |
Merge Both |
 |
Speed Limit |
 |
White Diamond |
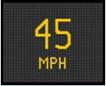
Variable Speed Limits
- Advisory Only
- Detection measures traffic speeds downstream
- Speeds are posted up to 1 ½ miles upstream
I-35W Early Results
- Lane Control Messages
- Human factors study and surveys has shown understanding of ILCS messages
- Message compliance still an issue
- Variable Speed Limits
- Minimal improvements to mobility
- Improvements in speed differential approaching congestion
- Reduced shockwaves
- Too early for crash data results but preliminary results are not showing improvements
Priced Dynamic Shoulder Lane (PDSL)
- 3 Mile Segment on NB 35W
- Maintains existing 4 lanes with an added PDSL Lane
- Effectively extends the MnPASS lane to downtown Minneapolis using existing road space
- Total Cost = $17 M
I-35W PDSL Operations
- Monday - Friday
- 6:00 AM to 7:00 PM
- Expanded Mid-day hours due to high violation rates
- Can be open on weekends or evenings for special events, weather or incidents.
- Regular Saturday hours from 11:00 AM to 7:00 PM
Operations Challenges
- ILCS requires more precision to deploy than overhead CMS.
- Distance to incident is closer
- Lane specific
- Need precise location of incident
- Requires more operator actions
- Multiple ILCS to deploy for a single incident
- Every changing incident scene
- Requires highly skilled and detail oriented staff
Maintenance Staffing
- MnPASS Revenues on I-35W paid for one FTE to maintain ILCS.
- No additional funding for I-94
- Maintenance Agreements for ILCS
- I-35W - approximately $280,000 a year
- I-94 - approximately $200,000 a year
- Utilities Costs
- I-35W - approximately $60,000 a year
- I-94 - approximately $40,000 a year
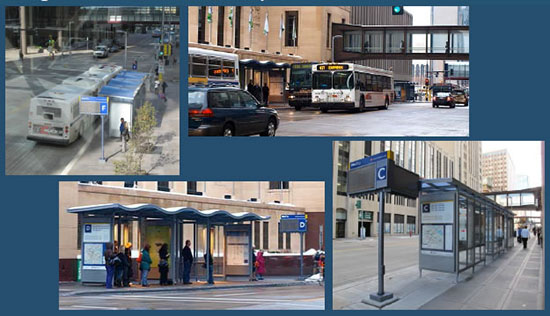
Regional Benefit: Marquette & Second Avenues
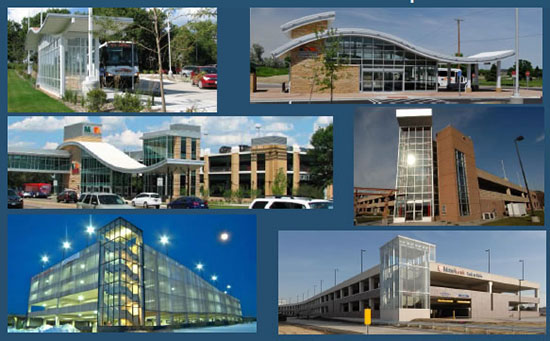
Park & Ride and Bus Fleet Expansion
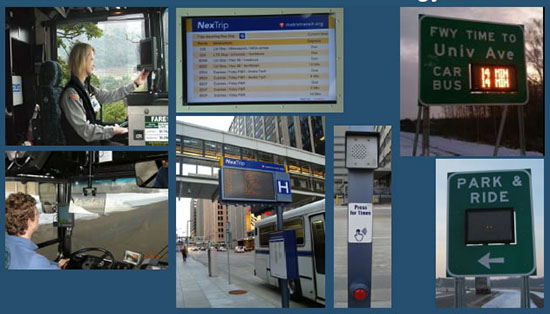
Innovative Transit Technology
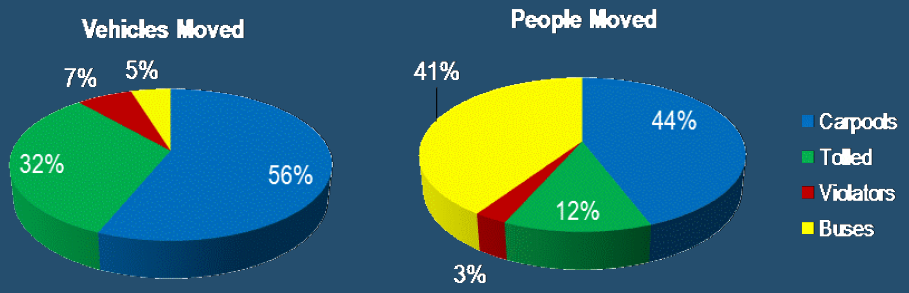
MnPASS Use & Performance
- The majority of people using MnPASS are carpooling or riding transit
- Single occupant MnPASS customers make up 32% of the total vehicles in the lane, but are only 12% of the total people in the lane
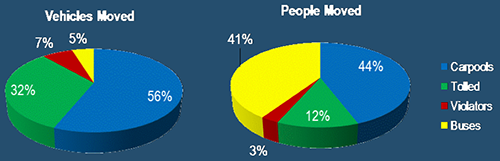
View larger version of the Vehicles and People Moved charts
Pie Chart text
- Vehicles Moved
- 56% - Carpools
- 32% - Tolled
- 7% - Violators
- 5% - Buses
- People Moved
- 44% - Carpools
- 41% Buses
- 12% - Tolled
- 3% - Violators
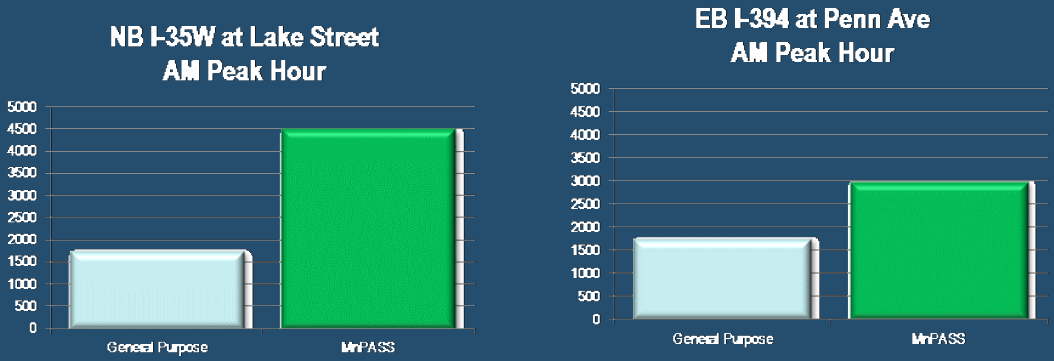
MnPASS Use & Performance
- A MnPASS lane can move twice as many people as a single general purpose lane during congestion

View larger version of the Peak Hour charts
MnPASS Reliability & Time Savings
- General purpose lanes are prone to congestion and are therefore unpredictable, which requires more time when planning a trip
- MnPASS lanes can be relied on to provide a predictable trip time
- A commuter on NB I-35W traveling from Lakeville to downtown Minneapolis must plan for a 28 minute commute, while a MnPASS commuter only needs to plan for 14 minutes
General Purpose Lane Time
MnPass Lane Time
MnPASS Use & Performance
Transit Improvement
- I-35W Express Bus Service since 2009
- Efficiency and reliability of service has greatly improved
- Metro Transit service increased 11%
- Metro Transit Ridership up 55%
- I-394 Express Bus Service since 2009
- Efficiency and reliability of service has greatly improved
- Metro Transit service increased 6%
- Metro Transit Ridership up 24%
Future of ATM in MnDOT
- MnPASS
- I-35E Opening in 2015/2016
- Other corridors being studied
- Dynamic Shoulders
- Nothing planned, but still in the toolbox
- I-35W ATM
- Some remove as part of future construction projects
- Replace with more frequent DMS rather than ILCS
- PDSL will be a permanent lane
Questions?
Brian Kary
Freeway Operations Engineer
brian.kary@state.mn.us
Congestion Pricing and ATDM
A Case Study of SR 167 HOT Lanes - Access Changes
Tyler Patterson
Toll Operations Engineer
Leidos Webinar February 24, 2015
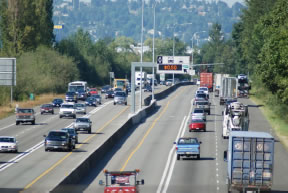
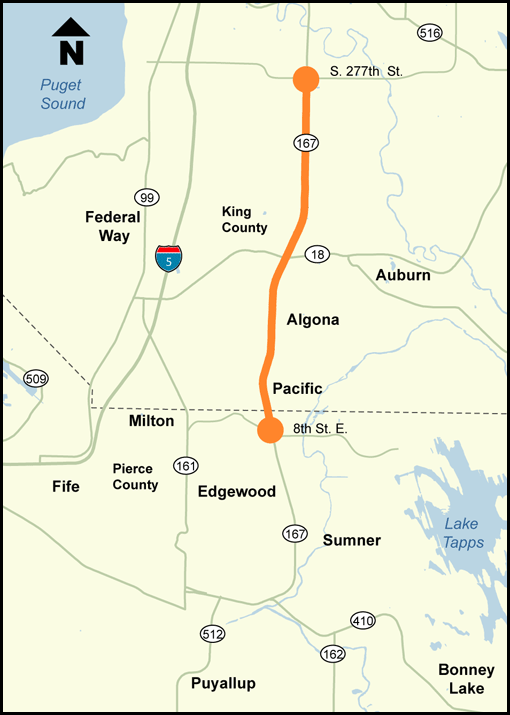
SR 167 HOT lanes overview
Why HOT lanes on SR 167?
- Highly congested route
- Under-used HOV lanes at 2+
- Provide drivers a choice
- Opened May 3, 2008
- Tolls adjust automatically to keep HOT lane traffic flowing at 45 mph or faster
- Going on 7 years of a 4 year pilot
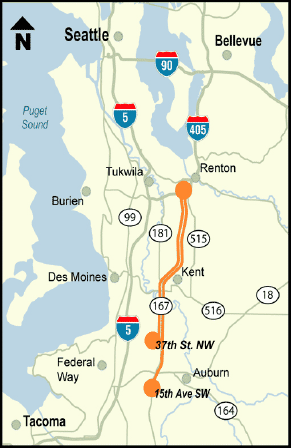
SR 167 HOT lane features May 2008-August 2014
- Free to buses, 2+ carpools and motorcycles
- Solo drivers pay a single toll to travel any distance on 10-mile route
- Good To Go! pass required for non- HOV
- Single HOT lane in each direction
- Electronic signs indicate toll rate before each entry point
- 10 access points
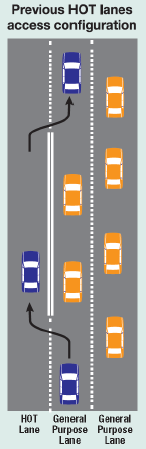
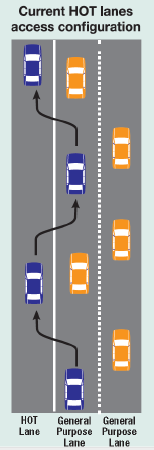
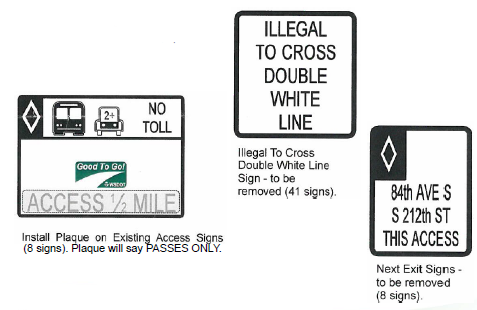
- Access Changes - HOT lane separated from general purpose lanes by single line, then double line, now single line again. Double lines are illegal to cross
Pre-HOT lanes:
SR 167 had two general purpose lanes and one HOV lane.

HOT lanes: HOV lanes were converted to a single HOT lane in each direction.
SR 167 HOT lanes meeting goals
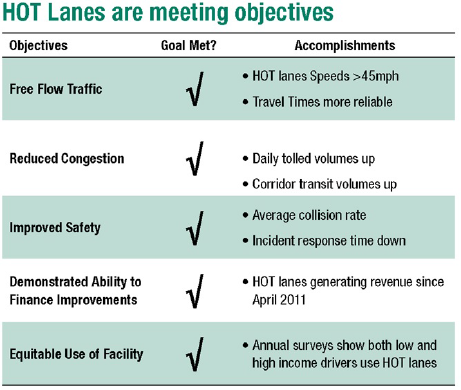
Text version of the table
| Objectives |
Goal Met? |
Accomplishments |
| Free Flow Traffic |
Yes |
- HOT lanes Speeds >45mph
- Travel Times more reliable
|
| Reduced Congestion |
Yes |
- Daily tolled volumes up
- Corridor transit volumes up
|
| Improved Safety |
Yes |
- Average collision rate
- Incident response time down
|
| Demonstrated Ability to Finance Improvements |
Yes |
- HOT lanes generating revenue since April 2011
|
| Equitable Use of Facility |
Yes |
- Annual surveys show both low and high income drivers use HOT lanes
|
Listening to customers
"Our members have indicated that the number one complaint they have received for the SR 167 HOT Lane Pilot Program is the access control restrictions." - PSRC
"Too many drivers violating the double white line crossing restrictions without any apparent penalties. Creates a real safety hazard." - survey respondent
"We have seen already that dedicated access points can make it difficult for transit to use if not located appropriately ... a continuous access treatment would remove this uncertainty for transit." - Sound Transit
Improving SR 167 HOT lane access
$520,000 Federal Value Pricing Program grant to demonstrate more-open access on the SR 167 corridor.
Funding included:
- Restriping and signage changes
- Public information and outreach
- Evaluating new access
Project goals
- Improve access for HOT lanes drivers
- Evaluate effects on revenue
- Understand customer responses, attitudes and concerns
- Determine if the new HOT lane access works
Striping changes
- Accomplished via a design-bid-build project
- Project duration three weeks
Work Activities
- Remove second white stripe to create one continuous solid stripe separating the HOT toll and general purpose lanes.
- Left double white stripe at the start and the end of the HOT lane
Signing Changes
Work Activities
- Signing removals and changes
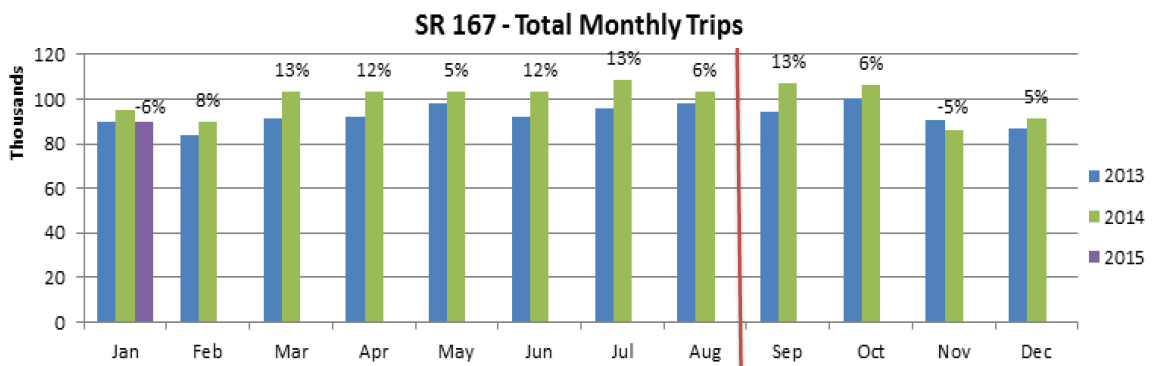
Impact on transactions
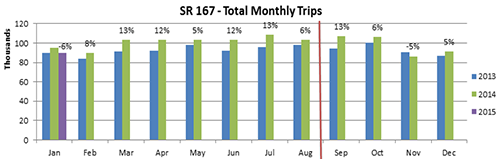
View larger version of the SR 167 Total Monthly Trips chart
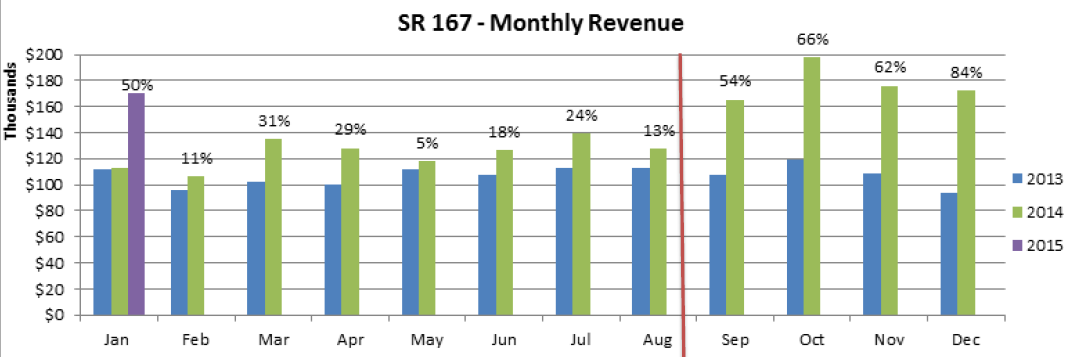
Toll revenue is up
The increase is substantial, and based on both increased price and volume
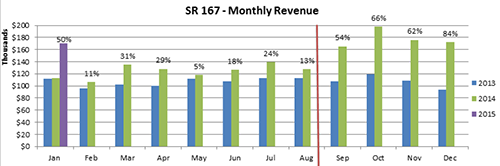
View larger version of the SR 167 Monthly Revenue chart
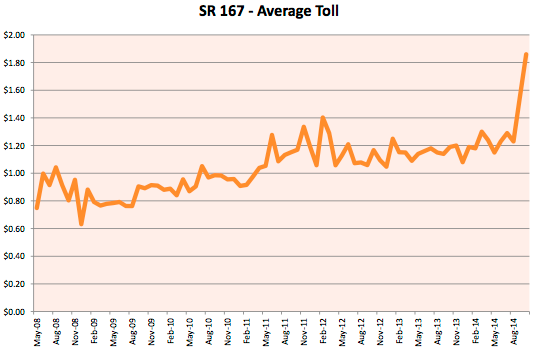
Price per paid trip has increased
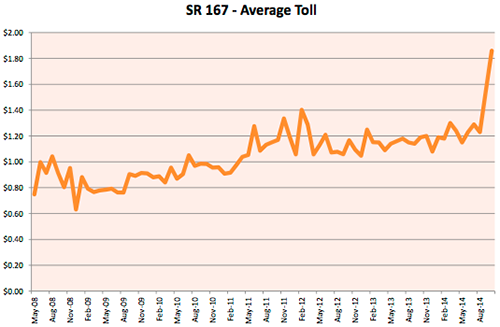
View larger version of the Average Toll chart
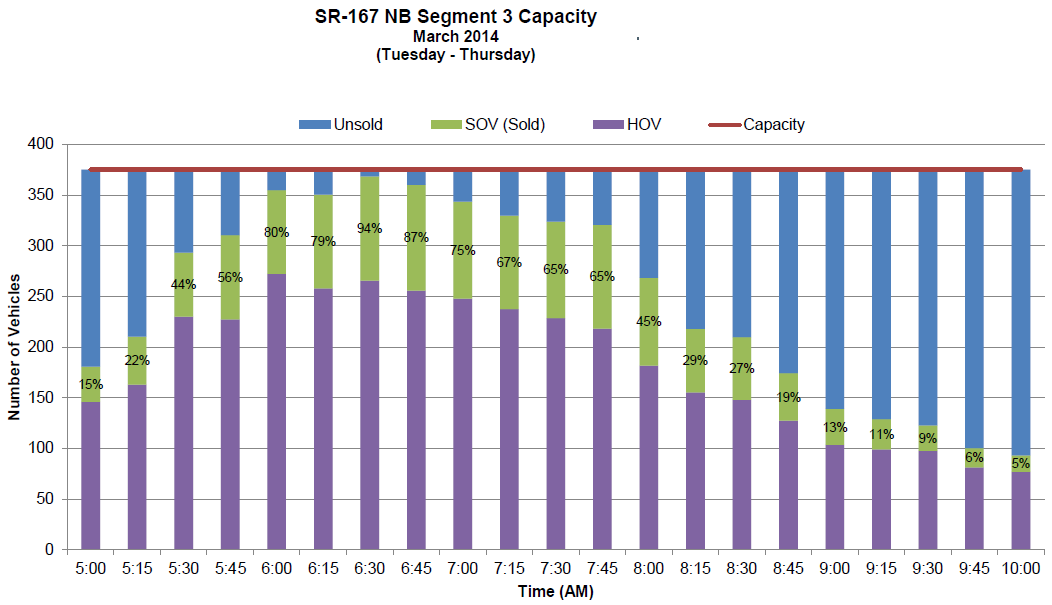
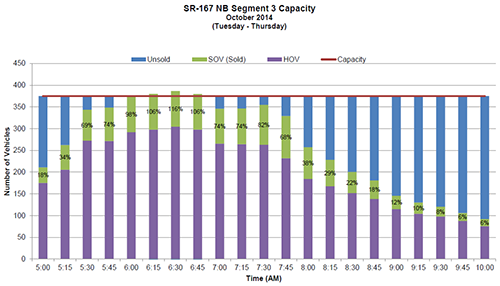
Capacity Use - Limited Access

View larger version of the NB Segment 3 Capacity Limited Access chart
Capacity Use - Open Access
View larger version of the NB Segment 3 Capacity Open Access chart
December 2014 customer email survey
- Sent to 44,000 customers; nearly 4,000 responded
- More convenient: 82 percent agree
- Easier to use: 80 percent agree
- More useful: 77 percent agree
- Prefer new access: 67 percent
- Safer: 42 percent agree
Washington State Transportation Center (TRAC) before and after evaluation

Evaluation focuses on:
- revenue collections
- toll evasion
- safety
- reliability and speed of the express toll facility
- reliability and speed of the general purpose lanes
- customer attitudes
- transit operations
Initial SR 167 Continuous Access Results
WSDOT's Initial Results
Traffic
- Increased volumes in HOT lanes (both paying and non-paying)
- consistent growth in transactions
- HOVs are largest increase
- Slightly decreased speeds in HOT and GP lanes
Revenue
- Increased toll revenue
- Increased toll rate
- More frequent high prices
- $9 maximum toll reached more often
Customers
- Increased customer satisfaction
- Increased complaints about price (not performance)
- Decreased complaints about violators
Safety
Next Steps
- University of Washington Study completed (Summer 2015)
- Continue to monitor and adjust the pricing algorithm
- May add striping back to specific locations (Like at the toll points)
- Extend the system southbound through major bottleneck (2017)
Questions?
Tyler Patterson
Toll Operations Engineer
206-716-1134 or pattert@wsdot.wa.gov
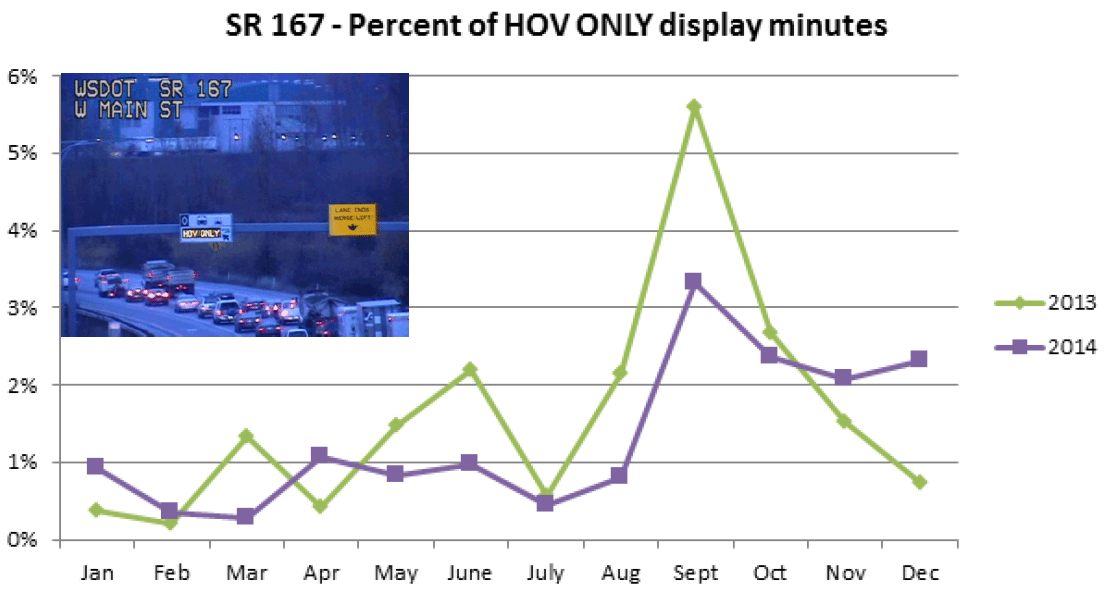
Alternative performance evaluation tools
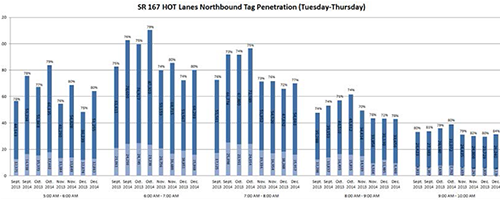
View larger version of the chart

View larger version of the Percent of HOV ONLY display minutes chart