Patrick DeCorla-Souza, Tolling and Pricing Program Manager, FHWA
Lee Munnich, Humphrey Institute, University of Minnesota
Kenneth Buckeye, Minnesota Department of Transportation
John Doan, SRF Consulting
Center for Innovative Finance Support
Federal Highway Administration
First Part of a Webinar Series on Overcoming the Challenges of Congestion Pricing.
Session 1: Congestion Pricing Projects in the San Francisco Bay Area: I-680 Express Lanes and Bay Bridge Time-of-Day Pricing - Webinar
Presenters:
Audience Q&A:
- Addressed after each presentation, please type your questions into the chat area on the right side of the screen
Upcoming Webinars:
- Congestion Pricing Benefits, Challenges and Opportunities, April 7, 2011
- Congestion Pricing Institutional Issues - What They Are and How They Can be Overcome, April 19, 2011
- Email symounj@saic.com to be placed on the webinar notification email list.
You will be notified of the availability of the recording and PowerPoint presentation from this webinar.
Part 1: San Francisco-Oakland Bay Bridge Congestion Pricing
San Francisco-Oakland Bay Bridge Congestion Pricing
Presented by:
Linda Lee, Bay Area Toll Authority
Karen Frick, University California, Berkeley
March 30, 2011
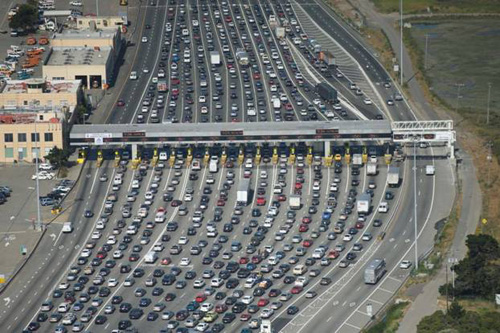
Who is BATA?
- Bay Area Toll Authority (BATA) was created in 1997 by the state Legislature to administer the toll revenue collected on the seven state-owned toll bridges in the nine-county Bay Area.
- In 1998, BATA began operations under the Metropolitan Transportation Commission (MTC) - the transportation planning, financing and coordinating agency for the region.
- BATA has authority to increase tolls on the seven toll bridges to pay for the completion of the Toll Bridge Seismic Retrofit Program.
- BATA operates the ETC system (FasTrak) in the Bay Area.
- Caltrans owns, operates, & maintains the toll bridges.
State-owned Bay Area Bridges
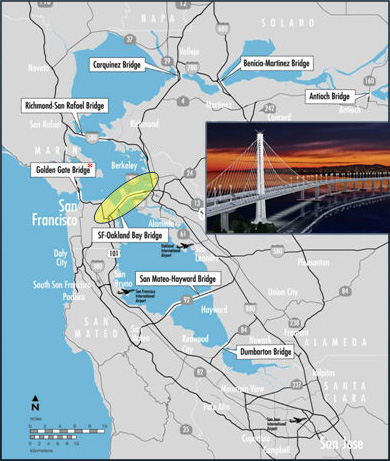
- Antioch Bridge
- Benicia-Martinez Bridge
- Carquinez Bridge
- Dumbarton Bridge
- Richmond-San Rafael Bridge
- San Francisco-Oakland Bay Bridge
- San Mateo-Hayward Bridge
*Golden Gate Bridge owned and operated by the Golden Gate Bridge, Highway and Transportation District (GGBHTD)*
Bay Bridge - At-a-Glance
- Opened: November 1936
- Geometry: 8.4 miles; 5 lanes in each direction
- Toll Plaza: 20 toll lanes; 3 freeways
- AADT: 125,000 veh/day (westbound only)
- Carries 1/3 of the combined traffic of all 7 bridges
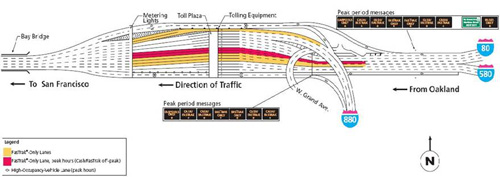
Toll Plaza Configuration
Congestion Pricing Study 1996
- The nation's first ISTEA-funded congestion pricing study in the 1990's.
- Region proposed a $3 peak period toll in the morning and evening peak periods; pricing revenues to fund primarily transit improvements and support a "lifeline" toll discount.
- If approved, FHWA would have committed $23.5 million to fund a pilot program.
- Bay Bridge toll increase required legislative authorization.
- Final proposal never made it to the state legislature.
- Legislature reluctant to support any proposal perceived as a tax increase.
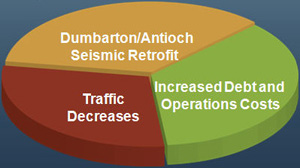
Major Reasons for 2010 Toll Increase (effective July 1, 2010)
- To fund seismic retrofits of Dumbarton and Antioch bridges
- To help offset the increased cost of debt financing
- To counter revenue decreases caused by a decline in toll-paying traffic over the past several years
(About $160 million in new annual revenues is needed)
Toll Revenue Options
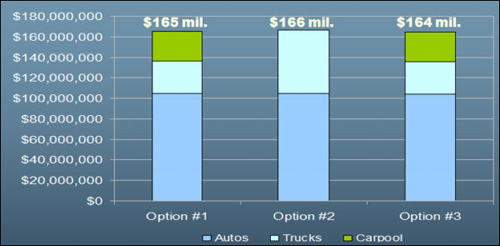
Current - $4 for autos (24/7); $0 for carpools; about $2 per axle for trucks.
Option #1 - $5 for autos (24/7); $3 for carpools; $6 per axle for trucks.
Option #2 - $5 for autos (24/7); $0 for carpools; $10 per axle for trucks.
Option #3 - 6 Bridges: Same as Option #1; Bay Bridge: $6 for autos in peak and $4 for autos in non-peak (M-F), $5 for autos on weekends.
Why Charge a Carpool Toll?
| Agency (Facility Type) |
Cash Toll |
Charges for Carpools? |
Carpool Toll |
Occupancy |
| BATA (Bridges) |
$4.00 |
No |
$0 |
3+/2+ |
| GGB (Bridge) |
$6.00 |
No |
$0 |
3+ |
| MTA Verrazano Narrows (Bridge) |
$11.00 |
Yes |
$2.56* |
3+ |
| PANYNJ (Bridges/Tunnels) |
$8.00 |
Yes |
$2.00* |
3+ |
| TCA (Toll Road) |
$5.50 |
Yes |
$5.25 |
- |
* Must use staffed lanes and meet enrollment requirements
- Most other toll roads surveyed do not have reduced rates for carpools.
Why Congestion Pricing on Bay Bridge?
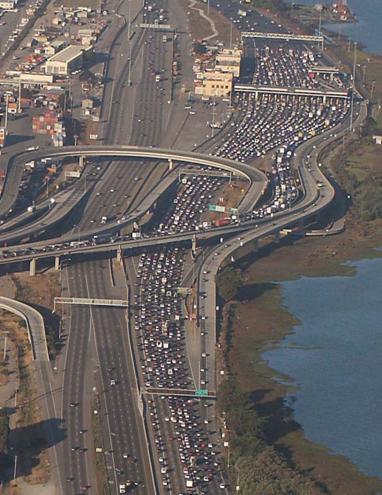
- Most congested travel corridor in the Bay Area (about 25-35 mins of delay between 7:00am and 8:00am)
- Good existing transbay transit options: Bay Area Rapid Transit (BART), buses and ferries
- Good carpool access approaching the bridge.
- Excess demand creates congestion throughout peak period
- Reduce the number of vehicles crossing during peak periods by changing travel behavior
What About Other Bridges?
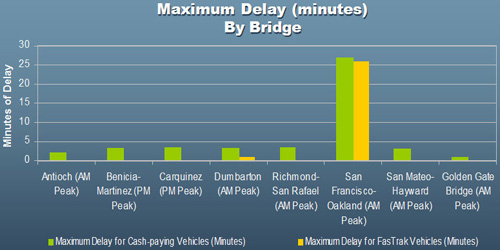
- Only the Bay Bridge toll plaza experiences significant peak period delay.
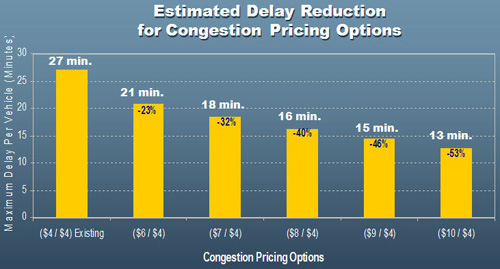
Bay Bridge Congestion Pricing Impacts
Public Outreach
4 Public Hearings conducted in Nov/Dec 2009:
- Oakland
- San Mateo
- Concord
- San Francisco
Comments Received:
| Type |
Comments Received |
| Public hearing comments |
43 |
| Letters and E-mails |
300 |
| Web survey responses |
783 |
| Total |
1,126 |
Web Survey:
- 783 responses: 63% opposed charging a toll for carpools
- 60% supported congestion pricing on Bay Bridge
- 50% supported higher tolls for trucks
Adopted Congestion Pricing Program
Toll Schedule
- Peak hour toll rate: $6
- Non-peak hour toll rate: $4
- Peak hours are from 5 a.m. to 10 a.m. and from 3 p.m. to 7 p.m. (same as current carpool hours).
- Congestion pricing is only applicable to 2-axle vehicles.
Evaluation
- Annual evaluation report to be provided to the Commission:
- Traffic
- Travel time savings
- Mode shift
- Impacts on non-peak travel
- Impacts on other facilities and transit services
- Motorist Feedback
- Public awareness, acceptance and affordability
- Operations
Adopted Toll Schedule
| Vehicle Class |
Previous Toll Rates |
New Toll Rates
Effective 7/1/10 |
| 2-Axle |
$4.00 |
6 Bridges: $5.00 (24/7)
Bay Bridge: $6.00 peak
$4.00 non-peak
$5 weekend |
| 3-Axle |
$6.00 |
$15.00 |
| 4-Axle |
$8.25 |
$20.00 |
| 5-Axle |
$11.25 |
$25.0o |
| 6-Axle |
$12.00 |
$30.00 |
| 7+-Axle |
$13.50 |
$35.00 |
| Carpool |
$0.00 |
$2.50
(FasTrak required) |
Implementation Activities -
Infrastructure
Improvements
- Installed new signage
- Fixed panel signs at toll plaza and approaches
- Additional changeable message signs (CMSs) at toll plaza
- Installed digital clocks inside toll booths
- Modified toll collection system for time-of-day charging
- Installed toll equipment in carpool lanes
Infrastructure Improvements
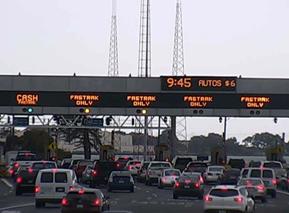
Weekdays - Peak Period
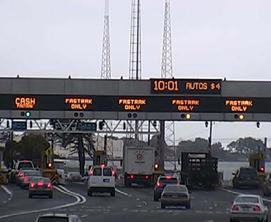
Weekdays -Off-Peak Period
Public Information & Outreach
- Carpool Toll banners
- Toll booth posters
- Toll booth handouts
- Portable CMSs
- Website (www.mtc.ca.gov/tolls/)
- Public outreach: major employers, casual carpool sites
- Press releases
- E-mail blasts to FasTrak customers
- 511 phone floodgate messages
- Promotion to increase FasTrak sign-ups
Lessons Learned/Challenges
- Antiquated toll system made fare table changes difficult
- Installation of canopy clocks were useful, but problematic:
- eliminated potential for arguments by motorists at time of rate change
- created slow-downs and illegal parking in shoulders by motorists waiting for rate to change
- Minimize motorist confusion by making Congestion Pricing hours match current carpool hours
- Public Outreach; public confusion related to:
- purpose of toll increase
- multiple messages related to multiple changes
- toll tag requirements for carpool tolling and need to get FasTrak
Preliminary Findings (as of Dec 2010)
Bridge Traffic Volumes
Average Daily Traffic (weekday)
(Jul-Oct 2010 compared to Jul-Oct 2009)
| |
Pre Toll Increase
(Jul 1 - Oct 31, 2009) |
Post Toll Increase
(Jul 1- Oct 31, 2010) |
Vehicle Difference |
| |
Full Fare |
Carpool Discount |
Total |
Full Fare |
Carpool Discount |
Total |
Full Fare |
Carpool Discount |
Total |
| Antioch |
6,227 |
414 |
6,641 |
5,892 |
494 |
6,386 |
(335) |
80 |
(255) |
| Benicia |
51,495 |
2,353 |
53,847 |
52,538 |
1,481 |
54,019 |
1,044 |
(872) |
172 |
| Carquinez |
53,574 |
4,603 |
58,177 |
53,448 |
3,092 |
56,539 |
(126) |
(1,511) |
(1,637) |
| Dumbarton |
26,285 |
5,187 |
31,472 |
27,521 |
3,306 |
30,827 |
1,236 |
(1,881) |
(645) |
| Richmond |
34,155 |
1,881 |
36,036 |
34,664 |
1,247 |
35,911 |
510 |
(635) |
(125) |
| SFOBB |
112,150 |
17,981 |
130,131 |
112,715 |
13,075 |
125,789 |
564 |
(4,906) |
(4,342) |
| San Mateo |
40,011 |
6,242 |
46,252 |
42,164 |
4,559 |
46,723 |
2,153 |
(1,683) |
471 |
| Total |
323,896 |
38,661 |
362,557 |
328,941 |
27,254 |
356,195 |
5,045 |
(11,407) |
(6,362) |
- Vehicles in carpool lanes are down by about 11,400 per day on all bridges, representing a 30% decrease.
Transit Ridership
BART Weekday Hourly Transbay Ridership (Westbound Direction)
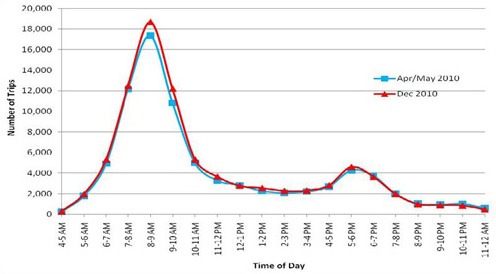
- AM Peak (5-10 AM): +3,600 passengers, or +8%
- PM Peak (3-7 PM): +400 passengers, or +3%
- All Day (4 AM -midnight): +4,600 passengers, or +6%
- Other Transbay transit and ferry remained flat.
Bay Bridge Traffic Volumes (AM Peak)
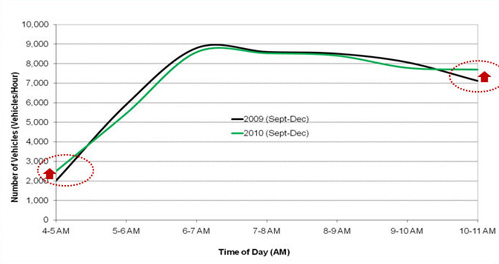
- Since the onset of congestion pricing on the Bay Bridge, there is:
- Slightly more traffic before and after the peak period; and
- Slightly less traffic during the 5-10 AM peak period.
Bay Bridge Traffic Delay (AM Peak)
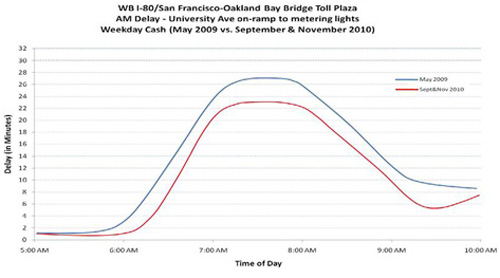
- Maximum delay traveling to the Bay Bridge Toll Plaza has decreased from an average 27 minutes in May 2009 to an average 23 minutes in Sept/Nov 2010, representing a time savings of about 15 percent.
Bay Bridge Operational Observations
- Some vehicles in the cash lanes continue to slow down before 10:00 a.m. and 7:00 p.m. to wait for the toll rate to change from $6 to $4.
- The number of vehicles stopping in the shoulders, just before the toll rate changes to $4, has decreased due to CHP enforcement.
Observations from UC Recruitment Survey of FasTrak and Casual Carpoolers
- 60% say that a car is a necessity for their Transbay trips; 40% do not.
- 22% could change their destination, 27% could choose to change their time of day.
- A "fast, uncongested trip across the Bay" means a lot to 93% of respondents.
- 60% say that a "predictable trip" is more important than how fast the trip is.
Source: UC Recruitment Survey of FasTrak and Casual Carpoolers
(N= 1800 volunteered to participate, 950 completed survey)
Bay Bridge Drivers who did not Pay for Parking at their Destination
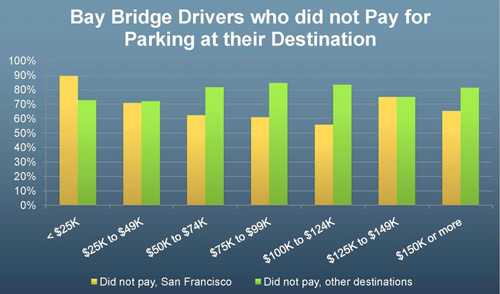
Note: Excludes casual carpool riders (49) and homebound respondents (175). Includes drivers answering "parking is free" or "driver, employer, or someone else paid for parking".
Key Findings from Focus Groups
- Participants did not fully understand purpose of toll increase.
- General attitude: resigned acceptance.
- Few reported making changes in mode choice, but some reported changing the time of travel resulting in peak spreading.
- Those without FasTrak do not know how to get it, what it costs, how to use it; a barrier for some (some cited as a reason for not carpooling).
Source: 7 focus groups held with Bay Bridge solo drivers and casual carpoolers;
10 to 14 participants per group.
Casual Carpooler Focus Groups
- Addition of toll has affected established behaviors - still being worked out.
- Some uncertainty over whether to offer or accept payment.
- Reports of occasional conflicts if rider does not offer to pay or driver asks.
Source: 7 focus groups held with Bay Bridge solo drivers and casual carpoolers; 10 to 14 participants per group.
Preliminary Findings
1) Bridge toll increases of $1 to $2 are small in terms of total cost of transbay trips (typically $15-$30 round trip depending upon distance, parking costs).
2) Additional analyses are needed - factors to be explored include: changes in gas price, the economy, transit service levels and fares.
3) Biggest changes:
- Carpool lane usage.
- Peak spreading occurring. Affects toll plaza operations and departure times for some drivers.
4) Many drivers have access to free or subsidized parking, which affects travel choices; most travelers conduct extensive cost-benefit calculations when comparing options.
5) Casual carpool practices evolving, particularly on payment etiquette (whether to pay and how much).
Contact
Linda Lee
llee@mtc.ca.gov
(510) 817-5825
Karen Frickk
frick@berkeley.edu
Elizabeth Deakin
edeakin@berkeley.edu
Part 2: I-680 Express Lane Federal Webinar
Ray Akkawi, Manager of Project Delivery
Alameda County Transportation
Commission
(Alameda CTC)
March 30, 2011
Area Location Map
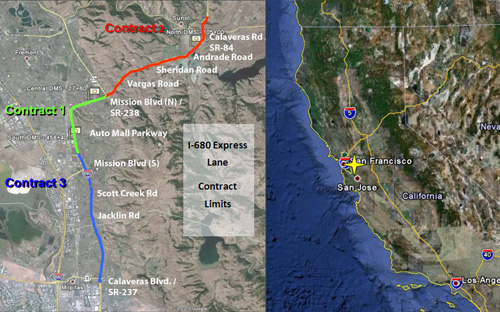
I-680 Express Lane
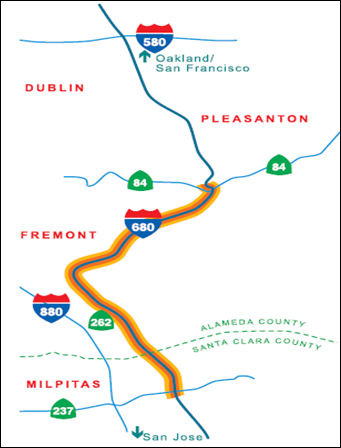
- Bay Area's First HOT Lane Project
- Converts Existing HOV Lane To A Combined HOV / HOT Lane
- 14-Mile Stretch Of Southbound I-680 Over The Sunol Grade
- Starts at Highway 84 in The North and Ends At Highway 237 In The South
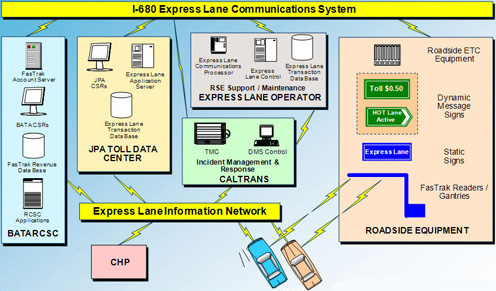
Electronic Toll System Architecture
Lessons Learned
CALTRANS
- Tolling Policy
- Design Standards
- Construction Coordination
- Public Outreach
- Maintenance / Operations
CHP
- Public Outreach
- Enforcement
- Education
- Operations
BATA
- Toll Collection
- Financial Reporting
- Revenue Adjustments
- Customer Service
Public Outreach
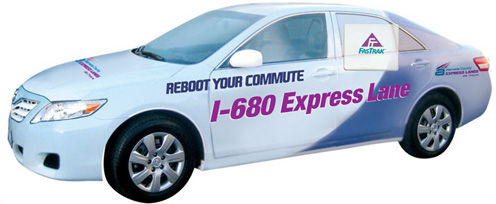
Marketing Campaign
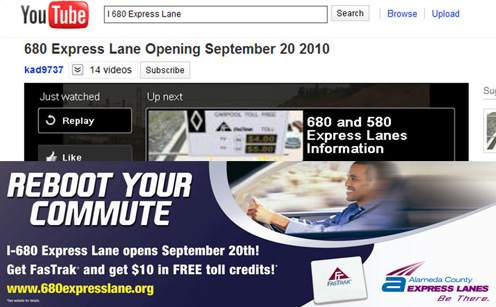
Public Outreach
- Inform Public early / often about the project
- Highlight changes to the facility
- Community workshops
- Website
- Media Briefings
Lessons Learned
Setting Realistic Expectations
- Initial disruption of traffic
- Learning curve for commuters
- Performance of system
- Daily / weekly trip revenue
During Construction
- Coordination of civil and ETS is critical
- Finalize utilities early
- Factory and Systems Testing
Pre-Opening:
- Stagger opening if possible:
- Pre-opening data collection
- Media Briefings
- Contingency Plans
The Plan & The Contingency Plan
Plan
- Sensors and RTMS for speed and volume data
Contingency
- Earthcam provided redundant speed and volume data on independent communication network
Plan
Contingency
- Wireless / Cellular Backup
Plan
- Cellular modems for communication between toll zones
Contingency
Plan
- Fully automated dynamic pricing
Contingency
- Manual adjustments based on field observation
- Fixed rate plan
Part 3: Conclusion
Upcoming Webinars - April 2011
Upcoming Webinars - May through December 2011
- May 26 - Congestion Pricing Equity Impacts
- June 23 - Technology to Enable and Complement Congestion Pricing
- July 28 - Integrating Transit with Congestion Pricing and Increasing Congestion Pricing Acceptance
- August 25 - Economics of Congestion Pricing and Impacts on Business
- September 22 - Best Practices in Parking Pricing
- October 27 - Dynamic Ridesharing and Congestion Pricing
- November 17 - Pay-as-You-Drive Insurance
- December 15 - Results of the Urban Partnership and Congestion Reduction Demonstration Programs.
- Registration will open at one month prior to each webinar.
Additional Outreach Products
- Primers, brochures, fact sheets, and other materials planned for the future to inform about various congestion pricing related topics.
- FHWA Tolling and Pricing web sites:


