Robert Kopelk, Toll Systems Development Manager
Washington State Department of Transportation
April 16, 2019
Agenda
Background & History
Goals
Current Performance
Issues, Solutions & Outcomes
Future Plans
HOV Lane: What was the problem?
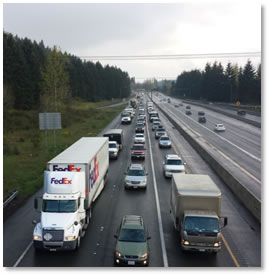
Bad traffic
Drivers on I-405 experienced some of the worst traffic in the state and it was getting worse.
Before express toll lanes, the southbound I-405 HOV lane dropped below 45 mph 200 days out of the year and I-405 HOV lanes were congested 60 percent of weekdays.
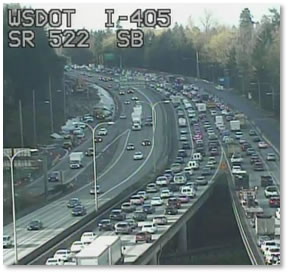
Crowded HOV Lanes
I-405 HOV lanes were not meeting state requirements to operate at 45 mph 90 percent of the time during peak hours.
I-405 HOV lanes were often just as congested as the regular lanes.
Transit Suffers
Congested lanes significantly delayed transit trips and reduced reliability.
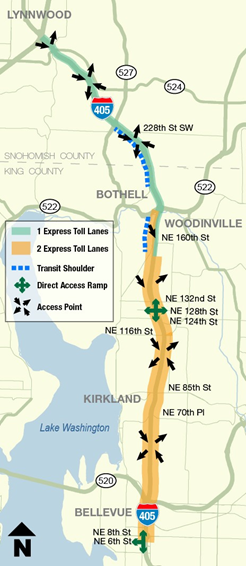
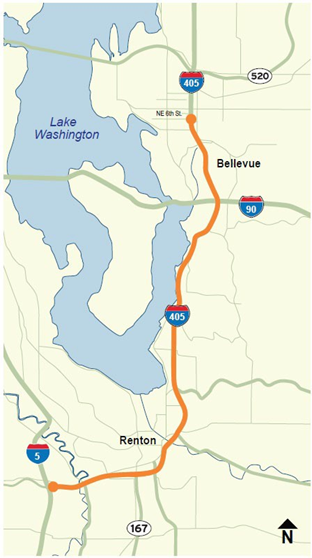
First Express Toll Lane Project - Bellevue to Lynnwood
15 miles of express toll lanes
Toll rates
Minimum toll rate $0.75
Maximum toll rate $10
Carpool policy
To travel toll-free carpools must:
Meet new carpool occupancy requirements
3+ carpools exempt at peak hours
2+ carpools exempt at off-peak hours
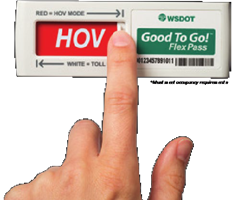
Have a pre-paid Good To Go! account
Have a Good To Go! Flex Pass set to HOV mode
Goals for Express Toll Lanes
Goal #1 - Provide a choice to drivers
Goal #2 - Provide a faster, more predictable trip
Goal #3 - Generate revenue to reinvest in the corridor
Legislative Performance Measures
Whether the express toll lanes generated sufficient revenue to pay for all express toll lane-related operating costs.
$74.9 million in gross revenue with $25 million for O&M
$49.9 million available for reinvestment in the corridor
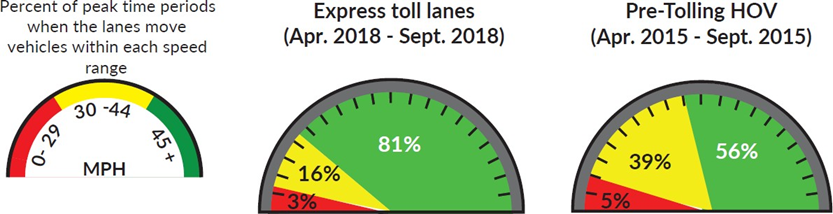
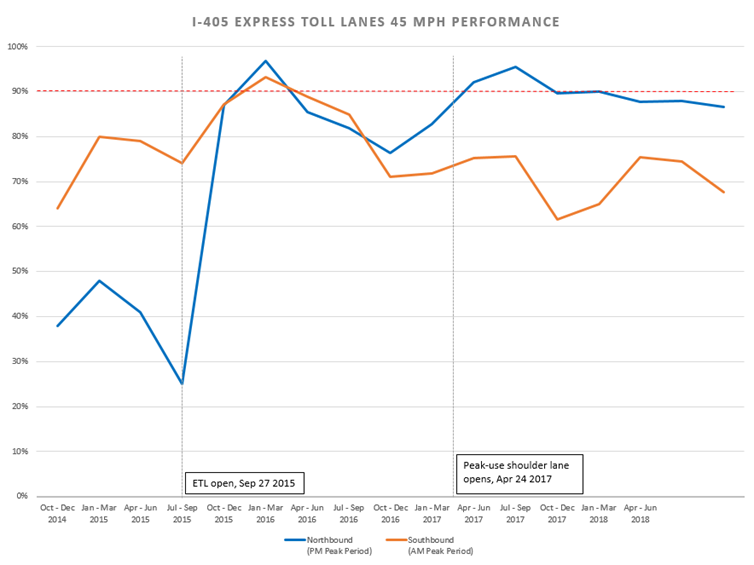
Whether the express toll lanes maintain speeds of 45 miles per hour at least 90 percent of the time during peak periods.
Quarterly Performance
I-405 Express Toll Lanes 45 MPH Performance
Calculating 45mph Metric
Data
Inductive loop speeds, spaced every ½ mile
Weekdays Only - including incidents
Peak-period, Peak Direction
SB (5 a.m. - 9 a.m.)
NB (3 p.m. - 7 p.m.)
Method
Divide the period into 5 minute "bins" (48 bins per direction per day)
Calculate the average speed for each bin
Assign the bin a pass or fail.
Speed >= 45 mph = Pass
Speed < 45 mph = Fail
Find the percent of passing bins
If the system is below 45mph for 20 minutes, we fall below 90%
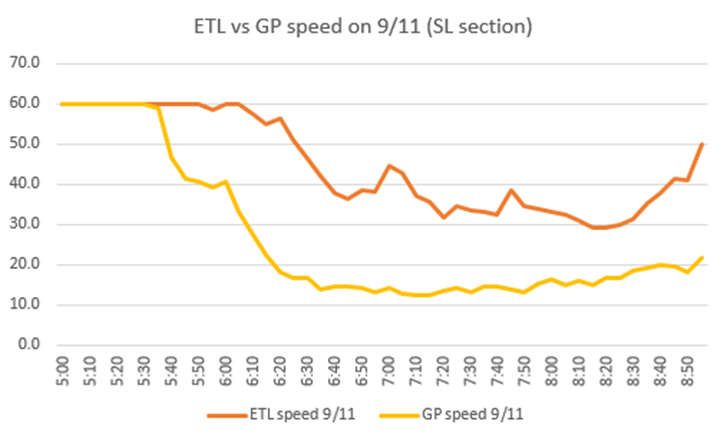
Example
On 9/12 at 8 a.m. there was a blocking incident for 10 minutes in the ETLs, dropping the speeds below the threshold for the remainder of the peak.
12 bins failed, 36 bins passed - 75%
15.06 miles
9/10/2018
9/11/2018
9/12/2018
9/13/2018
5:00 AM
60.0
60.0
60.0
60.0
5:05 AM
60.0
60.0
60.0
60.0
5:10 AM
60.0
60.0
60.0
60.0
5:15 AM
60.0
60.0
60.0
60.0
5:20 AM
60.0
60.0
60.0
60.0
5:25 AM
60.0
60.0
60.0
60.0
5:30 AM
60.0
60.0
60.0
60.0
-
-
-
8:00 AM
58 .0
43 .2
26.2
48.0
8:05 AM
58 .5
42.8
28.3
50.7
8:10 AM
54.6
41.6
33.5
50.0
8:15 AM
57.2
40 .1
32.9
51.9
8:20 AM
56 .5
40 .0
37.9
49.6
8:25 AM
58 .9
40 .5
33.1
51.9
8:30 AM
59 .9
41.9
35.3
50.6
8:35 AM
58 .8
45
36.0
54.9
8:40 AM
59 .8
46.8
38.5
57.7
8:45 AM
58 .2
49.4
40 .0
58 .4
8:50 AM
59 .7
49.3
42.1
55 .8
8:55 AM
600
54.7
44.2
58.5
Passing
48
33
36
47
Metric (percentage):
100%
69%
75%
98%
Issues
Popularity of the lanes is high and growing
Violators keep using the lanes and are immune to price
Friction from the congested GP lanes, slow the ETLs
Access to/from the ETLs impacts performance
Toll Rate does not always deter usage
SB Single Lane continues to under-perform
1. Popularity of ETLs
Happy Customers and benefit delivered
86% of customers are happy they have the option to save time by using the lanes
Drivers save an average of 11 minutes vs. the GP lane
Transit ridership is up and travel times are down
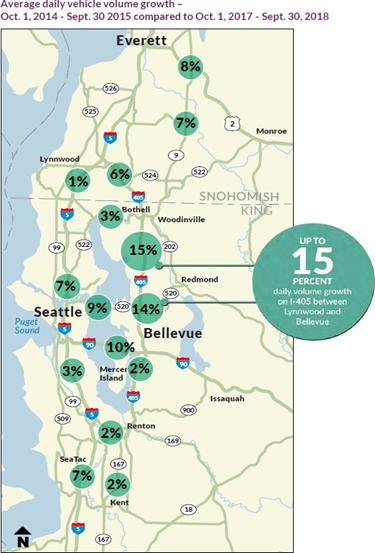
Demand for the ETLs continues to grow.
1,100 people move to the area every week
No planning is required; everyone is welcome to use the lanes
1.5 Million active tags and 860,000 active accounts (FY 2018)
Carpool incentives
Given away 45,000 flex passes to eligible carpoolers
Solutions
Expand the system with both tolled and un-tolled capacity
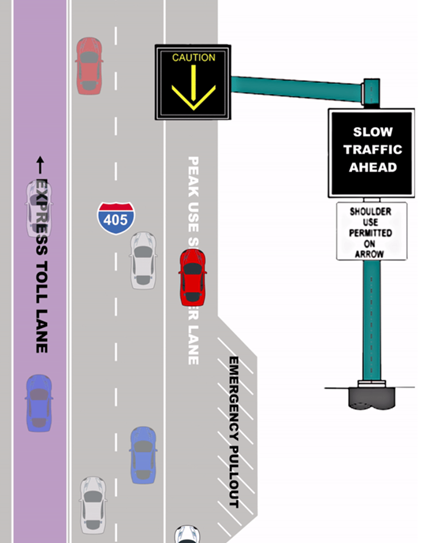
Peak Use Shoulder Lanes at NB SR 527
Opened in April 2017
Extend dual ETLs from SR 522 to I-5
Operate as efficiently as possible
50+ tweaks to the algorithm
Outcomes
Operating the lanes as efficiently as possible
Peak Use Shoulder Lane delivered
Extend the ETLs - planning is underway
Status:
Construction fully funded by express toll lane revenue ($10 million)
Opened to traffic April 24, 2017
Project description
Converted 1.8-mile section of right shoulder to general purpose lane
Generally open during afternoon peak period
Four paved pull-out areas
Built new noise wall
Made improvements to express toll lane signage and access
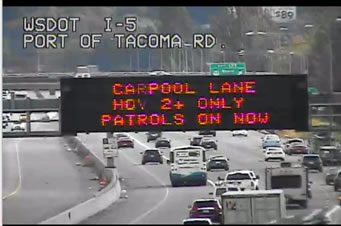
2. Violators
Description
WSDOT estimates that occupancy violations are on the rise throughout the HOV system. The ETLs are no exception.
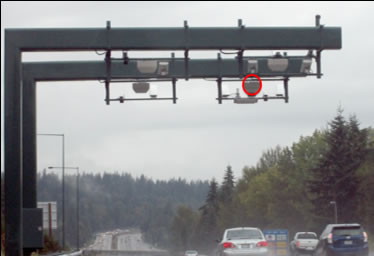
Officers have two ways to identify potential violators
Beacon flash - indicating the vehicle is not paying
Red square on the transponder
Drivers do the math - it is cheaper to violate, get caught occasionally and pay the fine than it is to pay the tolls
Insurance rates are not impacted as a result of HOV violations
Solutions
Continue to pay overtime to WSP for additional enforcement
Employed multiple enforcement techniques
Roving vs. Stationary Patrols
Concentrated vs. Dispersed (location)
Emphasis Patrols vs. Spread (timing)
Team vs. Solo
Marked vs. Unmarked patrol vehicles
HOV Emphasis Patrols region wide with signing and media
Graduated penalties (proposed as agency request legislation)
Researching automated occupancy detection
Outcome
We continue to face challenges with violators and look for potential solutions.
3. Friction with GP Lanes
Description: "Sympathy Slowing"
Depending on the horizontal spacing between the GP lanes and ETLs, drivers feel uncomfortable with a sizable speed differential.
Speed differential rarely exceeds 20mph under the best conditions
Lane buffer is 2 to 4 feet
3. Friction at SR 527 (NB)
Description
The NB entrance ramp from SR 527 (1,000 vph) created a merging problem that slowed the GP traffic significantly. This slow-down in the GP lanes slowed the ETL traffic as well.
Solution
Adjusted the algorithm multiple times to increase the toll rate in an attempt to decrease the number of vehicles in the lane.
In April 2017, the Peak Use Shoulder Lane (PUSL) was implemented and paid for by revenue from in the ETL. (Also implemented an access improvement.)
Outcome
The algorithm changes were successful in raising the toll rate, but were not successful at reducing the congestion in either the GP lanes or the ETLs.
Performance improved dramatically with the opening of the PUSLs. The NB Single Lane Section went from 72% to 90% performance, comparing the quarter before and after the opening.
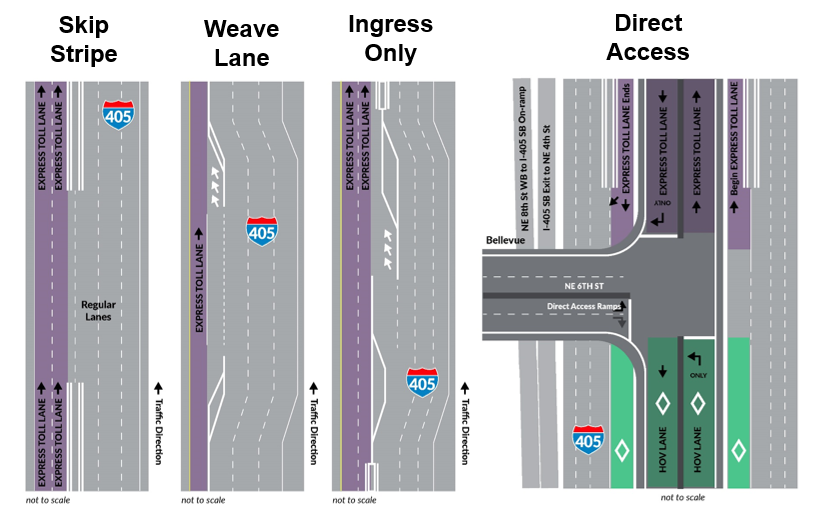
4. Access
Description
The ETL system is buffer separated with pavement markings (width 2-4')
System implemented with 4 types of designated access points:
Skip Stripe (2,000' - almost 6,000' long)
Weave Lane
Channelized Ingress
Direct Access Ramp
Additional congestion around access points
Concentrating these movements exacerbates the problem
Some original access areas were near minimum distance
ETL users wanted to get into the system sooner
*** Lesson Learned from SR 167 - an open access design increases the impact of friction with the GP lanes
Solution
Extended the access length at 8 different access points by removing temporary tape used for lane markings.
Anticipated these potential adjustments and were able to react quickly
Outcome
The access adjustments successfully reduced the queuing and backups at most locations, but did not solve all of the problems. The vehicles entering the lanes at SR 520 (northbound) and those exiting at SR 527 (northbound) presented unique problems.
Lessons learned/confirmed -
Vehicles exiting will stay in the ETLs as long as possible (exit late)
Vehicles entering the ETLs will enter as soon as possible (enter early)
Need to strike balance between not enough and too much access
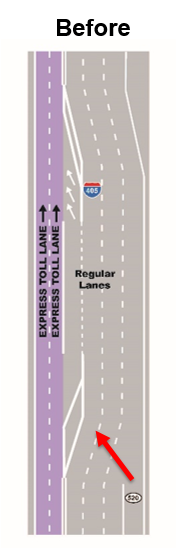
4. Access at SR 520 (NB)
Description
SR 520 interchange is a freeway-freeway interchange.
The interchange with SR 520 increases the GP volume and access to the ETLs requires a merge across 3 lanes of traffic.
The original access point north of SR 520 was a weave lane.
Predominately an ingress location
Incoming ETL traffic came from both downtown Bellevue and SR 520
Bottleneck existed between SR 520 on-ramp merge location and ETL weave lane access
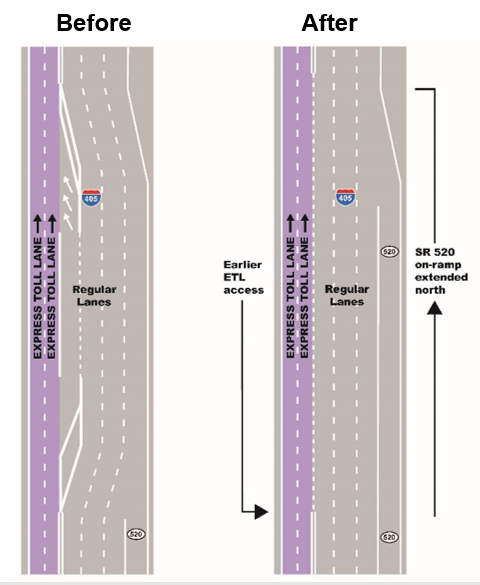
Solution
Changed weave lane access to skip stripe access and lengthened access point to almost 6,000'
Overlapped SR 520 on-ramp lane and access point
Outcome
Resolved customer complains about the limited access.
Reduced the slow down in the GP lanes
More evenly distributed the vehicles entering the ETL
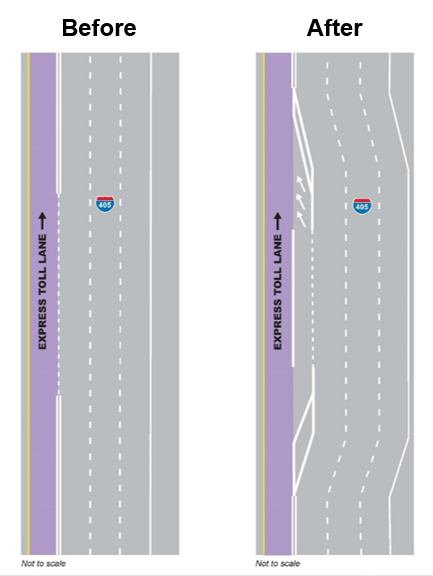
4. Access at SR 527 (NB)
Description
Originally a skip stripe access
Predominately an egress location
Exiting vehicles caused a slow down in the ETLs
Vehicles waited until the end of the access point to exit, couldn't find a gap in the GP traffic and slowed down in the ETL, impacting the speeds in the ETL
Solution
Changed to weave lane access
Done concurrently with PUSL
Outcome
Exiting vehicles now looking to maximize their time in the ETL don't impact the ETL drivers
4. Access - Pros and Cons of Each Access Treatment
Access Type
Pro
Con
Weave Lane
(Includes Channelized Ingress)
Better ETL operations, especially at locations with large exiting volumes and GP lane congestion
Requires larger footprint, impacts, cost
Greater difficulty to adjust after implementation
Skip Stripe
Better suited for locations with closely spaced interchanges and widening constraints
Easier adjustment after implementation
If slow GP lane speeds, greater impact on ETL operations at the access point
Direct Access
Directly serves local arterials from the ETLs
No weave across GP lanes
Direct access on-ramps can introduce upstream congestion with merge
Over saturation of direct access off-ramps could queue back to ETLs
Cost
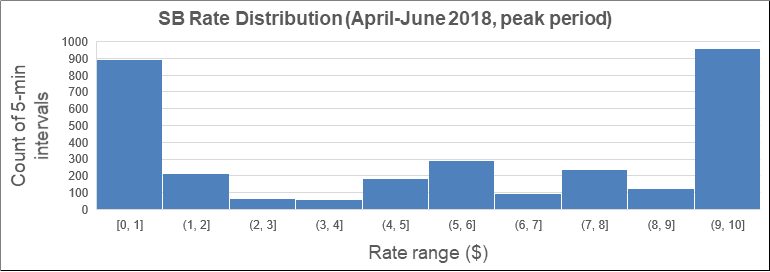
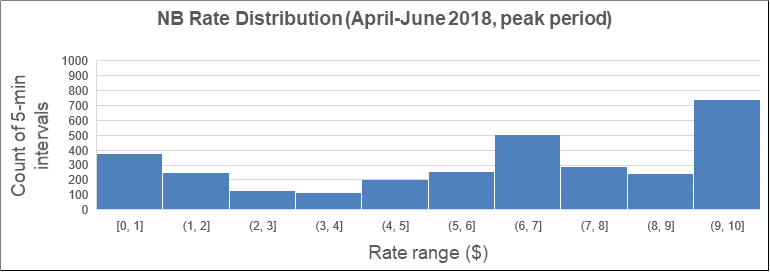
5. Toll Rate
Description
Despite all the design, policy, and other issues, the toll algorithm is programmed to be able to adjust quickly enough to be able to keep the speeds at 45mph.
Solution
The toll algorithm is designed, owned and operated by WSDOT
Uses the worst 5 segments for each trip to calculate a unique toll rate for each entrance to each zone.
50+ adjustments to the algorithm
Outcome
The max toll rate ($10) is reached on average 64% of weekday peak periods, but customers continue to buy into the lanes.
Once the max toll rate is reached, we lose the ability to manage demand.
5. Toll Rate - 128th Direct Access (SB)
Description
Vehicles entering from 128th Direct Access create congestion as the merge onto the system.
The vehicles enter as a platoon and the volume has increased
Solution
Change business rule to allow for increased tolls (a surcharge) for vehicles entering at this unique location
Outcome
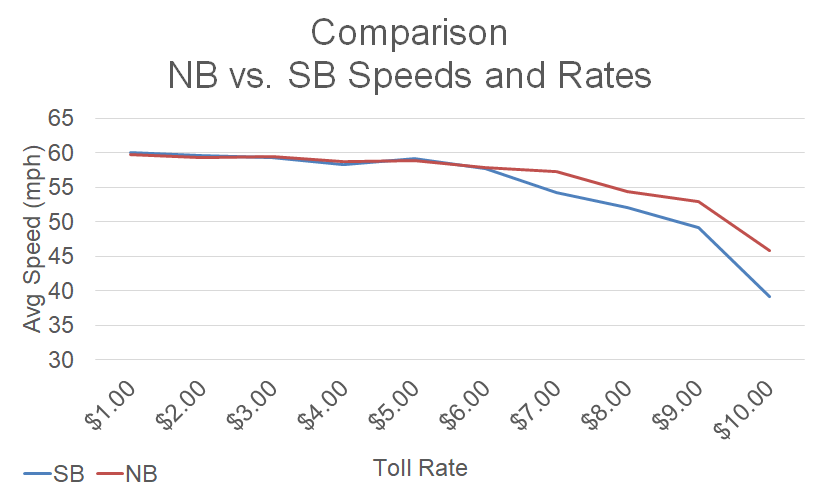
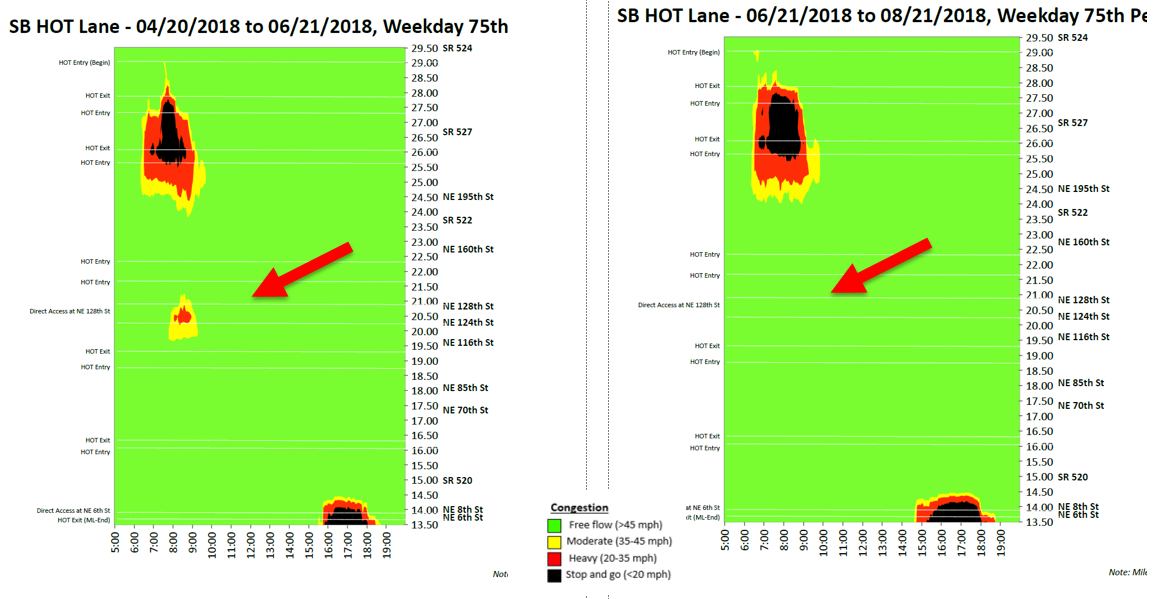
6. SB Single Lane
Description
The performance of the SB single lane section is the primary reason that the system is unable to meet the performance metrics.
The ETL volume before the SR 522 interchange increased 42% compared to before tolling.
The toll rates reach the maximum daily and still drivers continue to enter the system.
The incoming vehicles from SR 527 merge across both lanes.
Solutions
Concentrate enforcement on the area
Increased the sensitivity of the toll algorithm
Changed the calculation of the pricing at SB3
Increase the capacity
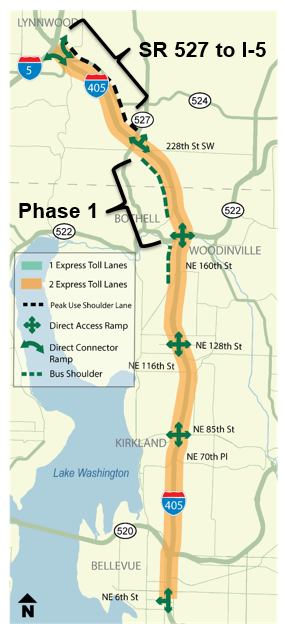
Future Plans - Adding Capacity
Lanes
Complete dual express toll lane system between SR 527 and I-5
Ramps
Direct Connector Ramps NB & SB at I-5
Benefits
SR 522 direct access ramps
SR 527 inline station direct access ramp
Improves express toll lane performance between SR 522 and I-5
Further improves speed and reliability of BRT and transit
Phasing
Phase 1: SR 522 to SR 527
SR 527 to I-5
Phase 2: Direct Connector to/from the north
Phase 3: Direct Connector to/from the south
Complete Lane
Future Plans - I-405 Extension
Project Overview
Extend ETLs between existing SR 167 HOT lanes and I-405 Express Lanes in Bellevue
Will connect a 40-mile system of express toll lanes that improves speeds and trip reliability
Supports the new I-405 Bus Rapid Transit system
Summary
Managing congestion and meeting performance requirements is challenging
No 'silver bullet' exists to solve congestion related issues
Taking an iterative approach to implementing solutions when funding is available, allowed for greater understanding of what works, what doesn't and why
Reaching out to others for new ideas and perspectives goes a long way
Questions?
Robert Kopelk, Toll Systems Development Manager
Washington State Department of Transportation KopelkR@wsdot.wa.gov
Presentation B: I-85 Express Lanes
Annie Gillespie, PE
Director of Engineering
April 16, 2019
I-85 HOT Lanes
Agenda
Background
Performance
Rate History
Takeaways
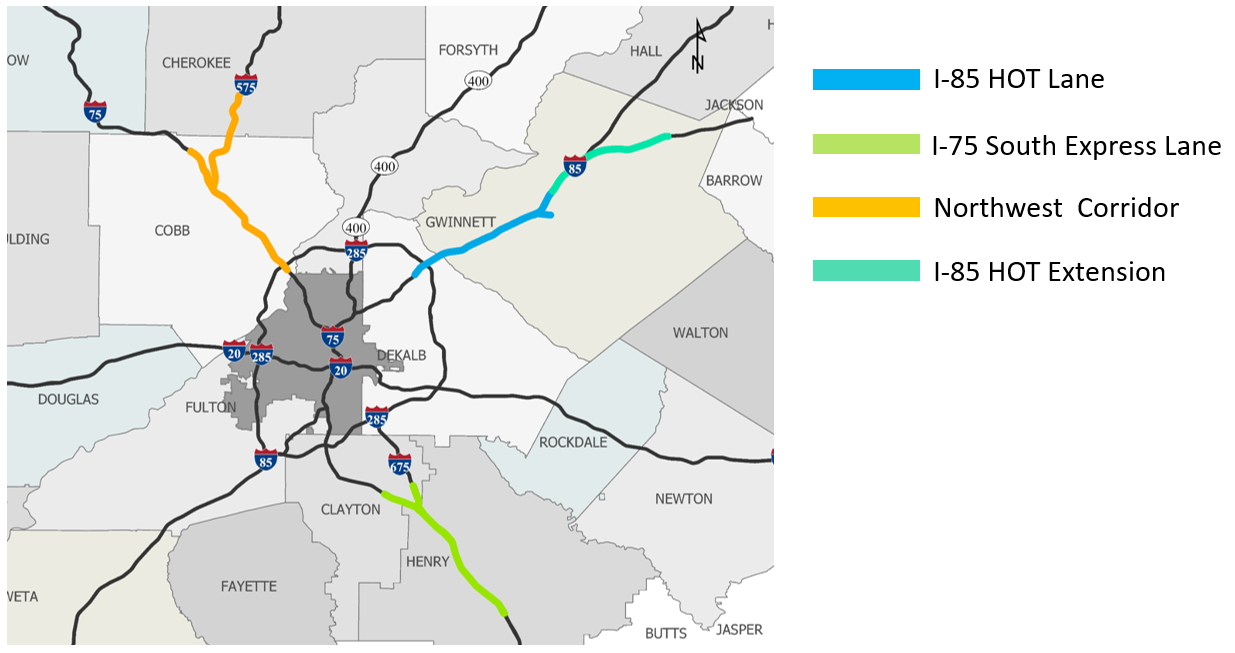
Express Lanes in Georgia
I-85 HOT Lanes
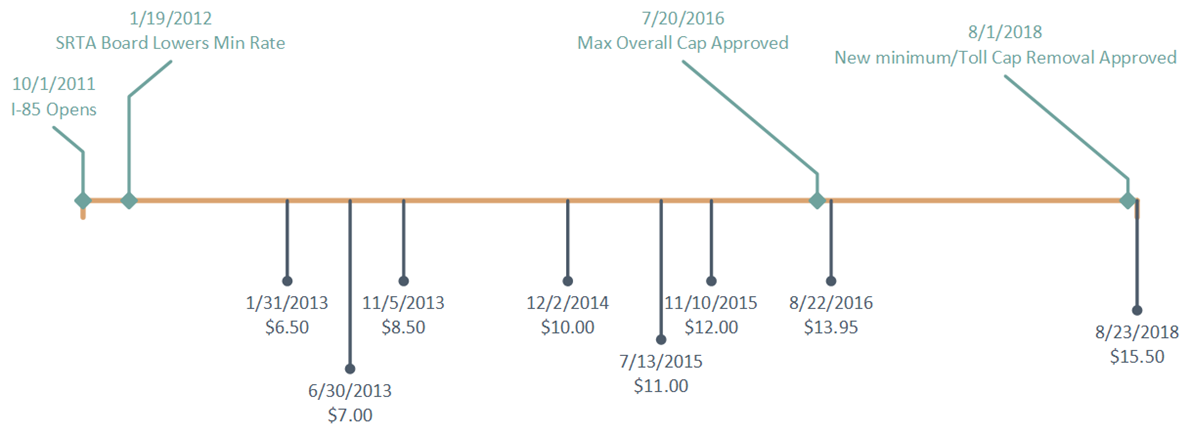
Opened October 1, 2011
Conversion from HOV2+ to HOT3+
15 miles
1 bidirectional, buffer-separated lane
Operates 24/7
Exempt from tolls:
HOV3+
Transit Vehicles
Alternative Fuel Vehicles
Motorcycles
Dynamically priced between
$0.10/mile and $1.30/mile
Lowest Toll = $0.20
Highest Toll = $15.50
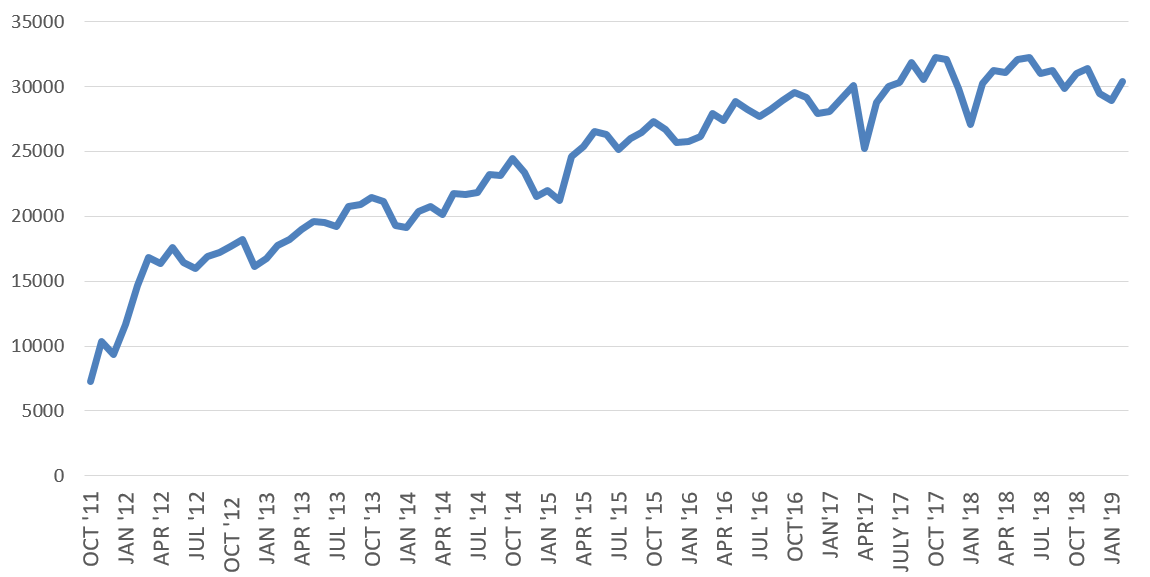
Weekday Average Trips
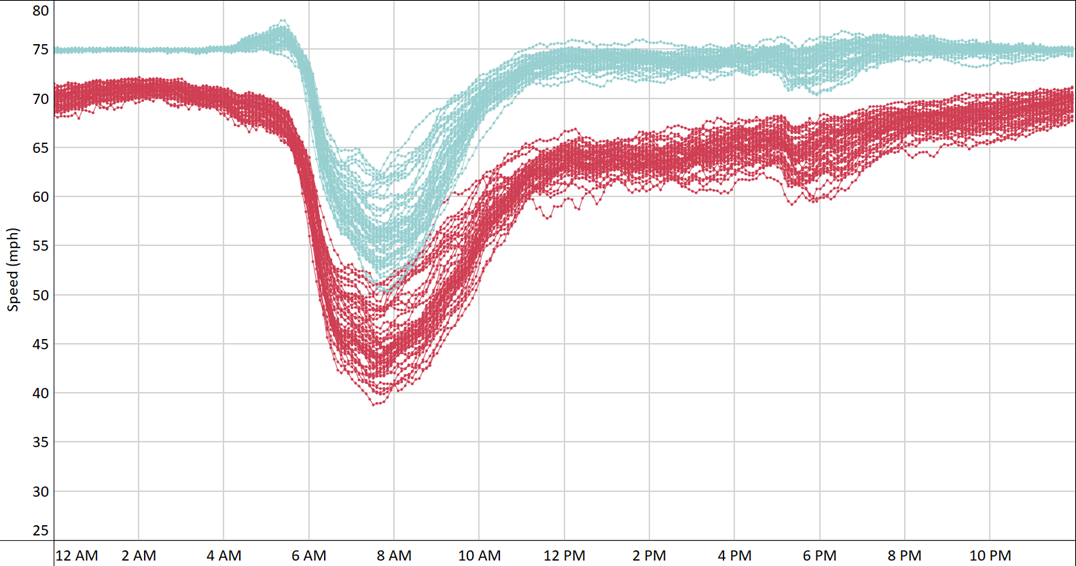
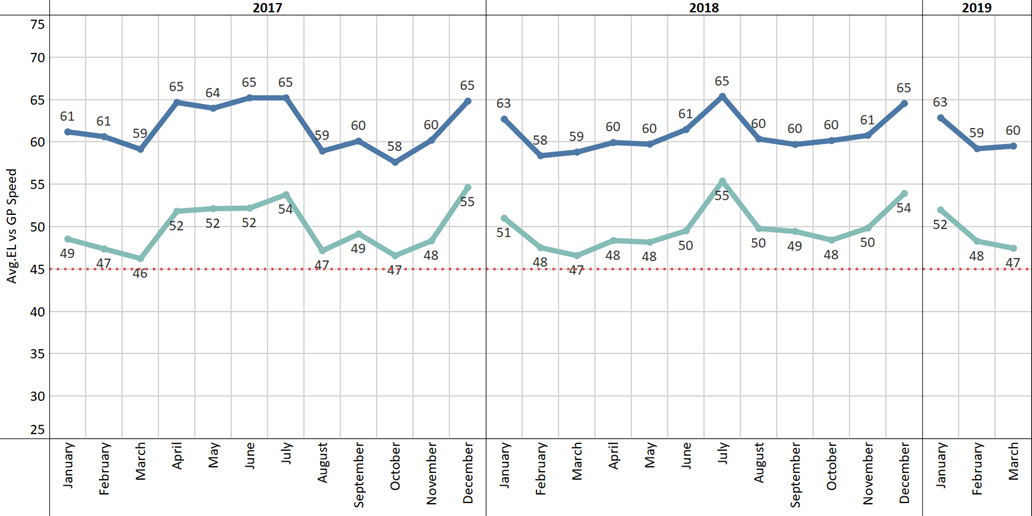
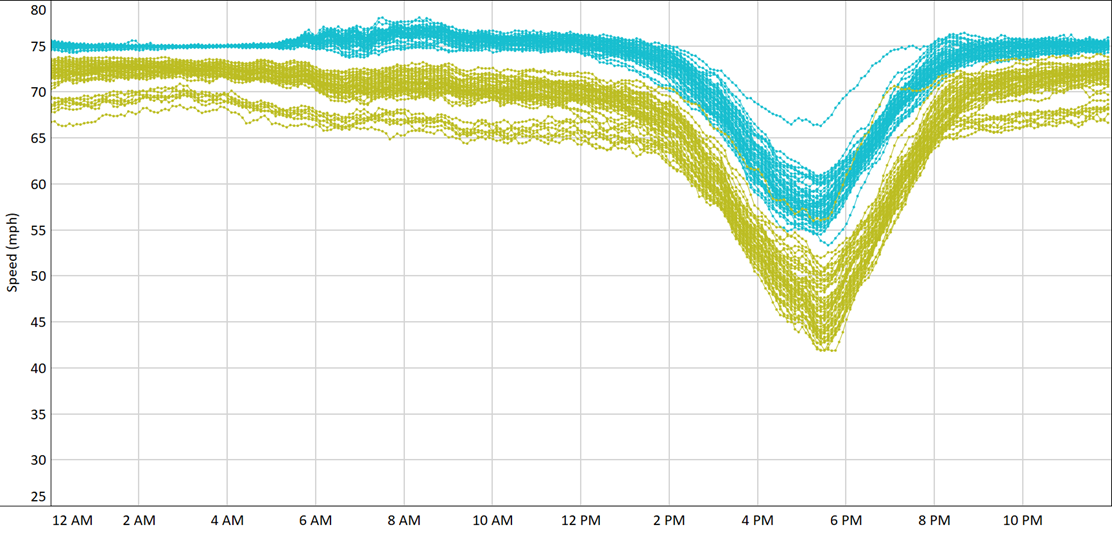
Southbound Average EL vs GP Speed (M-F)
Southbound Average EL vs GP Speed
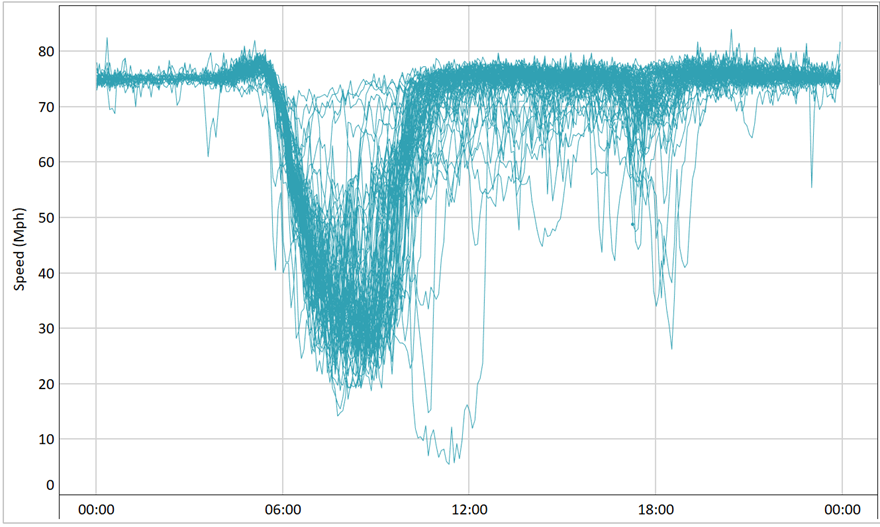
Southbound Average EL Speed Most Congested Segment M-F (6-10am)
Northbound Average EL vs GP Speed (M-F)
Northbound Average EL vs GP Speed
Weekday Average Trips
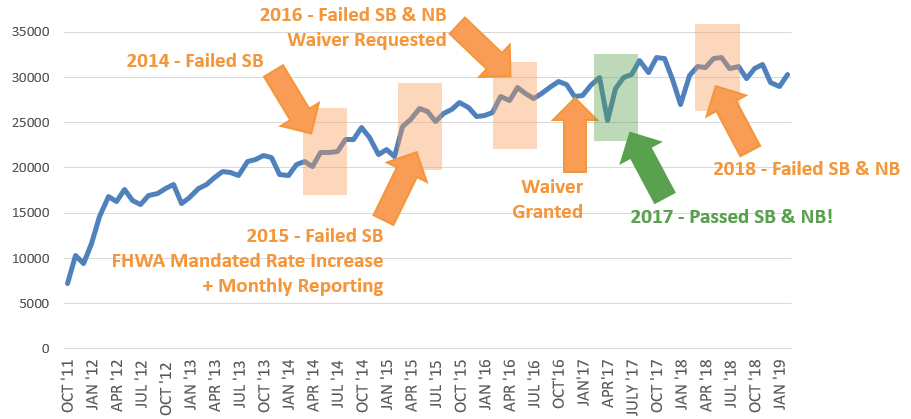
FHWA Waiver
Demonstrated improvements and toll increases
Case for "best interest of the traveling public"
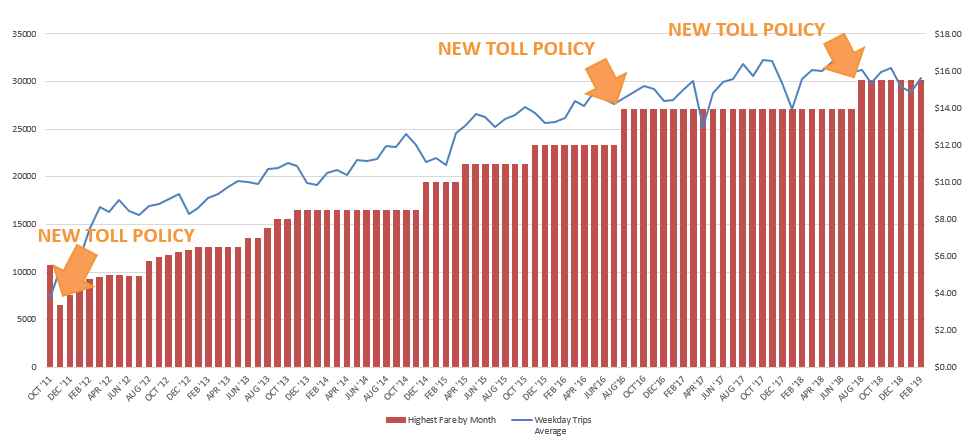
Rates and Trips have been going up
Friction with adjacent lanes impacts possible speed
Maintaining better reliability and average speeds than GP
Looking for other ways than price to improve performance
I-85 Pricing Milestones
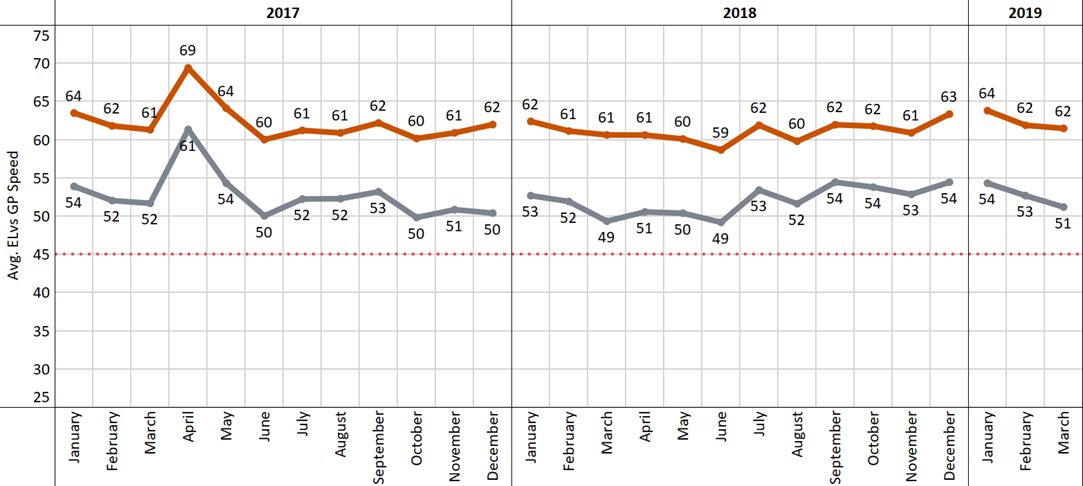
Highest Fare by Month
I-85 HOT Lanes - Takeaways
Increasing Peak Tolls
Increased duration of peak (moved users to shoulders)
Very little immediate reaction
Peak volumes have not decreased
Increasing users in "non-toll mode"
Increasing Off-Peak Tolls
Higher Violation Rate
Largest trip increases
Thank You
Annie Gillespie, PE
Director of Engineering
State Road and Tollway Authority agillespie@srta.ga.gov
Presentation C: Metro ExpressLanes - I-10 HOV 5+ Pilot
Managing Congestion in Priced Lanes
FHWA Webinar, April 16, 2019
Presented by Robert Campbell, LA Metro
Board Motion and Response
I-10 ExpressLanes Pilot that increases the toll-free occupancy requirements to vanpools and transit vehicles only, as a means of preserving the ExpressLanes as a fast, reliable travel option for transit users and all corridor travelers.
Motion by Director Fasana, amended by Director Solis, from April 2018.
Board authorized development of an implementation plan for this pilot in January 2019.
Current and Proposed HOV Policy
In the I-10 ExpressLanes, the following vehicles travel toll-free:
Current
Proposed
HOV 3+
During Peak Periods
HOV 2+
During Off-Peak Periods
HOV 5+
At All Times
Historical Context
1973:
Facility initially opens as a busway.
1974:
HOV3+ vehicles temporarily allowed in busway during a 3- month transit strike.
1976:
HOV3+ vehicles allowed to use busway during peak periods.
1981:
HOV3+ vehicles allowed to use busway at all times.
2000:
HOV2 vehicles allowed to use busway during non-peak periods.
2013:
Busway converted to ExpressLanes.
I-10 ExpressLanes Performance Challenges
58% increase in ExpressLanes trips
---
from 10,093,413 in FY14 to 15,924,317 in FY18
201% increase in HOV-Only minutes
---
from 1,101 in FY14 to 3,314 in FY18
12.5% decrease in AM Peak ExpressLanes speeds
---
from 60.8 mph in FY14 to 53.2 mph in FY18
Additional I-10 travel time has been added to the Metro Silver Line schedule to keep buses on time.
Up to 19% of Foothill Transit Silver Streak buses operate behind schedule.
Significant proportion of traffic mis-representing vehicle occupancy to improperly obtain toll-free travel.
Potential Impacts of Implementing Pilot
Overall mobility benefit of approximately $3.7 million per day in time/delay cost savings corridor-wide.
Increase in ExpressLanes person-throughput by 600 persons/day (a 4% increase for ExpressLanes throughput)
Increase in end-to-end travel times in the general-purpose lanes by 4 minutes on average.
Increase in congestion of the eastbound I-10 ExpressLanes at the end of the facility due to forced merging into the general-purpose lanes.
Improvements in transit travel time reliability, based on qualitative evaluation by subject area experts.
Provision of a more long-term sustainable toll strategy that is less susceptible to congestion - especially congestion caused by vehicles that mis-represent occupancy.
Impacts to Low-Income Commuters
Survey findings from 479 low-income commuters on I-10
Very few (3%) have ever used a vanpool on the I-10 ExpressLanes.
Approximately 50% currently use the I-10 ExpressLanes.
Under the proposed pilot, respondents indicated they would do the following:
Would use the ExpressLanes
Would use the
General Purpose Lanes
As SOV/HOV
As transit
As vanpool
Current ExpressLanes Users
41%
13%
21%
23%
Current General Purpose Lane Users
18%
5%
17%
56%
Vanpool Program
Vanpool programs generally
require participants to lease vehicles with seating capacity of at least 7 persons. This is a potentially significant barrier to participation.
To facilitate vanpool participation, staff
recommended that the occupancy threshold for toll-free passage be set to 5 persons per vehicle.
Staff is exploring strategies to further incentivize vanpooling for commuters.
Timeframe Considerations
Integration will be required with the new Back Office System, expected to come online by early 2020.
Comprehensive outreach strategy to all customers and corridor users requires substantial time to complete.
Significant lead time required to engage a third-party contractor to verify vanpools & handle toll exemptions.
Before-and-after study requires a considerable data collection period before go-live.
Key Decision Points and Milestones
Obtained concurrence from Caltrans and FHWA
As a condition of concurrence, FHWA requires a before- and-after study and significant public outreach.
- $1.4 M
total anticipated cost
Collect and analyze additional data on
Effects on transit operations
Barriers to ExpressLanes, transit, and vanpool usage
More detailed assessment of low-income impacts
Develop a formal implementation plan and return to the Board with recommendations in 12-15 months.
Optimal method of verifying vanpools and handling toll exemptions through integration with Back Office