Center for Innovative Finance Support
Federal Highway Administration
Third Part of a Webinar Series on Road Pricing Outreach
FHWA - Center for Innovative Finance Support Road Pricing Public Acceptance and Outreach Webinar Mini-Courses
Moderator:
- John Doan, SRF Consulting
Presenters:
- Lee Munnich, Humphrey Institute, University of Minnesota
- Patty Rubstello, Washington State Department of Transportation (WSDOT)
- Charles Howard, Puget Sound Regional Council
- Peggy Catlin, Colorado Department of Transportation (CDOT)
- Patrick DeCorla-Souza, Tolling and Pricing Program Manager, FHWA
Presentation Outline
- Linking Congestion Pricing and Transit (Lee Munnich)
- Tacoma Narrows Bridge, 520 Bridge and SR 167 HOT Lanes in Washington State (Patty Rubstello)
- Integration of Road Pricing into the Puget Sound Regional Council MPO Policy, Planning & Programming Process (Charlie Howard)
- Participant Case Study: U.S. 36 Express Lanes (Peggy Catlin)
- Housekeeping Items & Conclusion (John Doan & Patrick DeCorla-Souza)
Part 1 - Linking Congestion Pricing and Transit
Lee Munnich, Humphrey Institute
University of Minnesota
Lessons Learned
- Political leadership necessary
- Public will support if they can see benefits
- Pricing must work from day one
- Effective outreach, education and marketing are critical for success
- Pricing projects more likely to succeed if linked to transit improvements
Linking Congestion Pricing to Transit
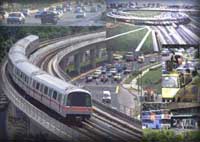 Singapore
- Singapore's road pricing program has grown from a simple cordon charge to over 70 charging points on two cordons, ring road and major arterial roads.
- Singapore invested in an extensive rail and bus transit system for the island country.
- Over 30 years time, public transport's mode share rose from 40% to 67% while incomes rose tenfold
London
- After congestion charging there was 6 percent increase in bus speeds and a 20 percent reduction in wait times at bus stops.
- London experienced a 30 percent transit ridership increase after the congestion charging was implemented, with a four percent modal shift to transit across London.
- Bicycle and power two-wheelers use also increased.
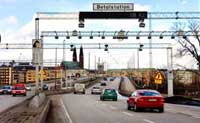 Stockholm
- Stockholm experienced a 22 percent reduction in traffic crossing the cordon during the seven-month trial period.
- Public transit use increased 6 percent during the congestion charge trial, with 4.5 percent attributed to the congestion charge and 1.5 percent due to gasoline prices and external factors.
Minneapolis
- I-35W congestion relief project integrates planning and development linking MnPASS HOT lanes with transit, technology, and telecommuting improvements.
- Expansion of single-bus lanes to two-bus lanes in downtown Minneapolis is expected to nearly triple bus capacity while reducing bus travel time.
- Expanded express transit and bus rapid transit service.
- New eWorkPlace program is promoting telework
New York City
- An important aspect of the NYC proposal was a commitment to dedicate net revenues from the congestion pricing program to fund vital capital improvements to the Metropolitan Transportation Authority's transit system.
- Future potential for congestion pricing in NYC will depend on transit solutions that generate public support.
Part 2 - Tacoma Narrows Bridge, 520 Bridge and SR 167 HOT Lanes in Washington State
Patty Rubstello, Washington State Department of Transportation (WSDOT)
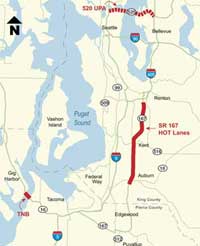 Tolling in Washington Today
- New Tacoma Narrows Bridge opened July 2007
- SR 167 HOT lanes pilot project opened May 2008
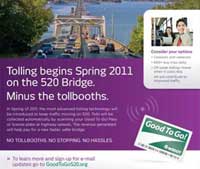
- SR 520 tolling existing bridge scheduled to begin tolling in Spring 2011
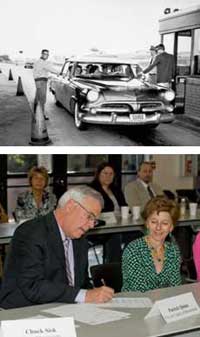
History of Tolling in Washington State
14 bridges financed with bonds and paid for with tolls from the 1930's through the 1980's, including:
- Evergreen Point Bridge (SR 520 in Seattle)
- Two original Tacoma Narrows bridges
- Vancouver-Portland Bridge (I-5)
- Hood Canal Bridge (SR 104)
- First Lake Washington Bridge (I-90)
- Agate Pass (SR 305)
- Maple Street Bridge (Spokane)
Brief Interest in Public Private Partnerships
- PPP legislation allowed for six franchises to be proposed by private parties
- Passed in Legislature unanimously in 1995
- Only one survived - and the state bought out the private developer
- Little taste for PPP today, which could have slowed consideration of tolling somewhat
Tolling in Two Current Corridors
Tacoma Narrows Bridge
- Both toll booths and electronic toll collection
- 75% of traffic using electronic tolls
- 85% of morning commuters have electronic toll accounts
- 14 million transactions per year
- Flat toll rate all day
SR 167 HOT lanes
- All electronic toll collection - no toll booths
- Dynamic pricing based on traffic levels
- Users paid an average of $1.00 to save 10 minutes
- Average of 1,200 vehicles per day pay to use the HOT lanes
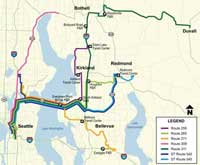
 New SR 520 Bridge
- Critical east-west corridor in need of repair - storm and earthquake dangers
- Carries 115,000 vehicles per day and over 190,000 people per day
- Since later 1990, there has been active discussions about the replacement of the bridge with the addition of HOV lanes between Seattle and Bellevue
- Tolling has been a part of the financing plan along with other state and federal funding
Lake Washington Urban Partnership
Designed to reduce congestion through the "Four T's":
- Transit
- Technology
- Telecommuting
- Tolling
Awarded $154.5 million to assist WSDOT, Puget Sound Regional Council and King County in applying these innovative approaches to reduce congestion in the 520 corridor in Western Washington.
 SR 520 Transit Improvements in 2010-2011
- Add nearly 100 bus trips daily to existing 600 trips in the SR 520 corridor
- Metro working on implementing a new route to serve SR 522
- Make improvements to Redmond and South Kirkland park and rides
- Install real-time information signs at bus stops
- Add new transit shelters and lighting
How SR 520 Tolling Will Work
- All electronic tolls - No Toll Booths
- Good to Go! Pass
- Photo of license plate
- Variable tolls - rate will vary by time of day
- Encourage some people to travel at off-peak hours
- Keep traffic moving
- Pay by the number of axles
SR 520 Tolling Implementation Committee
The 520 Tolling Implementation Committee spent much of 2008 engaging community members and local leaders in the question:
How can tolls work for people who use 520, nearby communities, and taxpayers?
The committee submitted its findings to the legislature and governor on January 28, 2009. Future 520 tolling decisions will be made at the legislature.
2009 Phone Survey Results - Respondents are King County residents
1. Frequency of use of the bridge
- About 20% of the drivers account for 80% of the trips.
- More than one-third (36.2%) reported using the bridge one or more times a week.
- More than one-third (35.4%) reported using the bridge 1 to 3 times per month.
- One-fifth (17.8%) reported using bridge less than once a month but more than two times a year.
- Over half of respondents reported that they drove alone.
2. Demographics of bridge users
- Gender: 44% male, 56% female
- Age: 18-34 year olds (12%), 35-54 year olds (47%), 55 years old+ (38%)
- Income: Less than $30k (9%), $30-55k (12%) $55k-90k (28%), $90k+ (51%)
3. Typical 520 bridge trip purpose
- Recreational: 56%
- Visit family/friends: 37%
- Errands/shopping: 29%
- Work: 19% (but of these 78% use 4 or more days a week)
4. Generating support for electronic tolling
- Top motivating messages regarding electronic tolls:
- Tolls collected electronically, without stopping, at highway speeds
- Account set up online to automatically pay tolls using credit card
- Ability to manage account online
- Top motivating messages on toll benefits:
- Tolls will go directly into dedicated account to build new bridge
- Fairest way to generate revenue
- Tolls will go toward construction of new bridge with two more lanes
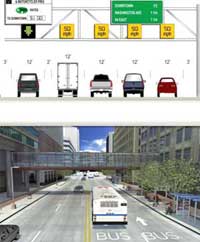
Messaging Focuses on Tolling, But Also Incorporates Other T's
Part 3 - Integration of Road Pricing into the Puget Sound Regional Council MPO Policy, Planning & Programming Process
Charles Howard, Puget Sound Regional Commission
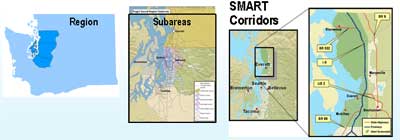
 Four Integrated Strategies
- Land Use
- Supporting a more concentrated development pattern that is more walkable, bikeable, easier to support with transit, and that balances jobs and housing.
- Efficiency
- Efficient transportation starts with fully maintaining and operating a system that is safe, secure and manages facilities to achieve their optimum performance.
- Strategic Investments
- Moves the region from single focused investments to integrated strategies that are more cost effective and support all forms of travel.
- Pricing
- Begins moving from traditional forms of funding to a more sustainable user based funding that improves mobility and the environment.
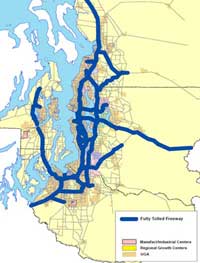
Strategic Investments
Align with Vision 2040
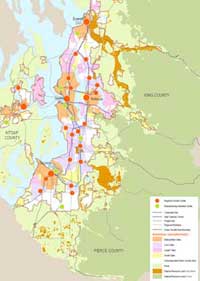 The transportation plan is designed to support the adopted growth strategy.
Transportation 2040:
- 87% of roadway investments are within or directly serve Metropolitan or Core Cities
- Regional transit investments connect and serve all of the 27 designated regional growth centers
- Bicycle and pedestrian facilities designed to support transit and access to centers
Support Regional Economic Strategy
Transportation 2040 is designed to support access to job centers and improve freight movement.
Congestion and Mobility Program
The region has developed a new program to better define, analyze and correct mobility problems.
Congestion Management Process:
- Land use planning (Vision 2040)
- Demand management
- Transportation system management and operations
- Strategic capacity
Aggressive Environmental Program
Transportation 2040 focuses on water & air quality issues in the region.
 Water Quality
- Supports travel reduction, cleaner vehicles and fuels, better treatment of stormwater, and fish passage barriers results in less polluted water in streams, rivers, and Puget Sound
Greenhouse Gas Strategy Complements the Overall State Approach
- Land use: implement VISION 2040
- User fees
- Transportation choices
- Technology: vehicle & fuels
Financial Plan Program
Transportation 2040 calls for a phased funding strategy.
- Funding to maintain and operate our current assets
- Traditional tax financing (gas tax, etc.) will still play a central role especially in the short term
- Gas Tax Replacement in the medium term - VMT fee or other
- There should be a relationship between the tax, fee, or toll and the use of the revenues
- Increase reliance on tolls - phased in over time
- Allow for flexibility in implementation
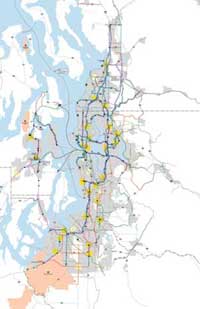
Tolling Implementation Concept - Early Phase
Mid Range Constrained:
- One- and two-lane HOT with fully tolled selected facilities
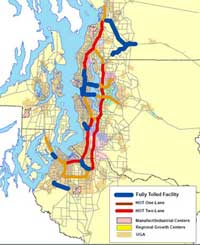
Tolling Implementation Concept - Longer Term
Long Range Constrained:
System-level tolls reflect an improved method (relative to previous alternative analysis) for estimating optimal toll rates.
Sustainable and Fair Funding for Transportation
The plan develops a Sustainable Funding Strategy.
- To raise over $64 billion to support transportation investment (constrained part of the plan)
- Equitable geographically and across incomes
520 Tolling Implementation Committee Public Engagement Charge
Engage citizens on the following topics:
- Funding a portion of the 520 replacement project with tolls on the existing bridge.
- Funding the 520 replacement project and improvements on the 90 Bridge with a toll paid by drivers on both bridges.
- Providing incentives and choices for transit and carpooling.
- Implementing variable tolling as a way to reduce congestion.
Findings from 2008 Tolling Implementation Committee Random-Sample Phone Survey
Most Supported Tolling the 520 Bridge
Three-fifths or more of the respondents supported tolling the 520 Bridge as a means of paying for a portion of the bridge replacement.
Electronic Tolling Increased Support for Tolling
When respondents learned that electronic tolling means vehicles travel at normal speeds through the toll area, a third or more were much more likely to support tolling the 520 Bridge.
Most Supported Early Tolling When They Considered Its Impact on Toll Amounts and Financing Costs
Well more than half supported beginning tolling of the existing 520 Bridge in 2010 when they knew that such early tolling would result in lower tolls and financing costs.
Most Supported Early Tolling When They Considered Its Impact on Travel Speeds
About half supported beginning tolling of the existing 520 Bridge in 2010 when they knew that such early tolling would result in faster travel speeds on the 520 Bridge.
Most Supported Variable Rate Tolling
There was support for variable rate tolling and it was even more appealing
when respondents knew that the toll rates during off-peak times would be
about half of peak toll rates.
Lessons Learned - Communicating About Pricing
- The public knows about tolling to raise funding - not so much about tolling for congestion relief
- The public is actually skeptical about pricing as a congestion relief strategy
- There are few practical examples to point to on tolling for congestion relief
- Maybe the message about pricing needs to evolve with practice
- In the short term, tolling as a funding strategy
- In the longer term, with practice and examples in variable tolling, tolling as a traffic management tool
Part 4 - Participant Case Study: U.S. 36 Express Lanes
Peggy Catlin
Colorado Department of Transportation (CDOT)
U.S. 36 TIGER TIFIA
Challenge Grant Project
Colorado Department of Transportation
 Key Moments in U.S. 36 History
- 1952: Opens as a toll road.
- Sept. 1967: Bonds paid off.
- 2003: EIS begins.
- 2007: Applied for Urban Partnership Agreement.
- 2008: Applied for Congestion Reduction Grant Initiative.
- 2009: Completed Final EIS and Record of Decision.
- Feb. 17, 2010: TIGER grants announced.
- March 1, 2010: Speaker Pelosi highlights corridor.
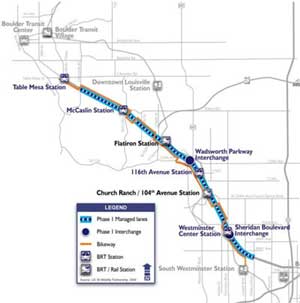
U.S. 36 Project Area
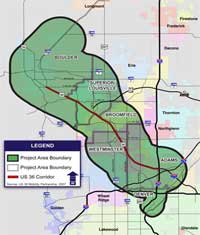
TIGER Grant: Proposed U.S. 36 Managed Lane/BRT Project
- Maximize elements of Phase 1 of Preferred Alternative
- Available funds
- Mobility benefits
- Proposed two packages of improvements:
- $160 million
- $260 million
- Focus on delivering project to Wadsworth Boulevard ($160M scope)
TIGER Grant
- $1.5 billion discretionary Recovery Act program
- Grant program evaluated projects primarily on long term outcomes and job creation/economic stimulus
- 1,457 projects submitted totaling $59.07 billion
- Selected 51 projects nationwide, including U.S. 36
- One of four projects nationwide selected for a TIGER Transportation Infrastructure Finance and Innovation Act (TIFIA) Challenge Grant
- $10 million award
U.S. 36 TIGER TIFIA Challenge Grant
- Enables Colorado to leverage $10 million grant into $50 - $60 million loan
- $10M TIGER grant pays for credit subsidy
- Objective is to extend the impact of federal resources through credit assistance and facilitate projects of national/regional significance
- Challenge grant allows U.S. 36 to get to "front of line" for TIFIA loan opportunity
Major TIGER Requirements
- Minimum loan amount is $50 million
- Dedicated revenues for repayment
- TIFIA contribution limited to 33% of project cost
- For a $160 million project, need $100 million up front
- Need investment grade rating
- Meet applicable federal grant requirements
TIGER Decision
- Rests with High Performance Transportation Enterprise (HPTE) as they would issue debt
- Colorado Department of Transportation (CDOT) was grant applicant - also Commission decision
- TIGER grant funds come to CDOT; under purview of the Commission
- CDOT funds (Region 6/4) committed to project
- Commission concurrence that all necessary funding in place and allow HPTE to use additional funds for TIFIA
- If do not pursue TIFIA, need to have Plan "B" for how to use $10M TIGER grant
How to Make and Informed Decision
Q1: Do we have a sense that the tolls will provide a consistent revenue stream for payback?
Q2: Can we secure financial commitments to fill the unfunded gap?
Q3: What potential TABOR impacts/limitations exist?
Q4: What's the cost/benefit of pursuing this project?
Question 1: Will U.S. 36 tolls provide consistent revenue stream?
- TIGER Grant assumed $5 million in gross toll revenues based on planning level model
- Could support $58 million TIFIA loan
- U.S. DOT concerned about projected revenues
- Investment-grade traffic and revenue (T&R) study needed to verify revenues
- Can use up to $900,000 of TIGER grant funds
- Board approved task order to write scope of work for T&R study Request for Proposal May 5, 2010
Question 2: Can we secure financial commitments to fill unfunded gap?
- Commitments from partner agencies:
- Colorado Department of Transportation
- Region 6
- Region 4
- Regional Transportation District
- Denver Regional Council of Governments
- Local governments
- Nearly all commitments are contingent on the other partners and funding the non-TIFIA loan portion of the project to achieve minimum scope
Question 3: What potential TABOR impacts or limitations exist?
- Enterprise limited to 10% of non-federal funds
- RTD contribution could be viewed as fee-for-service
- Can transfer federal funds without TABOR impact
- Project-related activities will affect enterprise status
- Considered assets, capitalized at $500,000 each
- CDOT/local funds could affect enterprise status
- Consider transferring any project-related state funds to enterprise prior to June 30, 2010 (FY 2010)
- Affect status for 2010, allow debt issuance in FY 2011 and 2012
- Falling in/out status isn't negative; do need to time appropriately so doesn't have negative impact
Question 4: Cost/Benefit Analysis
- Can't cobble together the funds to construct today without securing debt
- TIFIA rate would be under CCI index
- Building it now is better than building it later (cost/public benefit)
- Leveraging limited funds - provide regional mobility benefit in multi-modal manner
- Up front costs, some paid by the grant
Proposed TIGER Grant Plan B
- Pursue alternative or additional innovative financing mechanisms using TIGER grant as leverage
- Purchase and install ITS infrastructure and backbone to Church Ranch Road to support future toll operation
- Extend existing HOV/HOT lane to Church Ranch Road
- Extend planned reconstruction project west an additional mile, widen for future managed lanes
Part 5 - Housekeeping Items & Conclusion
- John Doan - SRF Consulting
- Patrick DeCorla-Souza - Federal Highway Administration
Continuing Education Units/Professional Development Points
FHWA Resources and Support
- Web sites and publications
- Office of Center for Innovative Finance Support
- Office of Operations
- Outreach
- Workshops on Integrating Pricing into the Planning Process
- "Targeted" workshops in specific areas
- Funding
- Value Pricing Pilot Program
- Research and tools
For More Information
Contact Information
- John Doan
Senior Associate
SRF Consulting Group, Inc.
1 Carlson Parkway, Suite 150
Minneapolis, MN 55447
(763) 249-6750
jdoan@srfconsulting.com
- Lee Munnich
Senior Fellow and Director
State and Local Policy Program/Hubert H. Humphrey Institute of Public Affairs
280 Humphrey Center
301 19th Avenue South
Minneapolis, MN 55455
(612) 625-7357
lmunnich@umn.edu
- Patty Rubstello, P.E.
Director, Toll Systems Development & Engineering
Washington State Department of Transportation
401 2nd Ave S
Suite 300
Seattle, WA 98104
(206) 464-1299
rubstep@wsdot.wa.gov
- Charles Howard
Director of Transportation Planning
Puget Sound Regional Council
1011 Western Avenue
Suite 500
Seattle, WA 98104
(206) 464-7122
choward@psrc.org
- Peggy Catlin
Deputy Executive Director
Colorado Department of Transportation (CDOT)
4201 E Arkansas Ave
Denver CO 80222
(303) 757-9011
peggy.catlin@dot.state.co.us
- Patrick DeCorla-Souza
Tolling and Pricing Program Manager
Center for Innovative Finance Support
Federal Highway Administration
Department of Transportation
1200 New Jersey Ave, SE
Washington, DC 20590
(202) 366-4076
Patrick.DeCorla-Souza@dot.gov
- Wayne Berman
Congestion Management and Pricing Team Leader
Office of Operations
Federal Highway Administration
Department of Transportation
1200 New Jersey Ave, SE
Washington, DC 20590
(202) 366-4069
wayne.berman@dot.gov


