Managed Lanes System Study Best Practices
November 1, 2017
Presentation:
Transcript:
Webinar Recording:
November 1, 2017
Agenda (all times are in EST)
| 11:30 PM-11:40 PM |
Opening Remarks |
Shaun Cutting, FHWA Colorado Division David Spector, Director
of HPTE |
| 11:40 PM-12:10 PM |
Presentation 1: |
Brad Larson, MnPASS Policy & Planning Director |
| 12:10PM-12:40PM |
Presentation 2: |
Kathleen McCune, LA Metro, DEO Congestion Reduction
Philbert Wong, LA Metro, Sr. Manager, Transportation Planning |
| 12:40 PM-1:10 PM |
Presentation 3: |
Tyler Patterson, WSDOT, Toll Operations Manager |
| 1:10 PM-1:30 PM |
Federal Perspective Open Q&A/Closing |
Angela Jacobs, FHWA Office of Operations |
MnPASS System Study Phase 3
November 1, 2017

www.dot.state.mn.us/metro/projects/mnpass-study/
Outline
-
Background
- MnPASS System Study Phase 3
- Goals
- Process and Analysis
- Results
- Public Outreach
- Lessons Learned
Background
History
- MnPASS = MN's system of priced managed lanes
- MnPASS Express Lanes in operation:
- I-394 since 2005
- I-35W since 2009
- I-35E since 2015
- MnPASS is a strategy for cost-effectively reducing and managing
congestion by providing a reliable, congestion-free option for buses,
carpools and solo motorists willing to pay a fee during peak-travel
times
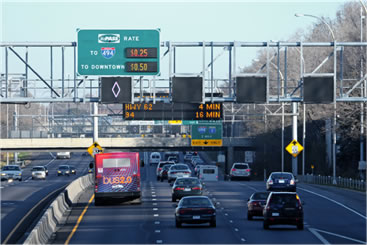
Typical MnPASS Lane Design & Operation
- Single lane w/2 ft. striped buffer (double solid or dashed)
- Peak period operation (M-F 6-10am or 3-7pm)
- Unrestricted and open to all traffic at all other times
- During peak periods, transit buses, HOV2+, and motorcycles can
use for free - solo drivers can use for a fee that varies between
25¢ - $8.00
- All electronic dynamic pricing based on traffic volume/speed
in the MnPASS lane - algorithm designed to maximize use and maintain
50-55 mph speed
- Dedicated MN State Patrol enforcement
MnPASS Goals
- Cost-effectively reduce and manage congestion
in a manner that's more sustainable over the long
term
- Improve the movement of people through highway corridors during
peak periods (increase person throughput)
- Offer a faster, more reliable congestion-free
choice for commuters
- Improve bus transit service and increase ridership
- Increase car/van pooling (HOV use)
Hierarchy of Regional Highway Mobility Strategies in MnDOT and MPO
Long Range Plans
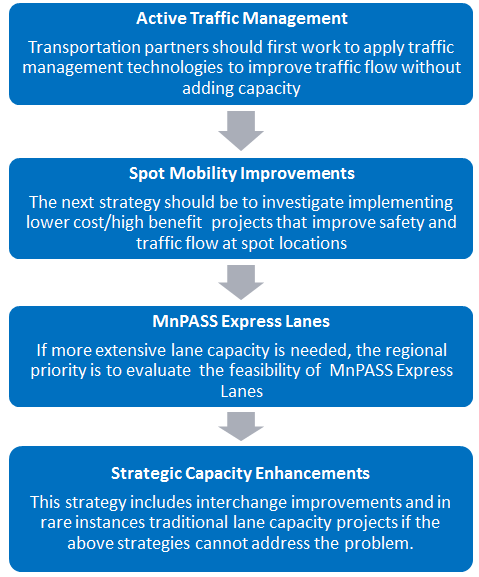
Text of Heirarchy Flow Chart
- Active Traffic Management
- Transportation partners should first work to apply
traffic management technologies to improve traffic flow
without adding capacity
- Spot Mobility Improvements
- The next strategy should be to investigate implementing
lower cost/high benefit projects that improve safety
and traffic flow at spot locations
- MnPASS Express Lanes
- If more extensive lane capacity is needed, the regional
priority is to evaluate the feasibility of MnPASS
Express Lanes
- Strategic Capacity Enhancements
- This strategy includes interchange improvements
and in rare instances traditional lane capacity projects
if the above strategies cannot address the problem.
MnPASS Planning & Project Development Process
- System planning studies which help inform the MnPASS system
vision and corridor prioritization in the MPO and MnDOT long range
plans
- Corridor planning studies that include MnPASS concept development
and feasibility analysis
- Project environmental/preliminary design
- Construction & operation
Past MnPASS System Studies
- Phase 1 study completed in 2005
- Phase 2 study completed in 2010
- In coordination with the Met Council's (MPO's) Metropolitan
Highway System Investment Study
- Results adopted into MPO's and MnDOT's long range transportation
plans
MnPASS System Study 3 Goals
- Update the MnPASS system vision for inclusion in the 2017/18
Transportation Policy Plan Update
- Evaluate key MnPASS issues, opportunities, and risks from both
a regional needs perspective and a national state-of- the-practice
perspective
Process and Analysis
MnPASS System Study 3 Process
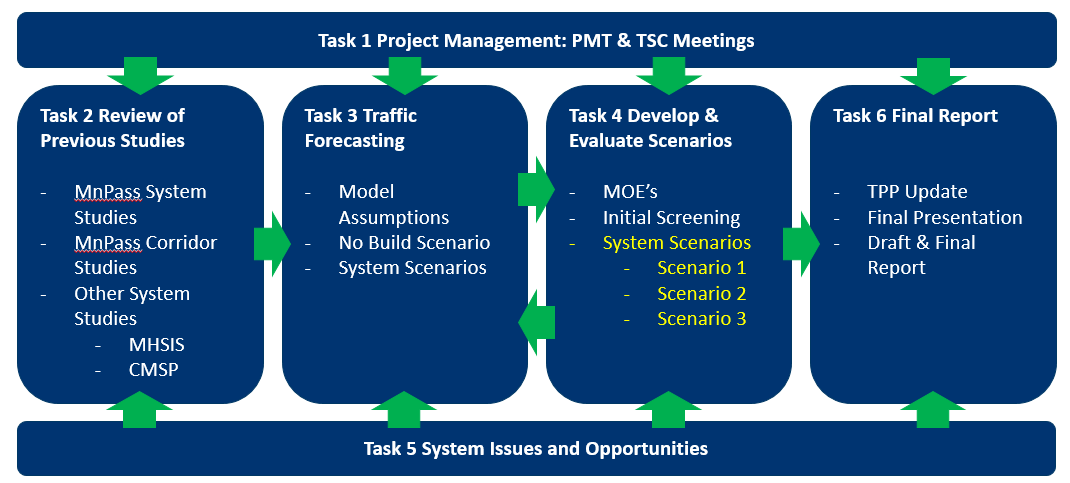
Text of Study Process flow chart
Task 1 Project Management: PMT & TSC Meetings
Task 2 Review of Previous Studies
- MnPass System Studies
- MnPass Corridor Studies
- Other System Studies
Task 3 Traffic Forecasting
- Model Assumptions
- No Build Scenario
- System Scenarios
Task 4 Develop & Evaluate Scenarios
- MOE's
- Initial Screening
- System Scenarios
- Scenario 1
- Scenario 2
- Scenario 3
Task 5 System Issues and Opportunities
Task 6 Final Report
- TPP Update
- Final Presentation
- Draft & Final Report
Tools
- Activity-Based Model (ABM) - predicts which
activities are conducted when, where, for how long, for and with
whom, and the travel choices they will make to complete them. The
ABM is used to develop forecasts and corridor and system performance
measures.
- Vehicle Miles Traveled (VMT), Vehicle Hours Traveled (VHT),
Congested Lane Miles, Mode Shift, Person Throughput, Person
Hours Saved
- Computer-aided Design and Drafting (CADD) -
drawings developed to estimate construction and contingency costs
Screening Criteria
- Severity of congestion
- Proximity to employment centers
- Connections to other MnPASS corridors and major destinations
- Express commuter bus demand
- Total construction cost
- Travel time savings
Management and Advisory Groups
- Project Management Team (PMT) - consisted of
representatives from MnDOT metro area districts, MnPASS planning
staff, and consultant team
- Technical Steering Committee (TSC) - consisted
of representatives from MnDOT, Met Council, transit providers, metro
counties, FHWA, and consultant team
Results
Recommended Corridors
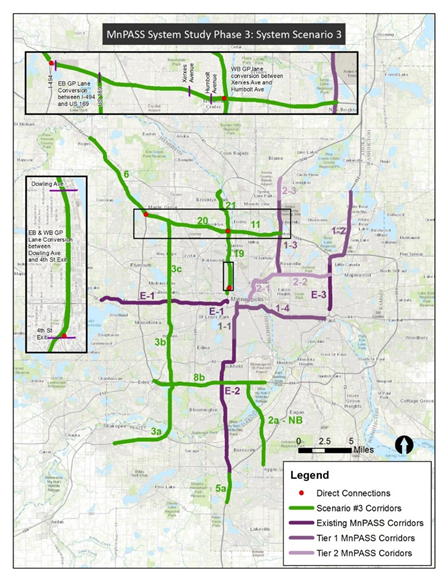
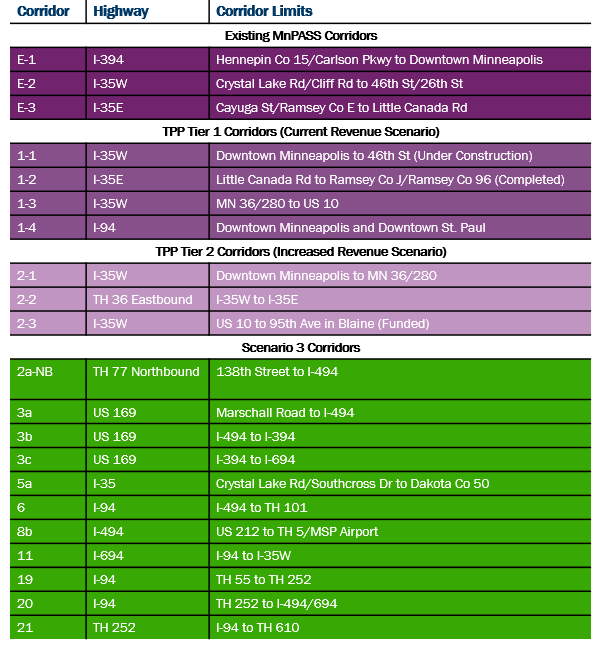
Recommended Corridors Table in text form
| Corridor |
Highway |
Corridor Limits |
| |
|
Existing MnPASS Corridors |
| E-1 |
I-394 |
Hennepin Co 15/Carlson Pkwy to Downtown Minneapolis |
| E-2 |
I-35W |
Crystal Lake Rd/Cliff Rd to 46th St/26th St |
| E-3 |
I-35E |
Cayuga St/Ramsey Co E to Little Canada Rd |
| |
|
TPP Tier 1 Corridors (Current Revenue Scenario) |
| 1-1 |
I-35W |
Downtown Minneapolis to 46th St (Under Construction) |
| 1-2 |
I-35E |
Little Canada Rd to Ramsey Co J/Ramsey Co 96 (Completed) |
| 1-3 |
I-35W |
MN 36/280 to US 10 |
| 1-4 |
I-94 |
Downtown Minneapolis and Downtown St. Paul |
| |
|
TPP Tier 2 Corridors (Increased Revenue
Scenario) |
| 2-1 |
I-35W |
Downtown Minneapolis to MN 36/280 |
| 2-2 |
TH 36 Eastbound |
I-35W to I-35E |
| 2-3 |
I-35W |
US 10 to 95th Ave in Blaine (Funded) |
| |
|
Scenario 3 Corridors |
| 2a-NB |
TH 77 Northbound |
138th Street to I-494 |
| 3a |
US 169 |
Marschall Road to I-494 |
| 3b |
US 169 |
I-494 to I-394 |
| 3c |
US 169 |
I-394 to I-694 |
| 5a |
I-35 |
Crystal Lake Rd/Southcross Dr to Dakota Co 50 |
| 6 |
I-94 |
I-494 to TH 101 |
| 8b |
I-494 |
US 212 to TH 5/MSP Airport |
| 11 |
I-694 |
I-94 to I-35W |
| 19 |
I-94 |
TH 55 to TH 252 |
| 20 |
I-94 |
TH 252 to I-494/694 |
| 21 |
TH 252 |
I-94 to TH 610 |
Congested Trips (No MnPASS)
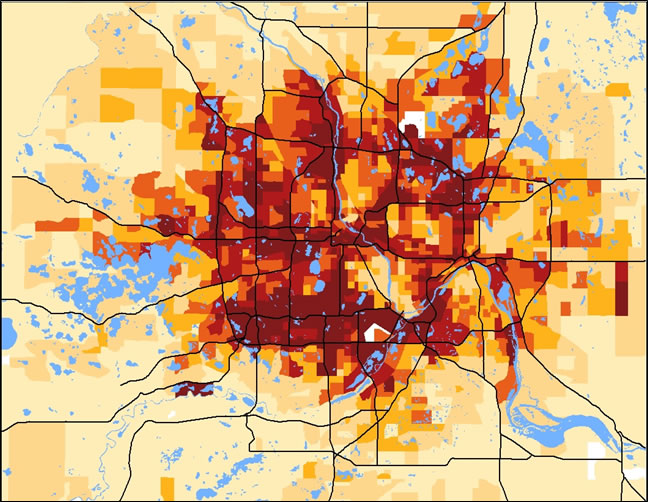
Congested Peak Period Freeway Trips by TAZ
Congested Trips (Existing MnPASS)
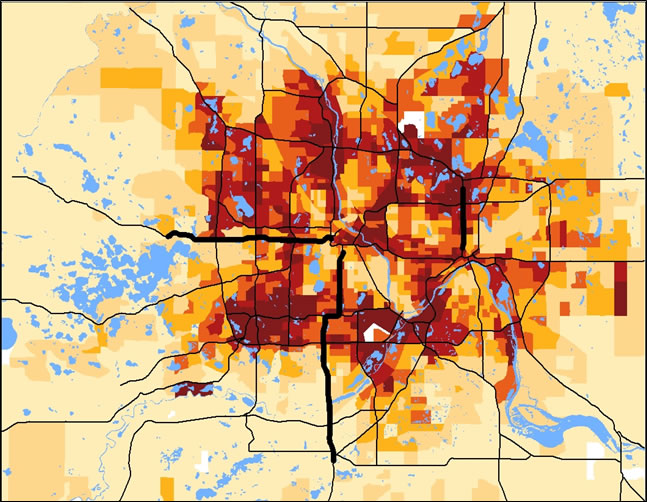
Congested Peak Period Freeway Trips by TAZ
Congested Trips (Existing and Tier 1 MnPASS)
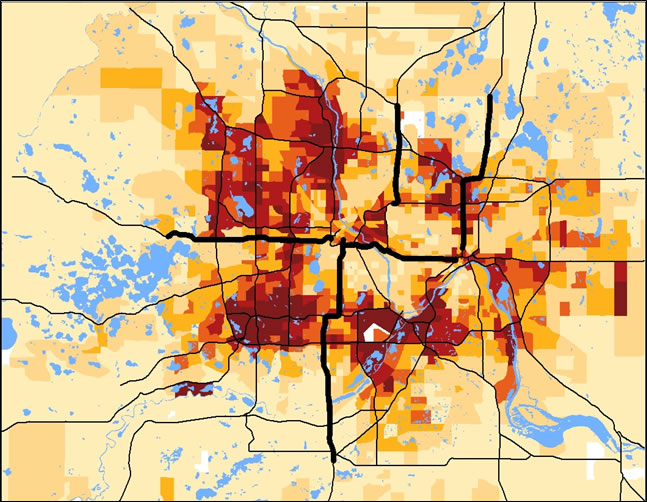
Congested Peak Period Freeway Trips by TAZ
Congested Trips (Existing, Tier 1, and Tier 2 MnPASS)
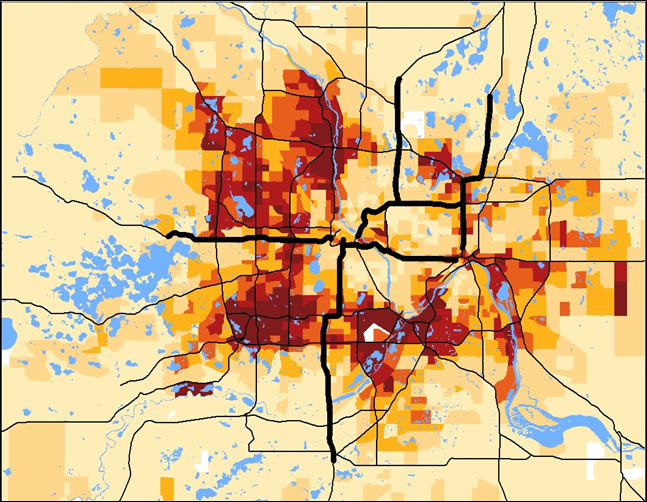
Congested Peak Period Freeway Trips by TAZ
Congested Trips (Existing, Tier 1, Tier 2, and Scenario 3 MnPASS)
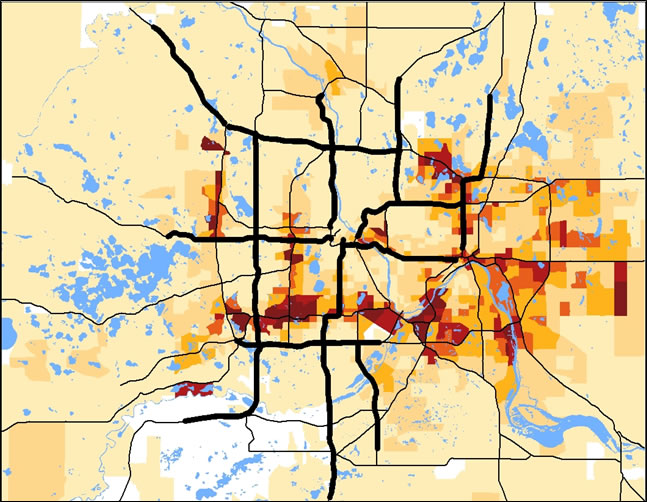
Congested Peak Period Freeway Trips by TAZ
Public Outreach
- System study outreach focused on small group of key stakeholders
(MPO, MnDOT, metro counties and cities, public transit providers,
FHWA)
- More technical/professional focused
- Corridor study outreach focused on key corridor stakeholders,
as well as the people who live along and use the corridor
- Generally higher level, less intensive public outreach
- Includes technical/professional staff and elected officials
- Environmental/preliminary design outreach also focused on key
corridor stakeholders, as well as the people who live along and
use the corridor
- More detailed, intensive public engagement
- Includes technical/professional staff and elected officials
Lessons Learned
- MnPASS planning and project development approach is working
- Most corridors from the 2010 MnPASS System Study Phase 2
have undergone or are planned for some type of improvement
- MnPASS System Study Phase 3 results are currently being
used to update the MPO's long range plan
- Collaboration is key
- Engaging key stakeholders throughout the planning and project
development process is essential
- Constant close collaboration with transit providers is critical
- MPO/MnDOT planners work as a team
- Supportive leadership is also essential
- Establishing goals - drive evaluation criteria and the process
- Understand the tools - capabilities and limitations
Metro Expresslanes
FHWA Managed Lanes System Study - Best Practices Webinar
November 1, 2017
Background - Existing Expresslanes
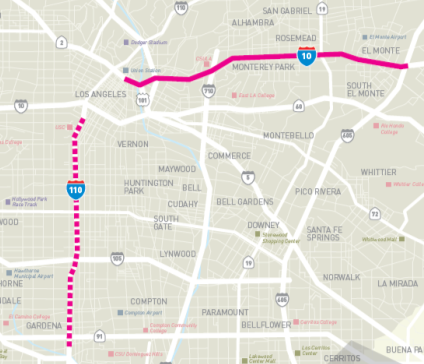
- Converted 66 lane miles of HOV Lanes to HOT
- 1st HOT Lanes in LA County
- One-year demo in each corridor
- $290 M Program Budget ($210 M UPA/CRD Grant)
- $150M Transit
- $125M Toll/Roadway
- $15M LA ExpressPark
- I-110 ExpressLanes opened 11/10/12
- I-10 ExpressLanes opened 2/23/13
Existing ExpressLanes Performance
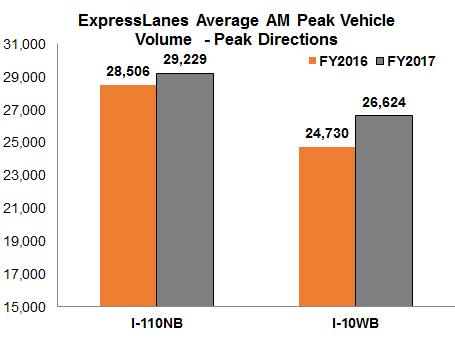
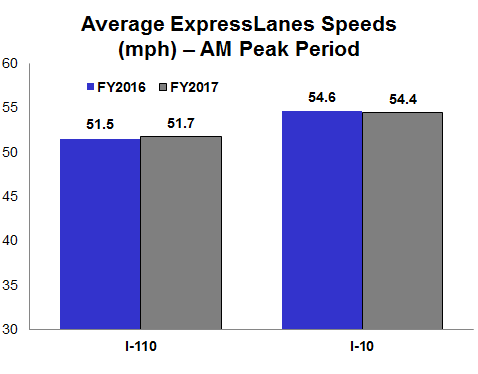
- From inception through June 30, 2017:
- 721,183 transponders issued ; 608,784 accounts opened
- 154,684,893 trips
- Gross Revenue - $248,817,919
Build Upon Success
- Because of the success of the I-10 and I-110 ExpressLanes, in
November 2014, the Metro Board directed staff to prepare an ExpressLanes
Strategic Plan
- The Strategic Plan was to identify and recommend corridors that
could benefit from ExpressLanes conversion
- The Strategic Plan was presented to the Board in January 2017
and the Board approved moving forward with the Tier 1 list of projects
- And in March 2017, the Board requested an acceleration strategy
for constructing both Tier 1 and Tier 2 projects
Methodology
- The Strategic Plan includes mobility benefits, financial feasibility,
and qualitative factors such as,
- Connectivity with other existing and potential Express Lane
corridors
- Transit benefits
- Funding availability
- Ability to provide two ExpressLanes in each direction
Mobility Analysis
- The Plan evaluated existing, in construction, and planned HOV
lanes
- Compared single ExpressLane vs HOV lane assuming 3+ occupancy
requirement
- Methodology:
- Forecast travel demand using SCAG (Southern California Association
of Governments) regional model
- SCAG forecast used as the basis for tolling model
- Evaluation Metrics:
- Value of travel time savings
- HOT lane person throughput
- Average peak period vehicle speeds in the general purpose
lanes
Financial Feasibility
Included two steps:
- Estimated gross revenue generation for each corridor
- Equivalent to a Level 1 Traffic & Revenue Study
- Estimated net revenue
- Calculated by subtracting construction and operation/maintenance
costs from projected gross revenue (O & M based on actual
costs incurred on the I-10 and I-110 ExpressLanes)
Financial Feasibility (cont'd)
- The financial analysis considered 8 scenarios
- Different packages of projects
- Funding/no funding from existing 10/110 ExpressLanes
- HOV 3+ or HOV 3+ peak/HOV 2+ off peak
- Purpose was to identify funding gaps and needs
Funding Scenarios
| |
1 |
2 |
3 |
4 |
5 |
6 |
7 |
8 |
| Tier 1, 2 and 3 Projects |
Included |
Included |
Included |
Included |
Included |
Included |
Included |
Included |
| I-110 Extension and I- 110/I-405 direct connector |
No |
No |
No |
No |
Included |
Included |
Included |
Included |
I-5 (SR-14 to Parker Road), SR-14 (I-5 to SR-138),
SR-118 (I-5
to LA Co Line) |
No |
No |
No |
No |
Included |
Included |
No |
No |
| HOV Exemption Policy |
HOV 3+
peak/2 off
peak |
HOV 3+
peak/2 off
peak |
HOV 3+ |
HOV 3+ |
HOV 3+ |
HOV 3+ |
HOV 3+
peak/2 off
peak |
HOV 3+ |
| Toll revenue from I- 10/110 ($10M/year) |
No |
Yes |
Yes |
No |
Yes |
No |
Yes |
Yes |
| Total Construction Cost |
$711M |
$737M |
$737M |
$711M |
$1,870M |
$1,776M |
$1,578M |
$1,578M |
| Funding Gap |
$199M |
$92M |
$88M |
$193M |
$1,074M |
$1,299M |
$781M |
$782M |
Evaluation Process
- Each corridor was ranked into quintiles (top 20%, second 20%,
third 20%, fourth 20%, and fifth 20%) for the three corridor evaluation
metrics and financial screening
- The ranks were averaged to get a composite score. For example,
if a project scored in the top 20% in each criteria then the composite
ranking would be in the first quintile.
Project Tiers
- Based on the mobility benefits, financial feasibility, and the
refinement criteria, projects were placed into three tiers:
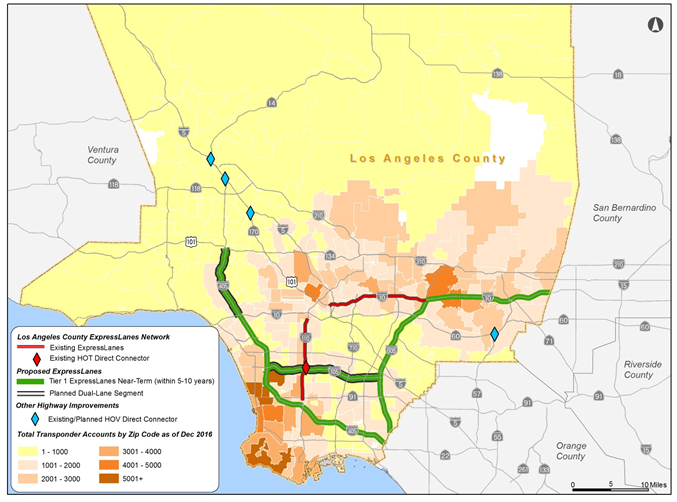
- Tier 1 - near-term (within 5-10 years)
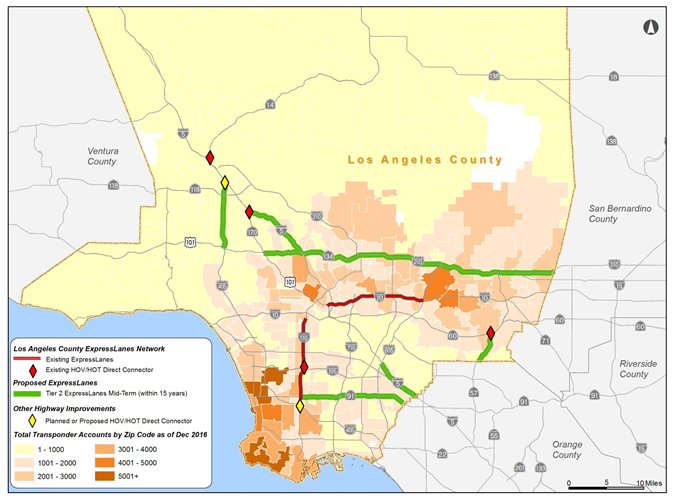
- Tier 2 - mid-term (within 15 years)
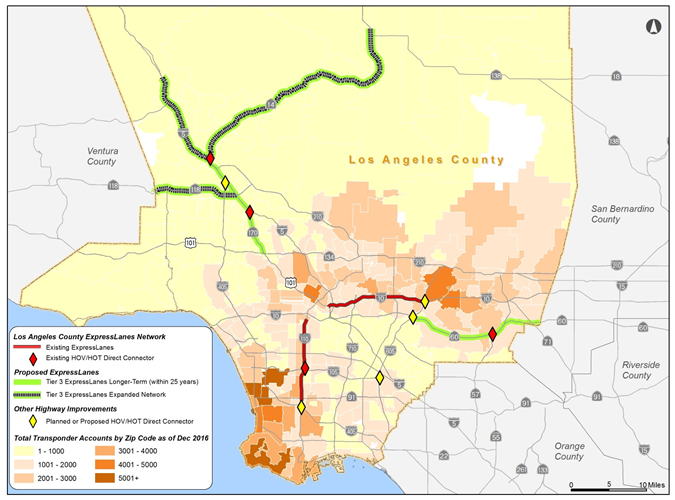
- Tier 3 - longer-term (within 25 years)
Recommended Tier 1 Projects
(5 to 10 Years)
| Project |
Measure M Funding |
Funding Availability |
| I-405 from I-10 to US-101 |
$260,000,000 |
2024 |
| I-105 from I-405 to I-605 |
$175,000,000 |
2027 |
| I-405/I-110 Int. HOV Connect Ramps and Interchange
Improvements |
$250,000,000 |
2042 |
| I-605/SR-60 Interchange HOV Direct Connectors |
$130,000,000 |
2043 |
| I-110 ExpressLane extension south to I-405/I-110
interchange |
$51,500,000 |
2044 |
| I-605 from I-10 to I-405 |
None |
N/A |
| I-405 from I-10 to LA/Orange County line |
None |
N/A |
| I-10 from I-605 to LA/San Bernardino County line |
None |
N/A |
Recommended Tier 1 Projects
(5 to 10 Years)
Recommended Tier 2 Projects
(15 Years)
| Project |
Measure M Funding |
Funding Availability |
| I-5 from I-605 to LA/Orange County line |
None |
N/A |
| I-5 from SR-134 to SR-170 |
None |
N/A |
| SR-57 from SR-60 to LA/Orange County line |
None |
N/A |
| SR-91 from I-110 to LA/Orange County line |
None |
N/A |
| SR-134 from SR-170 to I-210 |
None |
N/A |
| I-210 from SR-134 to LA/San Bernardino County line |
None |
N/A |
| I-405 from I-101 to I-5 |
None |
N/A |
Recommended Tier 2 Projects
(15 Years)
Recommended Tier 3 Projects
(25+ Years)
| Project |
Measure M Funding |
Funding Availability |
| I-5 from SR-170 to SR-14 |
None |
N/A |
| SR-60 from I-605 to LA/San Bernardino County line |
None |
N/A |
| SR-170 from I-5 to SR-134 |
None |
N/A |
| I-5 from SR-14 to Parker Road |
None |
N/A |
| SR-14 from I-5 to Avenue P8 |
None |
N/A |
| SR-118 from I-5 to LA/Ventura County line |
None |
N/A |
Recommended Tier 3 Projects
(25+ Years)
Outreach and Coordination
- Strategic Plan Technical Advisory Committee
- MPO (SCAG)
- California Department of Transportation
- Metro committees (Technical Advisory Committee, Streets and
Freeways Subcommittee)
- Sub-regional Councils of Government (COGs) Transportation Committees
- Strategic Plan consistent with SCAG Regional ExpressLanes Strategic
Plan
Current Status
- Studies underway/beginning for Tier 1 Projects: I-105 - Environmental
Document, ConOps, T&R underway
- I-605 - Environmental Document, ConOps, T&R underway
- I-405 from US-101 to I-10 - Project Study Report to begin in
2018
- Tolling Authority- Submit CTC application for I-105 in 2018
and the remainder of the Tier 1 projects in 2019
Lessons Learned
- To gain approval, important to emphasize mobility benefits and
connectivity with a network approach, rather than just focusing
on revenue generation
- Leverage the project tiers to obtain tolling authority for each
tier, rather than project by project authority
- May also be useful for grant applications and other funding
opportunities
- Strategic Plan identified funding gaps and analyzed various
funding scenarios, but ultimately no financing plan was presented
to the Board (5 projects have funds from local sales tax measure
and the remainder of the plan is unfunded)
- In retrospect, should have presented a financing plan
- The Board later authorized a process to borrow revenues
from each completed project to allow us to build out the network
- You can never run too many financing scenarios - so build this
into your process and your budget
I-405 Express Toll Lanes
Tyler Patterson, Systems Manager
November 1, 2017
Roger Millar, Secretary of Transportation
Keith Metcalf,
Deputy Secretary of Transportation
I-405 Express Toll Lanes
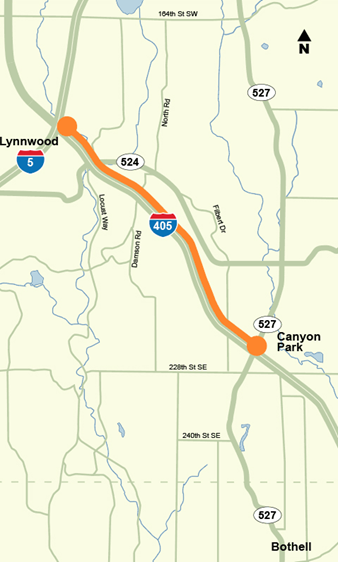
- Opened Sept. 27, 2015
- 15 miles of express toll lanes
- Operation hours:
- Originally: 24/7
- Adjusted 2016: 5 a.m. to 7 p.m. Mon - Fri
- Dynamic Toll Rates
- Minimum Toll Rate $ 0.75
- Maximum Toll Rate $ 10.00
- Carpool Policy
- 3+ carpools with Flex Pass exempt at all times
- 2+ carpools with Flex Pass exempt except 5-9 a.m. and 3-7
p.m. on weekdays
Policy and Operational Changes
WSDOT introduced new tolling policies during launch.
- 3+ carpool during peak periods
Only
2+ occupancy required to use other HOV facilities in WA.
- New passes
WSDOT introduced new Flex
Pass that carpools must use to avoid paying a toll.
- Trip-based toll system
First toll facility in WA to that
priced tolls for multiple destination locations.
- Access points
Vehicles can only enter
and exit lanes at designated areas, unlike SR 167 HOT Lanes facility.
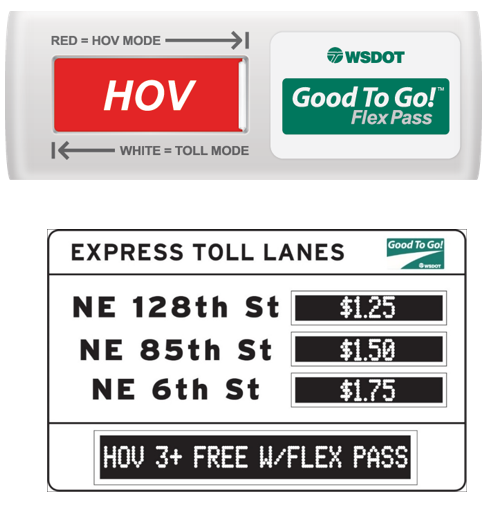
Difficult sign system integration
| Challenges |
Results |
| Difficulty integrating signs: New design
required single controller to communicate with multiple signs.
Design builder procured untested controller capable of controlling
multiple signs. |
Multiple documented issues with controller during maintenance
testing and installation. |
| NTCIP specification interpretation: Toll
lane vendor and sign manufacturer used different formats for
sign information. |
Difficulty coordinating technical troubleshooting, required
daily staff call with vendors to resolve issues and track action
items. |
| Lack of end-to-end signal testing:
No integration testing with vendor prior to installation |
Go-live date delayed due to integration issues |
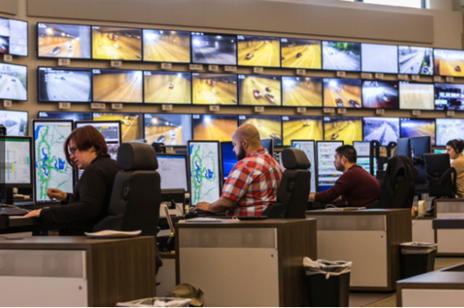
Traffic Management Center (TMC) involvement
- Funded toll liaison position to coordinate operations and monitoring
activities
- Held response coordination workshops before go-live to:
- Review standard operating procedures and scenarios
- Clarify responsibilities
- Delegate authority
- Determine escalation and communications procedures
- Toll algorithm tuning coordination with TMC and Toll Division
Public Outreach
Outreach: grass roots and earned media
- 135 presentations and events reaching nearly 11,000
- 89 earned media stories
Paid media
- 230 million advertising impressions during 15-week media buy
- $1.2 million in total paid media added value in additional donated
media
Social media
- Facebook reach: 216,924 users
- Twitter reach: 557,998 users
- YouTube: 104,000 total views on four animated videos
- WSDOT Blog: 29 blogs with 125,126 views
Website
- GoodToGo405.org campaign landing page and other informational
pages: 1.8 million page views
Incentive programs for carpools and motorcyclists
- 33,871 free Flex Passes distributed through RideshareOnline.com
- 11,741 free motorcycle passes distributed
Scenario testing
Tabletop: Review disaster/emergency scenarios
- Introduce stakeholders
- Communicate expectations
Lane vendor Roundtable: WSDOT and lane vendor maintenance
staff reviewed maintenance and operations scenarios
- Clarify error or omissions in standard operating procedure
- Clarify maintenance responsibilities
- Discussed demarcation point for equipment maintenance by WSDOT
vs. vendor
Traffic and revenue
During the first months of operation, I-405 express toll lane use
was much higher than forecasted. Drivers adapted to system quickly and
utilized it more than original projections had assumed.
WSDOT conducted an initial study but did not conduct final study
with revised assumptions, e.g. access location, 2/3+ carpool with updated
operational hours, $10 vs. $15 max toll rate, etc.
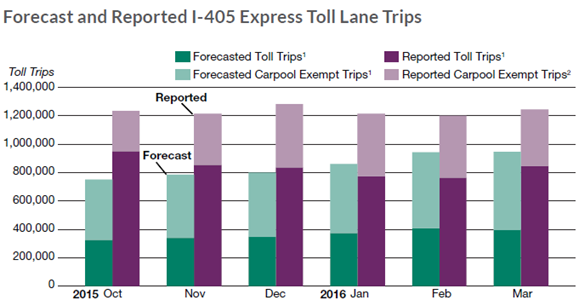
Forecast and Reported I-405 Express Toll Lane Trips - graph
information as estimated table data
| Toll Trips |
Oct 2015 |
Nov 2015 |
Dec 2015 |
Jan 2016 |
Feb 2016 |
Mar 2016 |
| Forecasted Toll Trips |
~340,000 |
~340,000 |
~370,000 |
~380,000 |
~400,000 |
~400,000 |
| Forecasted Carpool Exempt Trips |
~760,000 |
~780,000 |
~800,000 |
~830,000 |
~920,000 |
~920,000 |
| Reported Toll Trips |
~920,000 |
~820,000 |
~810,000 |
~780,000 |
~780,000 |
~810,000 |
| Reported Carpool Exempt Trips |
~1,210,000 |
~1,200,000 |
~1,280,000 |
~1,210,000 |
~1,200,000 |
~1,210,0000 |
Study was not accurate in predicting performance.
Revised T&R study for final assumptions would improve
accuracy of traffic and revenue predictions.
Performance challenges
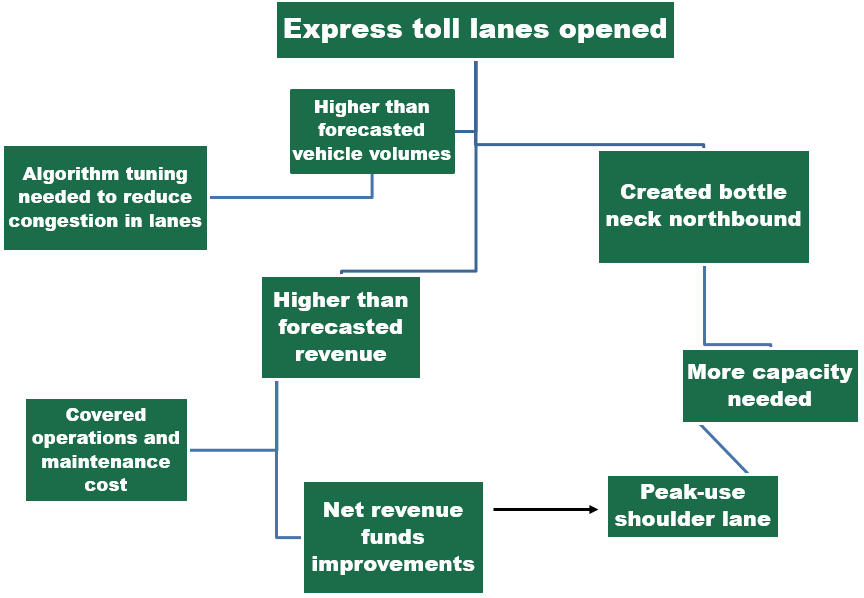
Text of Performance Challenges flow chart
- Express toll lanes opened
- Higher than forecasted vehicle volumes
- Algorithm tuning needed to reduce congestion
in lanes
- Higher than forecasted revenue
- Covered operations and maintenance cost
- Net revenue funds improvements
- Created bottle neck northbound
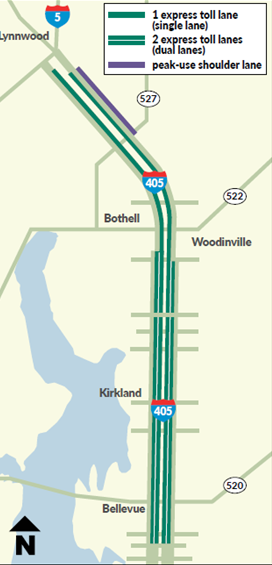
Peak-use shoulder lane
Problem
Change of capacity from to express toll
lanes created bottleneck northbound in 3 lane section.
Solution
Peak-use shoulder lane project
- Convert right shoulder to general purpose lane
- Build new noise wall
- Improvements to express toll lanes signage and access
- Generally open during afternoon peak period
Results
- Reduced congestion
- Improved travel times
- Lower toll rates
Improvements
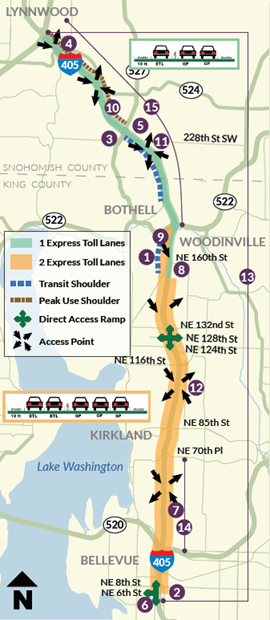
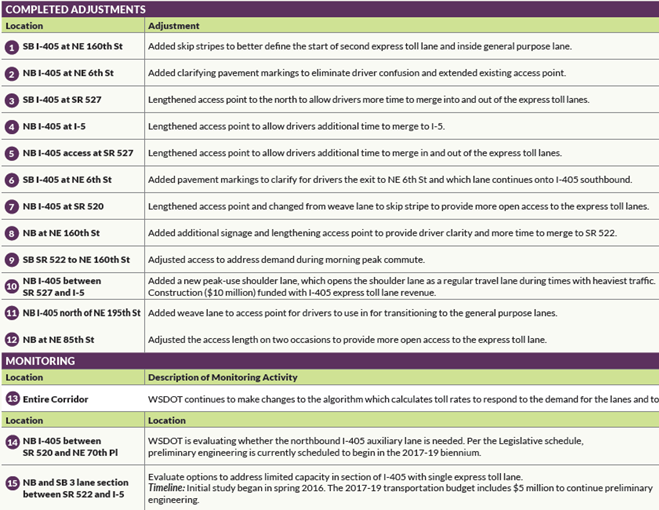
Text version of map legend information
| COMPLETED ADJUSTMENTS |
| Location |
Adjustment |
| 1. SB I-405 at NE 160th St |
Added skip stripes to better define the start of
second express toll lane and inside general purpose
lane. |
| 2. NB I-405 at NE 6th St |
Added clarifying pavement markings to eliminate
driver confusion and extended existing access point. |
| 3. SB I-405 at SR 527 |
Lengthened access point to the north to allow driers
more time to merge into and out of the express toll
lanes. |
| 4. NB I-405 at I-5 |
Lengthened access point to allow driers additional
time to merge to I-5. |
| 5. NB I-405 access at SR 527 |
Lengthened access point to allow drivers additional
time to merge in and out of the express toll lanes. |
| 6. SB I-405 at NE 6th St |
Added pavement markings to clarify for drivers the
exit to NE 6th St and which lane continues onto I-405
southbound. |
| 7. NB I-405 at SR 520 |
Lengthened access point and changed from weave lane
to skip stripe to provide more open access to the express
toll lanes. |
| 8. NB at NE 160th St |
Added additional signage and lengthening access
point to provide driver clarity ad more time to merge
to SR 522 |
| 9. SB SR 522 to NE 160th St |
Adjusted access to address demand during morning
peak commute. |
| 10. NB I-405 between SR 527 and I-5 |
Added a new peak-use shoulder lane, which opens
the shoulder lane as a regular travel lane during times
with heaviest traffic. |
| 11. NB I-405 north of NE 195th St |
Added weave lane to access point for drivers to
use in for transitioning to the general purpose lanes. |
| 12. NB at NE 85th St |
Adjusted the access length on two occasions to provide
more open access to the express toll lane.
|
| MONITORING |
| Location |
Description of Monitoring Activity |
| 13. Entire Corridor |
WSDOT continues to make changes to the algorithm
which calculates toll rates to respond to the demand
for the lanes |
| Location |
Description |
| 14. NB I-405 between SR 520 and NE 70th Pl |
WSDOT is evaluating whether the northbound I-405
auxiliary lane is needed. Per the Legislaitve schedule,
preliminary engineering is currently scheduled to begin
in the 2017-19 biennium. |
| 15. NB and SB 3 lane section between SR 522 and
I-5 |
Evaluate options to address limited capacity in
section of I-405 with single express toll lane. Timeline:
Initial study began in spring 2016. The 2017-19 transportation
budget includes $5 million to continue preliminary engineering. |
Contact
Tyler Patterson, PE
401 2nd Ave S, Suite 400
Seattle, WA 98104-2862
Tyler.Patterson@wsdot.wa.gov
(206) 716-1134
Consideration of a Systemwide Approach of the Application of Congestion
Pricing Strategies
Federal Highway Administration
Why are States Considering a Systemwide Approach to Congestion Pricing
- The first congestion pricing project opened in the United States
on the SR 91 in Orange County, CA in 1995. Over time, as the strategy
gained traction, States sought to develop a more strategic approach
to planning for expansion of congestion pricing projects in their
region.
- The North Central Texas Council of Governments (NCTCOG) conducted
one of the systemwide congestion pricing studies in the Dallas Fort
Worth region. The regional study established criteria, policies,
and procedures to identify potential candidates for short-term and
long-term value pricing projects, and studied the applicability
of value pricing concepts in existing and future corridors.
- Since that time, a number of State, regional and transportation
authorities have conducted systemwide studies.
States That Have Studied Systemwide Approach
- Metropolitan Washington Council of Governments (MWCOG)
- National Capitol Region Transportation Planning Board (TPB)
evaluated a regional network of value priced lanes. The plan
included four new high-occupancy toll (HOT) lanes along 15 miles
of the Capital Beltway in Virginia, and a study of the conversion
of existing HOV lanes into HOT lanes along 47 miles of the I-95/395
corridor in Virginia.
- VDOT has successfully implemented projects on the Capital
Beltway and I-95. MDOT created express lanes on I-95 MD 100.
MDOT is also considering HOT lanes on I-270.
States That have a Studied Systemwide Approach to Congestion Pricing
- San Francisco Bay Area
- The Metropolitan Transportation Commission (MTC) conducted
a regional HOT Network Study. MTC is now moving forward with
an 800 mile Regional HOT network.
- Washington State DOT
- Washington State operates a 225 mile HOV lane system. 16
WSDOT, completed Express Lanes System Concept Study that considered
a system-level program staging that could be applied to complete
the evolution from HOV lanes to tolled express lanes. WSDOT
evaluated conversion of the HOV and express lane system into
a network of tolled express lanes that would continue to serve
transit and carpools at no cost, while allowing paying customers
to enter the lanes for trips where timely arrival is particularly
important. The price would be set dynamically based on traffic
conditions in order to maintain high throughput and reliable
speeds.
States That have a Studied Systemwide Approach to Congestion Pricing
- Florida
- Florida's Turnpike Enterprise of the Florida Department
of Transportation (FDOT) evaluated the potential for implementing
congestion pricing along the Turnpike System. The Integrated
Congestion Pricing Plan (ICPP) included three primary phases
developed over several years to determine where, when, and how
congestion pricing could be used on the Turnpike to improve
mobility. The study also explored the opportunity to incorporate
carpooling and transit services into the overall congestion
pricing solution. Much of this effort focused on the large urban
areas of the State that experience extended periods of congestion,
including Southeast Florida, Tampa, and Orlando.
Summary
- Conducting a systemwide congestion pricing evaluation has been
a successful step towards many State DOTs implementing regional
networks of priced managed lanes (also referred to as express toll
lanes).
- While this webinar has included presentations about how two
states developed a systemwide approach to implementing congestion
pricing strategies, there are many examples of other states available
as well.
Contact Information
Angela Fogle Jacobs
Program Manager for Congestion
Pricing
Federal Highway Administration
Office of Operations
1200 New Jersey Avenue, SE, E86-204
Washington, DC 20590
(202) 366-0076
Angela.Jacobs@dot.gov


