U.S. Department of Transportation
Federal Highway Administration
1200 New Jersey Avenue, SE
Washington, DC 20590
202-366-4000

Skip to content
Facebook iconYouTube iconTwitter iconFlickr iconLinkedInInstagram
office logo

Office of Policy & Governmental Affairs

Image Credit: Internal DOT Library

Our Transportation Future: Trends, Transportation, and Travel Briefs

Drivers of Demand

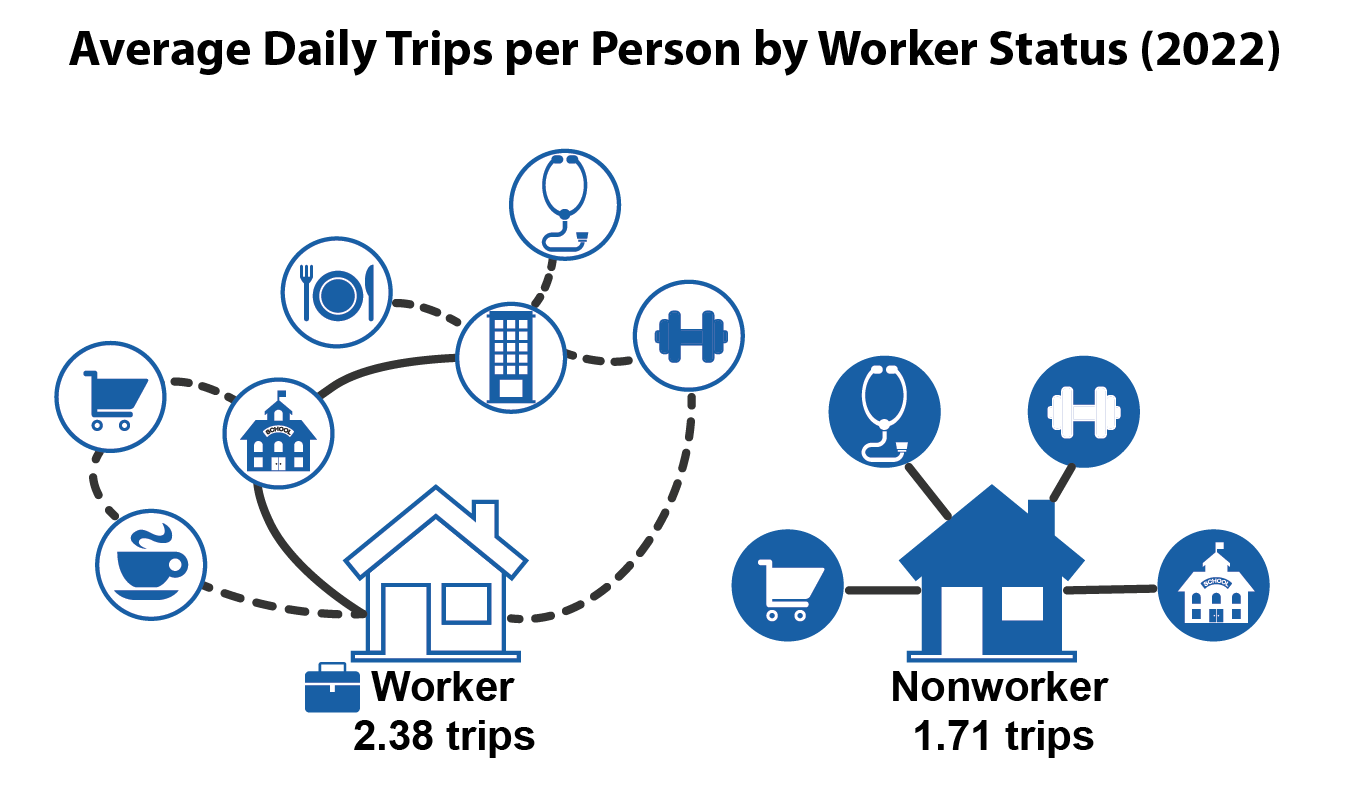
This graphic titled "Average Daily Trips per Person by Worker Status (2022)" illustrates the concept of trip chaining by comparing the daily travel patterns of workers and nonworkers. It displays data showing that workers averaged 2.38 daily trips–39.2% more than nonworkers at 1.71 trips–by frequently bundling errands like shopping, dining, and medical appointments with their commutes.

U.S. travel demand is shaped by population, economic conditions, and access to transportation, while freight demand follows consumer trends and supply‑chain factors. Although trips per person are declining, total travel is rising with population growth. With new technologies and services transforming how people and goods move, tracking these drivers is key to understanding future transportation needs.
Learn More

Population and Demographics

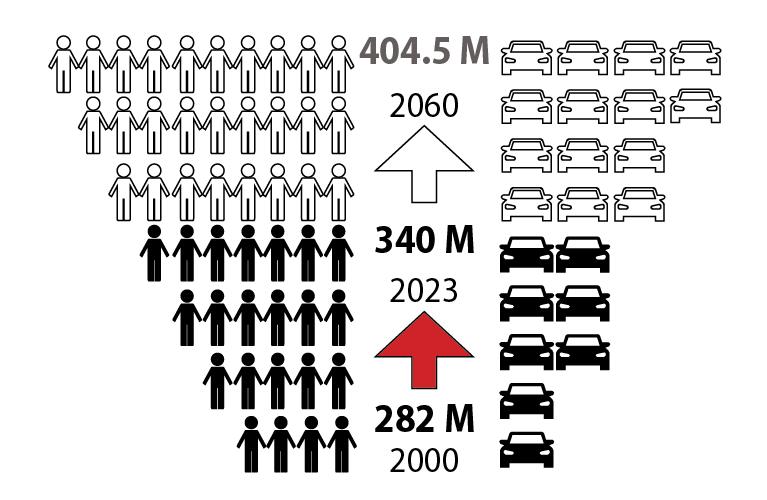
This graphic from the Federal Highway Administration illustrates that as the U.S. population grows from 282 million in 2000 to a projected 404.5 million by 2060, overall transportation demand increases. The visual uses increasing rows of human figures and vehicle icons to show that population size is a primary driver of travel demand for both households and businesses.

Transportation use in the U.S. is shifting as demographics and lifestyles change. Even as the population grows, people are taking fewer trips per person, reflecting evolving needs and preferences. An aging population, younger generations entering key life stages, and shifts in core worker age groups all influence when, how, and why people travel. Understanding these trends is essential for planning future transportation services and policies.
Learn More

Geography

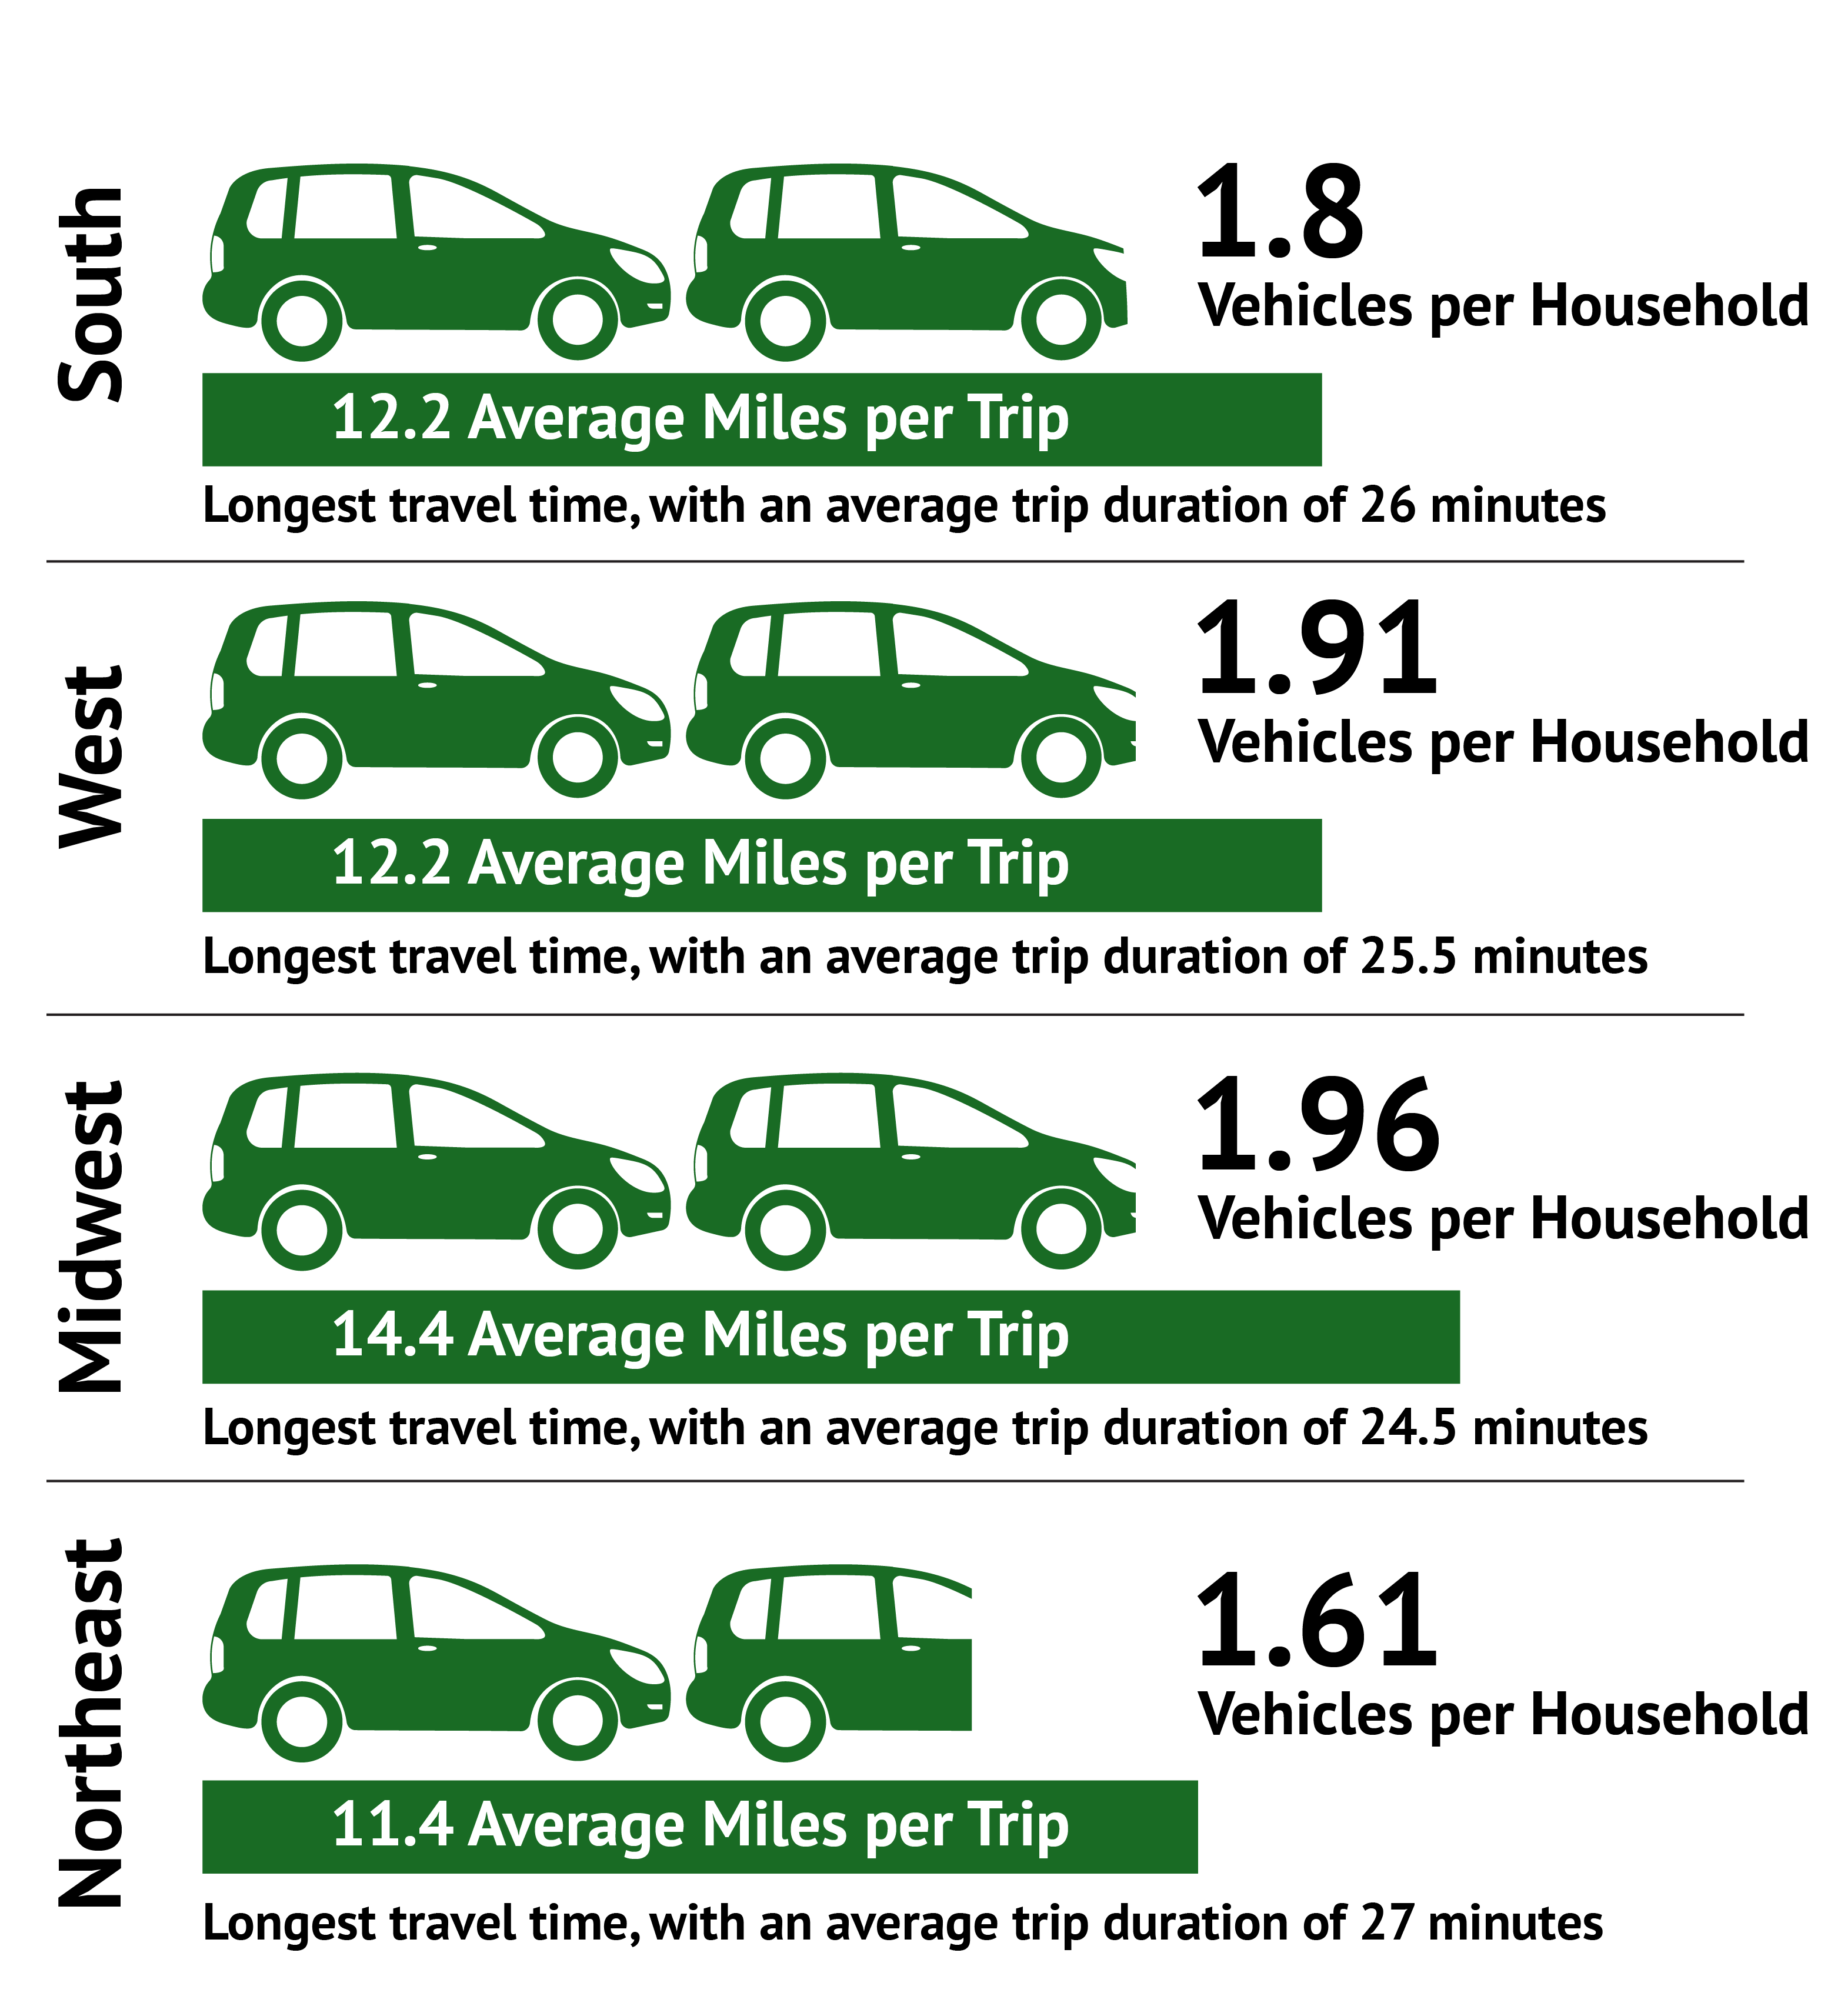
This graphic from the Federal Highway Administration compares travel demand indicators across four U.S. Census regions, showing how geographic location influences vehicle ownership and trip characteristics. It highlights that the Northeast has the fewest vehicles per household (1.61) and shortest trip lengths (11.5 miles) but the longest average travel time at 27 minutes, while the Midwest has the most vehicles per household (1.96) and longest average trip lengths (14.4 miles) but the shortest travel times at 24.5 minutes

Where people live strongly shapes travel demand. Urban areas tend to have fewer vehicles per household but more transportation options, while shifting migration patterns—from large metros to smaller counties and rural areas—directly influence how and how often people travel. As populations grow, age, or relocate, transportation needs change accordingly, from increased demand in fast‑growing regions to expanded mobility options for aging suburban residents and rising travel needs in rural areas attracting remote workers.

Learn More

Vehicles and Travel Demand

This donut chart from the Federal Highway Administration, titled "VMT" (Vehicle Miles Traveled), illustrates the percentage of U.S. household travel by vehicle type in 2022. It shows that traditional autos and SUVs combined to account for nearly 80 percent of all household miles driven.

Transportation use in the U.S. is shifting as demographics and lifestyles change. Even as the population grows, people are taking fewer trips per person, reflecting evolving needs and preferences. An aging population, younger generations entering key life stages, and shifts in core worker age groups all influence when, how, and why people travel. Understanding these trends is essential for planning future transportation services and policies.
Learn More

Industry and Workers

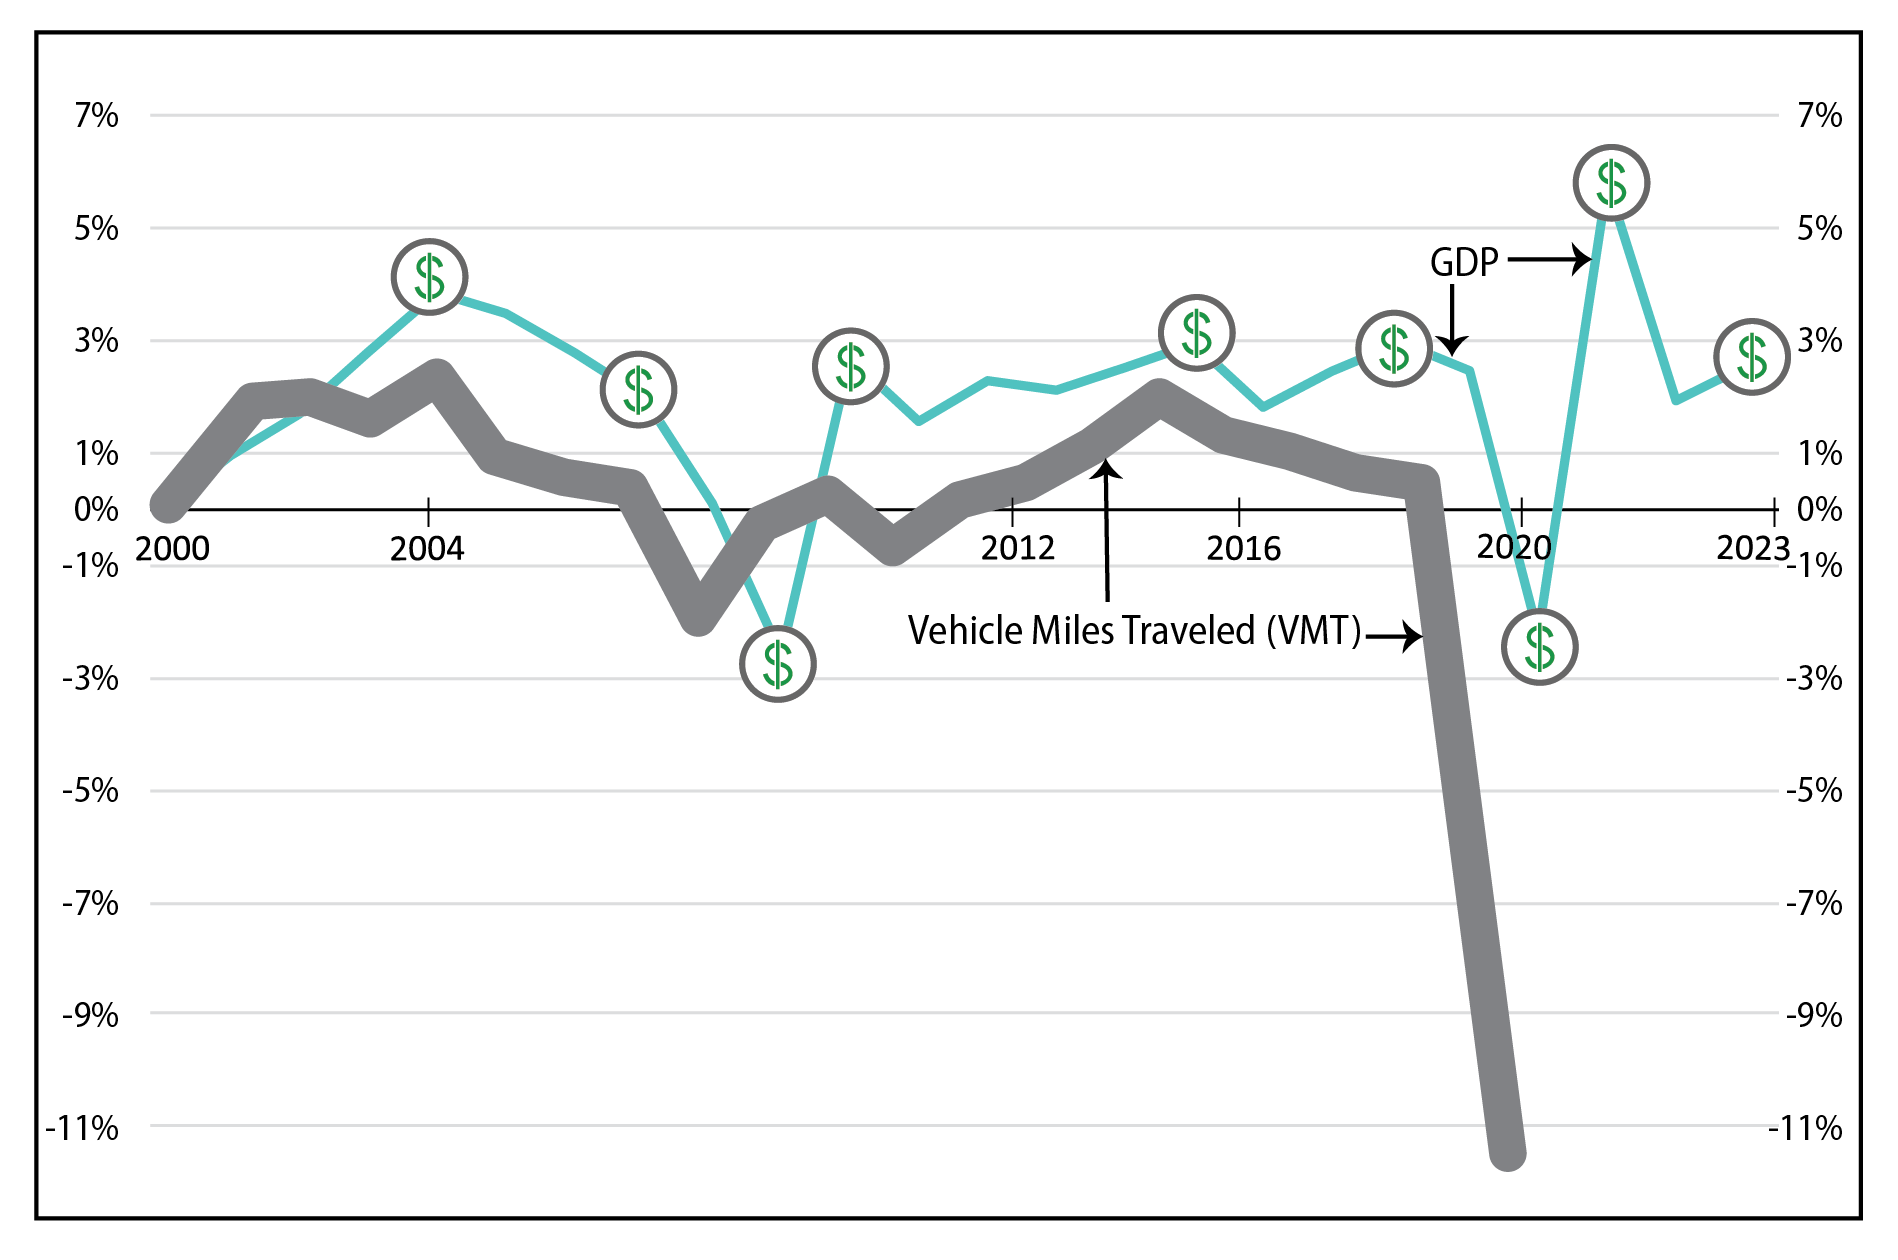
This graphic from the Federal Highway Administration illustrates the historical relationship between the annual percent change in Gross Domestic Product (GDP) and Vehicle Miles Traveled (VMT) from 2000 to 2023. It highlights how economic growth generally drives transportation demand, with both metrics showing synchronized declines during the 2007–2009 recession and a dramatic decoupling during the COVID-19 pandemic in 2020, where VMT dropped by approximately 10 percent. While GDP saw a sharp rebound following the pandemic, the chart shows that VMT patterns have become more complex due to the rise of telework and shifting industry trends.

Transportation use in the U.S. is shifting as demographics and lifestyles change. Even as the population grows, people are taking fewer trips per person, reflecting evolving needs and preferences. An aging population, younger generations entering key life stages, and shifts in core worker age groups all influence when, how, and why people travel. Understanding these trends is essential for planning future transportation services and policies.
Learn More

Technology Trends

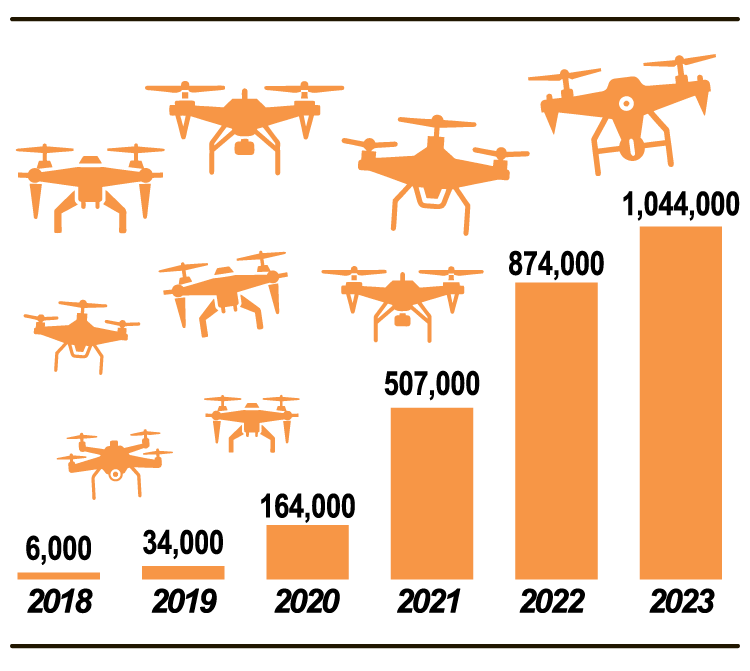
This bar chart from the Federal Highway Administration, titled "Commercial Drone Deliveries Between 2018 and 2023," illustrates the explosive growth of drone package delivery globally. It shows that deliveries increased from just 6,000 in 2018 to over 1 million in 2023.

Transportation use in the U.S. is shifting as demographics and lifestyles change. Even as the population grows, people are taking fewer trips per person, reflecting evolving needs and preferences. An aging population, younger generations entering key life stages, and shifts in core worker age groups all influence when, how, and why people travel. Understanding these trends is essential for planning future transportation services and policies.

Learn More

Emerging Trends and Considerations

This illustration from the Federal Highway Administration depicts a modern, integrated urban landscape representing the transformation of the U.S. transportation system. The graphic features layered infrastructure, including multi-level roadways and a transit rail system, alongside high-density buildings and icons symbolizing smart technology and connectivity.

Transportation use in the U.S. is shifting as demographics and lifestyles change. Even as the population grows, people are taking fewer trips per person, reflecting evolving needs and preferences. An aging population, younger generations entering key life stages, and shifts in core worker age groups all influence when, how, and why people travel. Understanding these trends is essential for planning future transportation services and policies.


Learn More

Page last modified on May 29, 2026
Federal Highway Administration | 1200 New Jersey Avenue, SE | Washington, DC 20590 | 202-366-4000