U.S. Department of Transportation
Federal Highway Administration
1200 New Jersey Avenue, SE
Washington, DC 20590
202-366-4000
Federal Highway Administration Research and Technology
Coordinating, Developing, and Delivering Highway Transportation Innovations
| REPORT |
| This report is an archived publication and may contain dated technical, contact, and link information |
|
| Publication Number: FHWA-HRT-11-062 Date: November 2011 |
Publication Number: FHWA-HRT-11-062 Date: November 2011 |
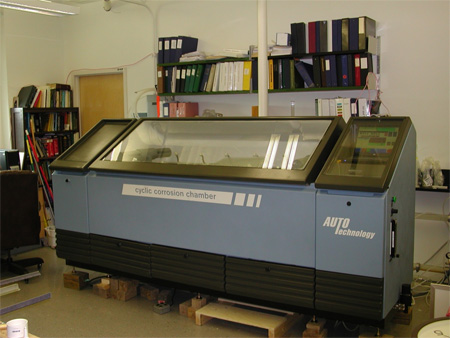
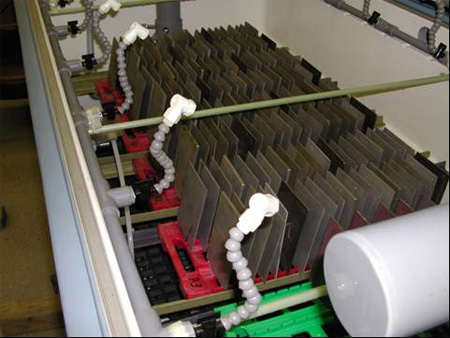
To efficiently determine the relative corrosion performance of the experimental steels compared to other bridge steels, the SAE J2334 laboratory corrosion test procedure was used, which is a form of CCT described in chapter 1 of this report.(13) The tests were performed at Old Dominion University in Norfolk, VA, in a fully automated cyclic corrosion chamber purchased with funds made available from this project. The chamber has complete chloride and humidity control for cycling times (see figure 30). Figure 31 shows the inside of the chamber containing corrosion coupons. All of the CCT runs were made with ASTM A36 carbon steel and/or ASTM A588 weathering steel coupons as control standards.(17,10) In addition, ASTM A1010 coupons were also exposed as control standards in each CCT run.
Figure 30. Photo. Cyclic corrosion chamber.
Figure 31. Photo. Interior of cyclic corrosion chamber showing corrosion test panels.
The standard SAE J2334 test calls for daily spraying of all test coupons for 15 minutes with a buffered 0.5 percent NaCl solution. The modified procedure first used in this study substituted an unbuffered 5 percent NaCl solution for the 0.5 percent NaCl stage. A further modification was also used in which an unbuffered 3 percent NaCl solution was employed. Sets of three corrosion coupons for each steel were exposed for 100 cycles. At intervals throughout the 100 cycles, mass loss measurements were performed on 2 coupons from each exposure set, while the third coupon was used for x-ray spectroscopy to identify the oxyhydroxides formed on the steel surfaces. The thickness loss was calculated from the mass loss data using the equations listed in the ASTM G1-03 standard.(18) All steels were assumed to have the same density of 0.2836 lb/in3 (7.86 g/cm3).
CCTs were performed only on steels in the two targeted strengths of 50 and 70 ksi (345 and 482 MPa). Sets of coupons were run with the 5 percent NaCl solution to provide corrosion rates for all the steels and to confirm the expected finding that the strength level of a steel has no effect on its corrosion performance. Another set of coupons was run with 3 percent NaCl solution to determine if a less severe chloride content in the spray solution might change the mass loss rates for any of the steels.
Coupons were weighed for mass gain prior to the stripping cycles. Two of each triplicate set of coupons and the two mass loss reference coupons for each steel type underwent identical rust stripping procedures as specified by ASTM G1-03 using chemical cleaning procedure C.3.5.(18) For coupons with heavy rust build-up, (typical for exposure times greater than 20 days), a light bead blasting was needed to remove some of the thicker rust prior to or during the chemical stripping cycles. All coupons were weighed at each stage of the preparation and exposure as well as between each strip cycle. From the mass loss measurements, the average thickness loss of each coupon was calculated according to the equations in the ASTM G1 standard.
The mass loss results for the experimental and reference steels are listed in table 9 and table 10, which give the total average thickness loss for each exposure period of each pair of steel coupons for the five exposure periods.
Table 9. Steels heat treated to more than 50 ksi (345 MPa) YS total thickness loss (mil).
Steel |
0.2 Percent YS (ksi) |
10 |
20 |
40 |
70 |
100 |
ASTM A1010 control |
nd |
0.24 |
0.61 |
2.0 |
4.0 |
4.7 |
11 Cr |
73.1 |
0.45 |
1.0 |
2.3 |
4.0 |
6.7 |
9 Cr |
nd |
nd |
nd |
nd |
nd |
nd |
9Cr2Si |
75.4 |
0.72 |
2.1 |
5.5 |
12.0 |
21.5 |
7Cr2Si |
65.0 |
1.0 |
3.1 |
10.0 |
21.4 |
31.0 |
7Cr2Al |
52.2 |
1.3 |
2.9 |
7.2 |
10.1 |
15.2 |
5Cr2Si2Al |
73.9 |
1.5 |
3.4 |
9.4 |
20.2 |
28.1 |
ASTM A588 control |
nd |
2.2 |
10.0 |
22.0 |
35.4 |
52.4 |
1 ksi = 6.89 MPa 1 mil = 25.4 µm nd = Not determined. | ||||||
Table 10. Steels heat treated to more than 70 ksi (482 MPa) YS total thickness loss (mil).
Steel |
0.2 Percent YS (ksi) |
10 |
20 |
40 |
70 |
100 |
11Cr |
90.4 |
0.17 |
0.52 |
1.8 |
3.3 |
6.3 |
9 Cr |
81.2 |
1.0 |
2.9 |
6.3 |
9.9 |
14.8 |
9Cr2Si |
79.0 |
0.84 |
2.0 |
5.8 |
13.7 |
22.0 |
7Cr2Si |
78.8 |
1.0 |
3.0 |
10.5 |
23.3 |
31.6 |
7Cr2Al |
nd |
nd |
nd |
nd |
nd |
nd |
5Cr2Si2Al |
nd |
nd |
nd |
nd |
nd |
nd |
1 ksi = 6.89 MPa 1 mil = 25.4 µm nd = Not determined. | ||||||
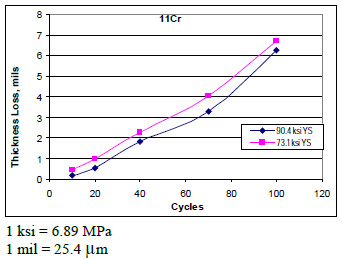
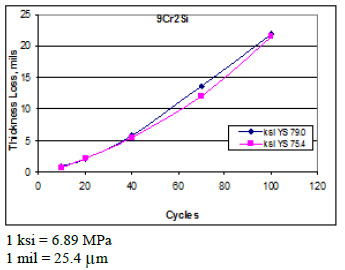
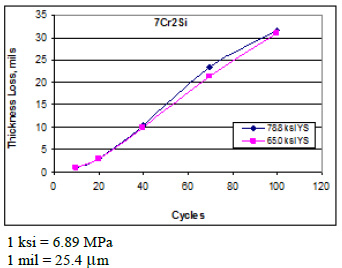
The effect of YS on the thickness loss for the 11Cr, 9Cr2Si, and 7Cr2Si steels is illustrated in figure 32 through figure 34. There is no consistent difference in thickness loss as a function of YS, and any differences that exist are small.
Figure 32. Graph. Thickness loss at two different strength levels for 11Cr steel.
Figure 33. Graph. Thickness loss at two different strength levels for 9Cr2Si steel.
Figure 34. Graph. Thickness loss at two different strength levels for 7Cr2Si steel.
The 11Cr steel at the higher strength level had slightly better corrosion resistance, but the 9Cr2Si and 7Cr2Si steels exhibited the same corrosion rates at both strength levels. It was concluded that the corrosion behavior of these steels was not a function of the steel YS. Accordingly, the thickness loss data for both strength levels for these three steels was averaged to give the best estimate for the behavior of each steel. The data are in table 11 and are illustrated in figure 23.
Table 11. CCT results using 5 percent NaCl total thickness loss (mil).
Steel |
10 |
20 |
40 |
70 |
100 |
ASTM A1010 control |
0.24 |
0.61 |
2.0 |
4.0 |
4.7 |
11Cr |
0.31 |
0.75 |
2.0 |
3.7 |
6.5 |
9Cr |
1.0 |
2.9 |
6.3 |
9.9 |
14.8 |
9Cr2Si |
0.78 |
2.1 |
5.6 |
12.9 |
21.7 |
7Cr2Si |
1.0 |
3.0 |
10.2 |
22.3 |
31.3 |
7Cr2Al |
1.3 |
2.9 |
7.2 |
10.1 |
15.2 |
5Cr2Si2Al |
1.5 |
3.4 |
9.4 |
20.2 |
28.1 |
ASTM A588 control |
2.2 |
10.0 |
22.0 |
35.4 |
52.4 |
1 mil = 25.4 µm | |||||
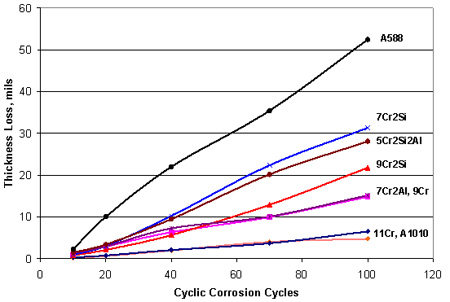
Figure 35. Graph. Summary of 5 percent NaCl CCT results.
As the number of corrosion cycles increased, the total thickness loss increased for all of the steels. The control ASTM A588 weathering steel continued to experience thickness loss at a relatively constant rate per cycle. This behavior demonstrates that the protective patina responsible for providing reduced corrosion rates for weathering steels did not form on the ASTM A588 steel when the SAE J2334 test was conducted with 5 percent NaCl. Similarly, the other steels exhibited a relatively linear rate of thickness loss, indicating that the corrosion products formed were not offering significant protection against continued corrosion.
All of the reduced Cr experimental steels had significantly less corrosion resistance than the ASTM A1010 control sample and its laboratory analog, the 11Cr steel. As the Cr content of the experimental steels decreased from 11 to 5 percent, the corrosion rate (thickness loss) increased. All of the experimental steels exhibited better corrosion resistance than the ASTM A588 control sample.
The effect of adding 2 percent Si to the 9 and 7 percent Cr steels was significantly detrimental to corrosion resistance. This is most clear in figure 35 by comparing 9Cr to 9Cr2Si. Substituting 2 percent Al for 2 percent Si in the 7 percent Cr steel had a strong positive effect on the corrosion rate. Figure 35 shows that the 7Cr2Al steel had the same corrosion performance as the 9Cr steel, suggesting that 2 percent Al was equivalent to 2 percent Cr for cyclic corrosion resistance.
Since the corrosion rates in the 5 percent NaCl CCT appear to be linear, a regression equation was calculated for each of the steels. It was assumed that the intercept of the regression line at zero cycles was zero thickness loss. The results of this analysis are presented in table 12. The high values for the coefficient of determination (R2) confirm that the corrosion rates of all the steels were linear with cycle number. The linear corrosion rates, expressed in mil per cycle, emphasize the advantage of the ASTM A1010 steel (and its experimental equivalent, 11Cr) compared to the other experimental steels and especially to conventional ASTM A588 weathering steel. Under the conditions of the 5 percent NaCl CCTs, the corrosion rate of the A1010 steel is one-tenth that of ASTM A588, and it will take 10 times longer for the same amount of thickness loss from ASTM A1010 as from ASTM A588.
Table 12. Linear regression equations for thickness loss in 5 percent NaCl CCTs.
Steel |
Coefficient |
R2 |
Thickness |
Predicted |
ASTM A1010 |
0.050 |
0.973 |
10 |
10.4 |
11Cr |
0.056 |
0.985 |
11 |
9.3 |
9Cr |
0.147 |
0.996 |
28 |
3.5 |
9Cr2Si |
0.197 |
0.960 |
38 |
2.6 |
7Cr2Si |
0.304 |
0.977 |
59 |
1.7 |
7Cr2Al |
0.152 |
0.990 |
29 |
3.4 |
5Cr2Si2Al |
0.275 |
0.985 |
53 |
1.9 |
ASTM A588 |
0.519 |
0.995 |
100 |
1.0 |
1 mil = 25.4 µm | ||||
After 4 years, ASTM A588 steel lost 10 mil (254 µm) of thickness at Moore Drive Bridge. Therefore the Moore Drive Bridge exhibited a corrosion rate of 2.5 mpy (64.5 µm per year). As shown in table 9, 10 mil (254 µm) is the same thickness loss after 20 cycles of the modified SAE J2334 test. Thus, the 100 cycles in the 5 percent NaCl CCT used in this study are equivalent to about 20 years of exposure to the deicing salts at Moore Drive Bridge.
The high and linear thickness loss rates of the CCTs using 5 percent NaCl suggest that this test is severe. Accordingly, another set of CCTs was conducted using a 3 percent NaCl spray. The exposure parameters were otherwise identical to those described above and used the SAE J2334 cyclic protocol. The same experimental Cr-containing steels were tested in the cyclic corrosion chamber along with control specimens of C steel designated A36, two weathering steels designated ASTM A588, high-performance steel (HPS) 100W, and ASTM A1010. The same coupons were used for both the 5 and 3 percent NaCl tests. Coupons were exposed in sets of triplicates, with removal being completed after 20, 40, and 70 days in the chamber. The resulting thickness loss measurements are presented in table 13.
Table 13. CCT results using 3 percent NaCl total thickness loss (mil).
Steel |
0.2 Percent YS (ksi) |
20 |
40 |
70 |
ASTM A1010 control |
nd |
0.34 |
1.2 |
3.6 |
11Cr |
73.1 |
0.41 |
1.2 |
2.6 |
9Cr |
81.2 |
3.1 |
6.2 |
14.5 |
9Cr2Si |
75.4 |
2.9 |
6.4 |
13.7 |
7Cr2Al |
54.5 |
3.8 |
6.9 |
12.2 |
HPS 100W control |
nd |
7.6 |
18.8 |
38.9 |
ASTM A588 control |
nd |
9.8 |
25.3 |
49.3 |
ASTM A36 control |
nd |
13.2 |
33.1 |
55.2 |
1 ksi = 6.89 MPa 1 mil = 25.4 µm nd = Not determined. | ||||
Similar to the results in the 5 percent NaCl test conditions, the thickness losses for each steel were essentially linear through 70 cycles. It can be concluded that lowering the NaCl concentration from 5 to 3 percent was insufficient to permit a protective patina to develop on the weathering steels or for the general corrosion conditions to change significantly for the high-Cr steels. Also consistent with the 5 percent NaCl tests, the ASTM A1010 and 11Cr steels performed similarly. These steels are more corrosion resistant than the lower Cr experimental steels and significantly more corrosion resistant than the weathering steel or C steel controls.
As described previously, regression analyses were performed assuming linear thickness loss as a function of cycle number and an intercept of zero. The coefficients for the 3 percent NaCl tests are presented in table 14. The high values R2 for all the steels underscores the linear nature of the corrosion rates in the 3 percent NaCl test conditions. For the two 11 percent Cr steels, reducing the NaCl concentration caused a reduction in their thickness loss rate.
Table 14. Linear regression equations for thickness loss CCTs.
Steel |
5 Percent NaCl |
3 Percent NaCl |
R2 |
Thickness |
Predicted |
ASTM A1010 |
0.050 |
0.044 |
0.841 |
6.5 |
15.4 |
11Cr |
0.056 |
0.035 |
0.943 |
5.2 |
19.2 |
9Cr |
0.147 |
0.192 |
0.943 |
28.4 |
3.5 |
9Cr2Si |
0.197 |
0.185 |
0.963 |
27.3 |
3.7 |
7Cr2Al |
0.152 |
0.175 |
0.997 |
25.9 |
3.9 |
HPS 100W |
nd |
0.526 |
0.985 |
78.0 |
1.3 |
ASTM A588 |
0.519 |
0.675 |
0.974 |
100.0 |
1.0 |
ASTM A36 |
nd |
0.790 |
0.990 |
117.1 |
0.9 |
1 mil = 25.4 µm nd = Not determined. | |||||
A similar small reduction in thickness loss rate was found for the 9Cr2Si steel by reducing the NaCl content of the spray solution. Unexpectedly, all of the other steels experienced a higher corrosion rate in the 3 percent NaCl test campaign than in the 5 percent NaCl tests.
Comparing the thickness loss rates of the steels relative to ASTM A588 steel reemphasizes the benefit of the ASTM A1010 steel. In this test with 3 percent NaCl, the expected corrosion life improvement of a structure made of ASTM A1010 was 15 times the corrosion life of ASTM A588. The other higher Cr steels had corrosion life improvement 3.5 to 4 times greater than ASTM A588.
Corrosion Product Identification
The types of corrosion product (rust) on the cyclic corrosion coupons exposed to the 5 percent NaCl spray were determined by x-ray diffraction (XRD). The corrosion product samples for diffraction were obtained by scraping the rust from the coupon in each set reserved for this purpose. Rust was collected from each sample to represent various locations from the coupons, including the top and bottom of the upward face of the coupon and the top and bottom of the downward face. In some cases where there was only thin rust on the coupon, the rust powder was collected from the upward-facing coupon surface (UA) and all of the downward-facing coupon surface (DA). There were instances when it was possible to collect outer and inner rust layers, and those were reserved for possible future analysis beyond the scope of the present study. The collected rust was ground to a powder less than 4.87 mil (125 µm).
All XRD patterns were recorded using a PANalytical XPert PRO x-ray diffractometer. The powder samples were held in a spinning automated sample changer and exposed to cobalt x-rays (wavelength = 1.78901Å) with an iron filter. The x-ray tube operated at 45 kV and 40 mA. The scan was generally between 10 to 80 degrees (2 theta) with an angular step size of 0.0170 degrees and total run time of 9 h 26 minutes or 4 h 43 minutes. The resulting patterns were analyzed using PANalytical software XPert Highscore Plus using ICDD® PDF®-4 database to identify standard XRD patterns for known iron oxides.(19)
To measure the chloride content of the rust, XRD data were recorded on the same powder samples using Thermo Scientific Niton portable x-ray fluorescence (XRF) spectrometer model XL3t 900S GOLDD, which is sensitive to elements whose atomic number is below that of Cl. Diffraction data were recorded for 80 to 160 s per sample. The diffraction patterns were calibrated using Nitron standards.
Table 15. Corrosion products on coupons sprayed with 5 percent NaCl (percent).
Cycles |
Steel |
Akaganeite |
Maghemite |
Goethite |
Lepidocrocite (γ-FeOOH) |
NaCl |
10 |
ASTM A1010 |
nd |
nd |
nd |
nd |
nd |
20 |
82 |
10 |
2 |
4 |
2 |
|
40 |
68 |
16 |
7 |
7 |
2 |
|
70 |
44 |
30 |
12 |
12 |
3 |
|
100 |
37 |
33 |
13 |
13 |
4 |
|
10 |
11Cr |
82 |
5 |
2 |
3 |
9 |
20 |
60 |
13 |
5 |
6 |
18 |
|
40 |
57 |
23 |
9 |
7 |
3 |
|
70 |
43 |
30 |
15 |
11 |
2 |
|
100 |
38 |
30 |
17 |
14 |
1 |
|
10 |
9Cr |
75 |
12 |
4 |
5 |
4 |
20 |
36 |
41 |
12 |
9 |
3 |
|
40 |
44 |
35 |
8 |
8 |
5 |
|
70 |
27 |
35 |
19 |
19 |
1 |
|
100 |
nd |
nd |
nd |
nd |
nd |
|
10 |
9Cr2Si |
68 |
18 |
5 |
6 |
3 |
20 |
37 |
39 |
11 |
13 |
0 |
|
40 |
42 |
35 |
10 |
11 |
3 |
|
70 |
32 |
43 |
13 |
12 |
0 |
|
100 |
44 |
39 |
8 |
9 |
0 |
|
10 |
7Cr2Si |
64 |
21 |
6 |
8 |
2 |
20 |
30 |
46 |
12 |
14 |
0 |
|
40 |
64 |
25 |
4 |
5 |
3 |
|
70 |
34 |
48 |
10 |
8 |
0 |
|
100 |
61 |
30 |
4 |
4 |
1 |
|
10 |
7Cr2Al |
60 |
23 |
6 |
7 |
4 |
20 |
26 |
47 |
16 |
11 |
0 |
|
40 |
32 |
39 |
15 |
11 |
2 |
|
70 |
23 |
39 |
19 |
19 |
1 |
|
100 |
37 |
37 |
12 |
12 |
3 |
|
10 |
5Cr2Si2Al |
61 |
21 |
7 |
9 |
3 |
20 |
30 |
42 |
12 |
16 |
0 |
|
40 |
57 |
27 |
6 |
5 |
5 |
|
70 |
55 |
34 |
7 |
4 |
0 |
|
100 |
67 |
20 |
13 |
0 |
0 |
|
10 |
ASTM A588 |
nd |
nd |
nd |
nd |
nd |
20 |
nd |
nd |
nd |
nd |
nd |
|
40 |
nd |
nd |
nd |
nd |
nd |
|
70 |
14 |
75 |
8 |
3 |
0 |
|
100 |
41 |
47 |
6 |
3 |
2 |
|
nd = Not determined. | ||||||
The results of the analyses of corrosion products on the cyclic corrosion coupons with 5 percent NaCl as the spray solution are summarized in table 15. Individual results are in appendix C of this report. There is considerable scatter in the data, but a few trends were identified. First, as the cyclic corrosion cycles increased, most of the steels exhibited a general trend where the amount of akaganeite declined and was replaced by the other oxyhydroxides maghemite, goethite, and lepidocrocite. Second, the overall amount of goethite and lepidocrocite was equal for all the steels, so these corrosion products were not responsible for the significant difference in the CCT corrosion rates among the various steels. Third, almost all the corrosion product samples contained traces of NaCl.
The overall average corrosion products for each of the steels is presented in table 16. This table is derived from table 15 by averaging the corrosion products throughout the CCT cycles. The corrosion product of the two 11 percent Cr steels contains significantly less maghemite than the steels with lower Cr content. Instead, the 11 percent Cr steels have the highest akaganeite levels. This is the reason for the significantly better corrosion rates observed for the 11 percent Cr steels.
Table 16. Overall average corrosion products from 5 percent NaCl CCTs (percent).
Steel |
Akaganeite |
Maghemite |
Goethite |
Lepidocrocite |
NaCl |
ASTM A1010 |
58 |
22 |
8 |
9 |
3 |
11Cr |
56 |
20 |
10 |
8 |
6 |
9Cr |
45 |
31 |
11 |
10 |
3 |
9Cr2Si |
45 |
35 |
9 |
10 |
1 |
7Cr2Si |
51 |
34 |
7 |
7 |
1 |
7Cr2Al |
36 |
37 |
14 |
12 |
2 |
5Cr2Si2Al |
54 |
29 |
9 |
7 |
1 |
As the Cr content of the steels decreased, the percentage of maghemite in the corrosion product increased. As noted previously, the percentage of goethite and lepidocrocite remained approximately equal for all of the Cr-containing steels, which contrasts with ASTM A588, which had very little lepidocrocite. It has been shown that in high-chloride bridge environments, ASTM A588 rust is coarse goethite and akaganeite with no epidocrocite.(20) The CCT behavior of the ASTM A588 samples are consistent with reported behavior of the steel in severe chloride bridge service.
The CCT protocol provides a high time-of-wetness, which promotes the corrosion product maghemite to form at the steel/rust interface in the presence or absence of chlorides. This is the same type of corrosion product observed on corroding steels submerged in the ocean. The high time-of-wetness decreases oxygen availability to form akaganeite. However, akaganeite is sometimes present in smaller amounts due to the surface of the rust drying during the CCT dry cycle. Once the rust thickens, drying at the steel surface under the thick rust is limited, and a high corrosion rate continues with maghemite formation. At the surface of the steel beneath the rust, an anaerobic environment exists and causes blisters with low pH to form in the presence of chloride. Blistered regions on a few of the corrosion coupons were analyzed (see appendix C of this report), and FeCl2x4H2O was found inside the blisters at pH = 2. As will be shown in the next chapter, the CCT exposure conditions do not adequately mimic the severe chloride bridge conditions at the Moore Drive Bridge. The corrosion product on ASTM A588 from the Moore Drive Bridge does not show any maghemite corrosion product because the bridge does not have high time-of-wetness.
Overall, the rust compositions for the experimental Cr steel samples with less than 11 percent Cr were similar and contained more corrosion product maghemite. The 5 percent NaCl spray solution CCT and the 3 percent NaCl tests created an aggressively corrosive environment with excessively high time-of-wetness. Because the corrosion products that form on the experimental Cr steel samples subjected to the CCT have high maghemite volumes and maghemite is not present in the corrosion products of the Moore Drive Bridge, the corrosion rates measured by the CCTs may not be representative of actual bridge service.