U.S. Department of Transportation
Federal Highway Administration
1200 New Jersey Avenue, SE
Washington, DC 20590
202-366-4000
Federal Highway Administration Research and Technology
Coordinating, Developing, and Delivering Highway Transportation Innovations
| REPORT |
| This report is an archived publication and may contain dated technical, contact, and link information |
|
| Publication Number: FHWA-HRT-11-062 Date: November 2011 |
Publication Number: FHWA-HRT-11-062 Date: November 2011 |
In the as-normalized condition, martensitic and dual-phase steels exhibit relatively high hardness, TS, and YS. The procedure to reduce the hardness and strength properties of steels is called tempering. Tempering involves heating the steel to a suitable temperature, after which the room temperature strengths and hardness are less than in the as-normalized condition. Up to a critical temperature, which is unique for each steel, the higher the tempering temperature, the lower are the resulting YS, TS, and hardness. To achieve a minimum YS of 50 ksi (345 MPa), commercially produced as-hot-rolled ASTM A1010 steel plates are tempered between 1,300 and 1,360 °F (704 and 738 °C). To obtain a YS of 70 to 85 ksi (482 to 586 MPa), which was one of the targets of this project, a somewhat lower tempering temperature needed to be identified.
The 0.3125-inch (14.3-mm)-thick as-normalized plate samples were divided into five pieces. One piece was used for determining the as-normalized mechanical properties of each steel. The other four pieces were heated to a specific tempering temperature for 20 minutes. Brinell hardness tests were conducted on each piece. Tensile specimens were machined to determine the yield and tensile properties as a function of tempering temperature (see figure 5). The intention was to determine the tempering temperature range over which a YS of 70 to 85 ksi (482 to 586 MPa) can be achieved for each candidate steel.
Table 5. Hardness of experimental steels as a function of tempering temperature.
Steel |
Heat |
As-Normalized |
1,200 ºF |
1,250 ºF |
1,300 ºF |
1,350 ºF |
11Cr |
67-V1-77 |
285 |
200 |
190 |
177 |
171 |
9Cr |
67-V1-68 |
313 |
211 |
200 |
190 |
191 |
9Cr 2Si |
67-V1-71 |
256 |
209 |
198 |
190 |
192 |
7Cr 2Si |
67-V1-73 |
258 |
209 |
198 |
196 |
194 |
7Cr 2Al |
67-V1-75 |
154 |
152 |
147 |
152 |
149 |
5Cr 2Si 2Al |
67-V1-80 |
200 |
203 |
203 |
199 |
202 |
°C = (°F-32)/1.8 | ||||||
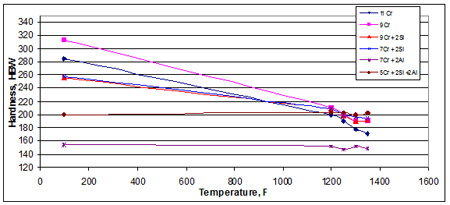
The results of the hardness tests on tempered coupons of all six steels are shown in figure 25. The hardness of the dual-phase and martensitic experimental steels decreased, as expected, when the tempering temperature increased. The hardness of the two Al-containing steels did not change during tempering. This was not unexpected based on the ferritic microstructure of these two steels, since tempering is a metallurgical phenomenon that applies to steels that have martensite in the microstructure.
Figure 25. Graph. Hardness of the experimental steels after tempering.
The tensile properties of the 0.3125-inch (14.3-mm)-thick plates were measured using standard ASTM A370 round tensile specimens with a gauge diameter of 0.357 inches (9.1 mm) and a 1-inch (25.4-mm) gauge length.(16) The specimens were machined from the transverse direction of the plates, which is the standard orientation of tensile specimens made from commercially produced bridge plates. Crosshead speed was held constant throughout the tensile test at 0.080 inches per minutes (2 mm per minute). In addition to the standard tensile test quantities of 0.2 percent YS, ultimate TS, EL, and reduction of area (RA), the strain hardening coefficient (the n-value) was also calculated between strain values of 0.030 and the strain at the maximum load.
The as-normalized tensile properties of the six experimental steels are presented in table 6. The properties of the 11Cr steel are similar to a commercially produced ASTM A1010 as-normalized plate. This plate exhibited continuous yielding behavior, as expected for a dual-phase steel. The 9Cr steel, with its fully martensitic microstructure, was somewhat stronger than the 11Cr steel in the as-normalized condition, and it was consequently considerably less ductile. The tensile specimen unexpectedly broke after only 9 percent elongation. The two lower Cr steels with 2 percent Si had equal tensile behavior to each other, but these steels were considerably lower strength than the 11Cr and 9Cr steels. The YS of the two high Si steels was essentially 80 ksi (550 MPa) in the as-normalized condition. This is within one of the targeted YS ranges of 70 to 85 ksi (482 to 586 MPa). The 7Cr2Al steel had low tensile properties in the as-normalized condition. The as-normalized YS of this steel was just enough to achieve the 50- to 65-ksi (345- to 448-MPa) targeted YS range. A flaw in the tensile specimen caused it to fail outside the gauge length so no elongation value could be determined for this steel. However, the reduction in area value of only 14 percent indicates the steel has limited tensile ductility. Although the 5Cr2Si2Al steel is not as weak as the 7Cr2Al steel, its ductility is worse.
Table 6. Tensile properties of as-normalized steel plates.
Steel |
Hardness (HBW) |
0.2 Percent YS (ksi) |
TS (ksi) |
EL (Percent) |
RA (Percent) |
n-value |
Comment |
11Cr |
285 |
91.9 |
134.5 |
23.1 |
57.8 |
— |
Continuous yielding |
9Cr |
313 |
109.8 |
148.3 |
9.0 |
39.7 |
— |
Broke at |
9Cr2Si |
256 |
80.4 |
121.7 |
29.6 |
64.0 |
0.118 |
Continuous yielding |
7Cr2Si |
258 |
79.1 |
121.1 |
29.9 |
68.8 |
0.120 |
Continuous yielding |
7Cr2Al |
154 |
54.5 |
70.2 |
— |
14.0 |
0.173 |
Broke outside reduced section |
5Cr2Si2Al |
200 |
76.6 |
81.5 |
2.1 |
2.6 |
— |
Broke at |
1 ksi = 6.89 MPa — Indicates that the value could not be determined due to experimental difficulties. | |||||||
The tensile properties of the experimental steels were measured after various tempering treatments. The detailed results of these extensive tempering studies are presented in appendix B of this report. A summary of the YS of the tempered coupons of all six steels are shown in figure 26, and TS is shown in figure 27.
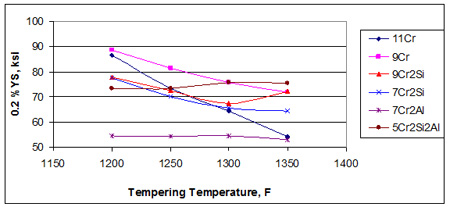
1 ksi = 6.89 MPa
°C = (°F-32)/1.8
Figure 26. Graph. YS of experimental steels after normalizing and tempering.
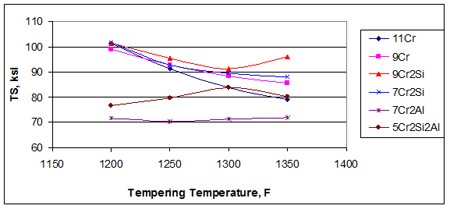
1 ksi = 6.89 MPa
°C = (°F-32)/1.8
Figure 27. Graph. TS of experimental steels after normalizing and tempering.
The 11Cr steel responded to tempering as expected. As the tempering temperature increased, YS and TS continuously decreased. The 9Cr and the 7Cr2Si steels responded to tempering in the same manner. The 9Cr2Si steel exhibited an unexpected increase in YS and TS when the tempering temperature increased from 1,300 to 1,350 °F (704 to 732 °C). Interestingly, the 7Cr2Al and 5Cr2Si2Al steels maintained essentially the same YS as the tempering temperature increased.
All of the steels, except 5Cr2Si2Al, can be normalized and tempered to achieve the targeted 50- to 65-ksi (345- to 448-MPa) YS range and greater than the 70-ksi (482-MPa) minimum TS requirement representative of ASTM A709-50W.(2) All of the steels, except 5Cr2Si2Al and 7Cr2Al, can be normalized and tempered to achieve the ASTM A709-70W target YS of 70 to 85 ksi (482 to 586 MPa) and the TS requirement of 85 to 110 ksi (586 to 758 MPa).
To prepare the experimental steels for CVN impact testing, 0.3125-inch (14.3-mm)-thick as-normalized plates were tempered at two different temperatures. The tempering temperatures used for each steel were based on the data in figure 26 and are presented in table 7. Coupons for corrosion testing, which is described later in this report, were also prepared by tempering, as shown in table 7. The target YS level for the CVN impact tests was between 50 and 65 ksi (345 and 448 MPa) to represent a 50-ksi (345-MPa) minimum YS steel, and it was between 70 and 85 ksi (482 and 586 MPa) to represent a 70-ksi (482-MPa) minimum YS steel. Since three of the steels (9Cr, 7Cr2Al, and 5Cr2Si2Al) met the latter strength range in the as-normalized condition, they were impact tested as-normalized in only one tempered condition.
Table 7. Tempering temperatures for CVN impact energy and corrosion studies.
Steel |
Aim > 50 ksi YS |
Aim > 70 ksi YS |
11Cr |
1,350 |
1,200 |
9Cr |
1,350 |
As-normalized |
9Cr2Si |
1,350 |
1,200 |
7Cr2Si |
1,350 |
1,200 |
7Cr2Al |
1,200 |
As-normalized |
5Cr2Si2Al |
1,200 |
As-normalized |
1 ksi = 6.89 MPa °C = (°F-32)/1.8 | ||
The CVN impact test absorbed energies of the experimental steels and were determined at four test temperatures: 70, 40, 10, and -10 °F (21, 4, -12, and -23 °C). Two or three Charpy test bars were tested at each temperature. The results are tabulated in table 8 and shown in figure 28 and figure 29.
Table 8. CVN impact test results (ft-lb).
Steel |
Aim > 50 ksi YS |
Aim > 70 ksi YS |
||||||
-10 ºF |
10 ºF |
40 ºF |
70 ºF |
-10 ºF |
10 ºF |
40 ºF |
70 ºF |
|
FC, minimum |
|
> 30 |
|
|
> 35 |
|
|
|
NFC, minimum |
|
> 20 |
|
|
> 25 |
|
|
|
11Cr |
85 |
109 |
118 |
154 |
80 |
100 |
114 |
124 |
9Cr |
|
4 |
7 |
61 |
|
4 |
11 |
39 |
9Cr2Si |
|
8 |
32 |
46 |
|
4 |
6 |
24 |
7Cr2Si |
|
3 |
19 |
34 |
|
7 |
8 |
13 |
7Cr2Al |
|
|
|
4 |
|
|
|
4 |
5Cr2Si 2Al |
|
|
|
3 |
|
|
|
3 |
1 ft-lb = 0.1383 m-kg °C = (°F-32)/1.8 1 ksi = 6.89 MPa Note: Bold values indicate results that failed to meet the bridge steel CVN impact toughness requirement. Empty cells indicate tests were not conducted because the steels were found to have low impact energies from the results of testing at higher temperatures. | ||||||||
Table 8 also shows the FC and NFC CVN minimum requirements for the two steel strength levels of 50 and 70 ksi (345 and 482 MPa). If a steel plate fails to meet the absorbed energy levels in this table, the plate cannot be used because bridge safety might be compromised.
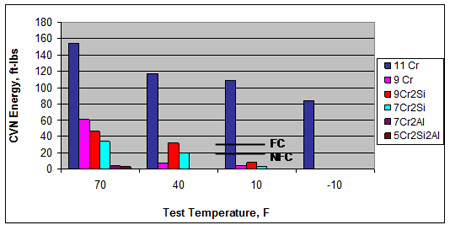
°C = (°F-32)/1.8
1 ft-lb = 1.3558 J
Figure 28. Graph. Average CVN absorbed energy values for experimental steels tempered to achieve YS greater than 50 ksi (345 MPa).
°C = (°F-32)/1.8
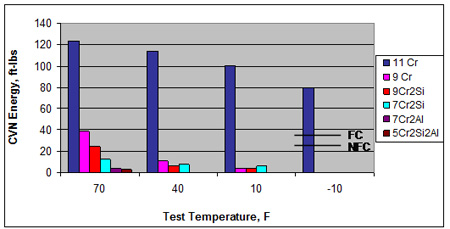
1 ft-lb = 1.3558 J
Figure 29. Graph. Average CVN absorbed energy values for experimental steels tempered to achieve YS greater than 70 ksi (482 MPa).
At the 50-ksi (345-MPa) YS level, only 11Cr representing the ASTM A1010 steel exhibited sufficient impact toughness to be a candidate for bridge construction. Similarly, at the 70-ksi (482-MPa) YS level, only 11Cr was a candidate due to the low impact toughness of the other experimental steels. Figure 25 and figure 26 illustrate the significantly superior impact energies for the ASTM A1010 steel compared to the other experimental plates. The impact toughness results for the experimental steels were disappointing, but they may be explained by the optimum dual-phase microstructure of 11Cr with fine grain size compared to the other steels. While further metallurgical development of the lower Cr steels is possible to improve impact toughness, it is desirable to determine the corrosion performance of the lower Cr steels to determine if there is a strong incentive for such work.