U.S. Department of Transportation
Federal Highway Administration
1200 New Jersey Avenue, SE
Washington, DC 20590
202-366-4000
Federal Highway Administration Research and Technology
Coordinating, Developing, and Delivering Highway Transportation Innovations
| REPORT |
| This report is an archived publication and may contain dated technical, contact, and link information |
|
| Publication Number: FHWA-HRT-11-062 Date: November 2011 |
Publication Number: FHWA-HRT-11-062 Date: November 2011 |
The steels used this project were designed on the basis of the existing ASTM A1010 grade 50 steel that has been manufactured since the early 1990s. While examining lower Cr variants of the ASTM A1010 steel, the alloy design approach was to maintain excellent weldability and formability by restricting the C content of the candidate steels to less than 0.02 percent. To achieve the 50- and 70-ksi (345- and 482-MPa) targeted YSs, the compositions were designed to have either a fully martensitic or a dual-phase (martensite plus ferrite) microstructure. The CI value as calculated using ASTM G101 was selected to be 9.5 or greater.
Table 3. Composition of experimental 100-lb (45-kg) heats.
Steel |
11Cr |
9Cr |
9Cr 2Si |
7Cr 2Si |
||||
Heat No. |
67-V1-77 |
67-V1-78 |
67-V1-68 |
67-V1-69 |
67-V1-70 |
67-V1-71 |
67-V1-73 |
67-V1-74 |
C |
0.015 |
0.017 |
0.018 |
0.019 |
0.017 |
0.017 |
0.020 |
0.018 |
Mn |
1.27 |
1.28 |
1.28 |
1.30 |
1.28 |
1.28 |
1.28 |
1.28 |
P |
0.024 |
0.021 |
0.024 |
0.024 |
0.026 |
0.025 |
0.023 |
0.023 |
S |
0.003 |
0.003 |
0.003 |
0.003 |
0.003 |
0.003 |
0.003 |
0.003 |
Cu |
0.08 |
0.08 |
0.20 |
0.20 |
0.20 |
0.20 |
0.20 |
0.20 |
Ni |
0.46 |
0.45 |
0.46 |
0.46 |
0.45 |
0.44 |
0.45 |
0.44 |
Cr |
11.65 |
11.66 |
8.83 |
8.68 |
8.53 |
8.51 |
7.00 |
6.98 |
Mo |
0.26 |
0.26 |
0.27 |
0.27 |
0.26 |
0.26 |
0.26 |
0.26 |
Si |
0.49 |
0.49 |
0.44 |
0.47 |
1.94 |
1.99 |
1.96 |
1.96 |
V |
0.025 |
0.025 |
0.023 |
0.024 |
0.023 |
0.023 |
0.024 |
0.023 |
Al |
0.012 |
<.012 |
<.009 |
<.009 |
0.014 |
0.014 |
0.019 |
0.014 |
N |
0.0153 |
0.015 |
0.0164 |
0.0146 |
0.0138 |
0.0145 |
0.0149 |
0.0141 |
Steel |
7Cr 2Al |
5Cr 2Si 2Al |
Extra 11Cr |
Extra 9Cr 2Si |
||||
Heat No. |
67-V1-75 |
67-V1-76 |
67-V1-79 |
67-V1-80 |
67-V1-66 |
67-V1-67 |
67-V1-82 |
67-V1-83 |
C |
0.015 |
0.011 |
0.010 |
0.014 |
0.015 |
0.014 |
0.016 |
0.012 |
Mn |
1.29 |
1.27 |
1.27 |
1.27 |
1.35 |
1.30 |
1.22 |
1.24 |
P |
0.023 |
0.022 |
0.017 |
0.018 |
0.026 |
0.027 |
0.023 |
0.023 |
S |
0.003 |
0.002 |
0.002 |
0.002 |
0.003 |
0.002 |
0.003 |
0.003 |
Cu |
0.20 |
0.20 |
0.20 |
0.19 |
0.08 |
0.08 |
0.19 |
0.20 |
Ni |
0.44 |
0.44 |
0.43 |
0.43 |
0.45 |
0.46 |
0.43 |
0.44 |
Cr |
6.94 |
6.99 |
4.94 |
4.94 |
10.78 |
11.09 |
8.84 |
8.91 |
Mo |
0.27 |
0.26 |
0.26 |
0.25 |
0.26 |
0.26 |
0.26 |
0.26 |
Si |
0.53 |
0.52 |
1.99 |
1.98 |
0.46 |
0.47 |
1.90 |
1.95 |
V |
0.017 |
0.022 |
0.022 |
0.023 |
0.023 |
0.022 |
0.022 |
0.023 |
Al |
1.968 |
1.994 |
1.965 |
1.999 |
<.012 |
<.012 |
<.009 |
<.009 |
N |
0.0100 |
0.0095 |
0.0074 |
0.0085 |
0.0168 |
0.0156 |
0.0157 |
0.0151 |
Melting was performed in an induction furnace under a vacuum. Originally, six 100-lb (45-kg) heats were scheduled to be cast, one heat for each steel. However, two or four heats of the steels were ultimately made to secure sufficient steel to perform all of the scheduled tests. The heats were all chemically analyzed to confirm that they complied with the targeted compositions. As shown in table 3, the compositions of the replicate heats of each steel are close. As a result, the replicates were treated as identical steels.
Each heat was poured in vacuo into iron molds. The resulting 100-lb (45-kg) ingots measured approximately 5 x 5 x 13 inches (125 x 125 x 350 mm). The ingots were prepared for rolling by milling opposite faces that would become the plate surfaces, trimming the side faces, and cutting off some of the hot top region.
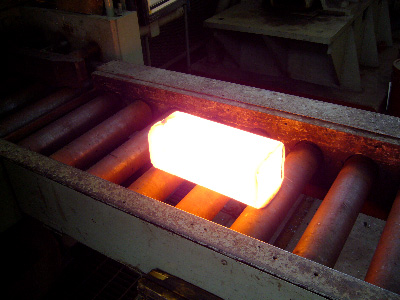
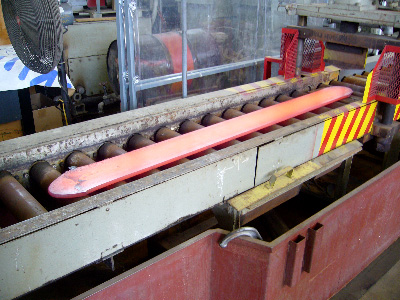
The ingots were heated one at a time in an electric furnace to 2,300 °F (1,260 °C) and hot rolled. The rolling schedule was designed to reduce the ingots from a thickness of approximately 5 inches (125 mm) to 0.56 inches (14.3 mm) in 11 passes. Figure 8 and figure 9 show an ingot prior to its first pass and after its last pass, respectively. At the conclusion of hot rolling, the plates were propped on their long edge and allowed to air cool.
Figure 8. Photo. Heat 67-V1-83 being hot rolled prior to first pass.
Figure 9. Photo. Heat 67-V1-83 being hot rolled after last pass.
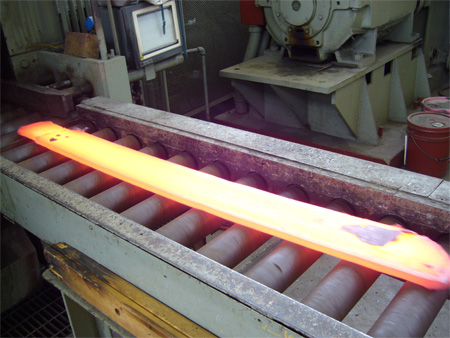
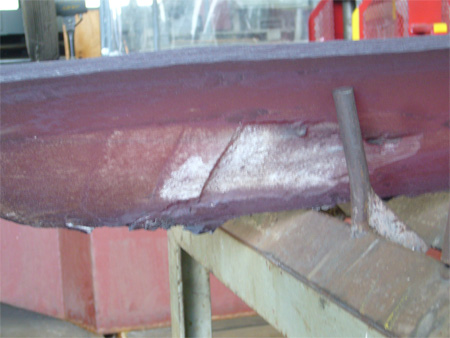
With one exception, the steels completed the hot rolling operation with good surface and edge conditions. The exception, 5Cr2Si2Al (Heat 67-V1-79), exhibited moderate cracking near the bottom of the ingot. Figure 10 shows the scab condition during rolling, and figure 11 shows the scab condition while the plate was cooling. When hot rolled, the crack extended into a large scab on the top plate surface. This behavior, although it was not observed on the duplicate steel heat, indicates that the steel was inherently difficult to continuously cast and hot roll to plate.
The ingots of the extra heats were put aside and stored in the event of production problems or to provide material for future studies.
After cooling to room temperature, the as-rolled plates were saw cut into 12-inch (300-mm) pieces. The pieces were labeled in sequence starting at the bottom with A, B, C, and D. The pieces from each plate closest to the top of the original ingot were labeled Y or Z. Some of the 0.3125-inch (14.7-mm)-thick pieces were heat treated, as described in the next section, while others were heated again and hot rolled as described in chapter 4. The disposition of all the plates and pieces cut is shown in appendix A.
Figure 10. Photo. Heat 67-V1-79 being hot rolled and showing scab.
Figure 11. Photo. Heat 67-V1-79 after hot rolling and showing scab.
Representative 12-inch (300-mm) pieces of each steel were heated in an electric furnace at 1,650 °F (900 °C) and normalized (air cooled) to simulate commercial plate normalizing. The hold time was 56 minutes at 1,650 °F (900 °C). At the end of the hold time, the plates were withdrawn from the furnace, placed on a rack, and allowed to air cool.
The microstructures of the as-normalized steels were examined to determine which, if any, achieved the desired dual-phase microstructure of ferrite plus martensite. All steels were prepared for metallography by sectioning a longitudinal plane from the plate, conventionally mounting in bakelite, grinding, and polishing. The etchant used was Villela’s reagent consisting of one part nitric acid, two parts hydrochloric acid, and three parts glycerol.
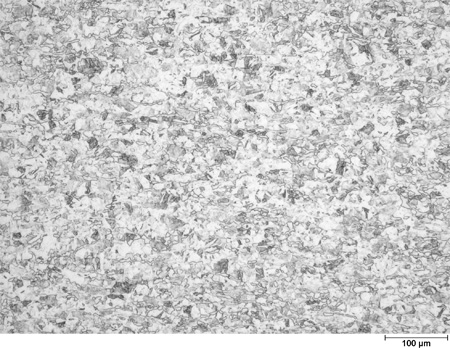
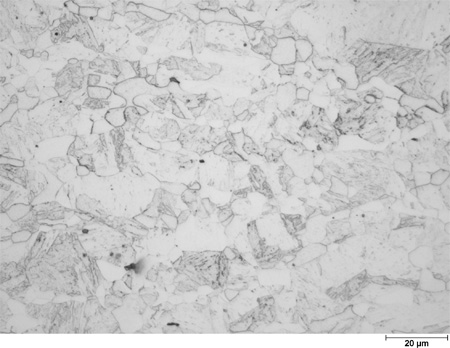
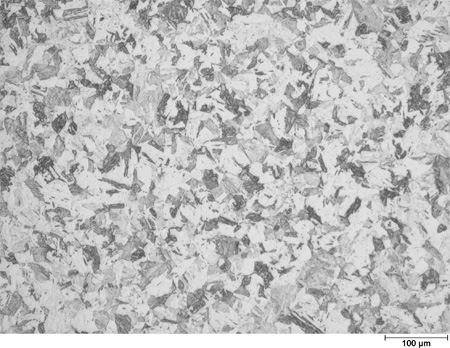
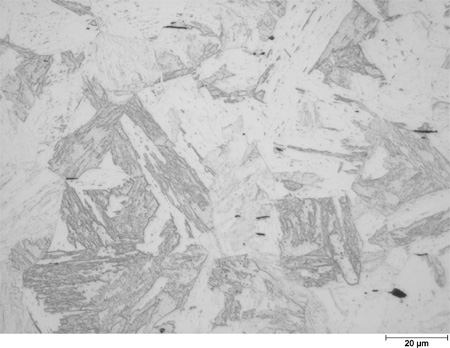
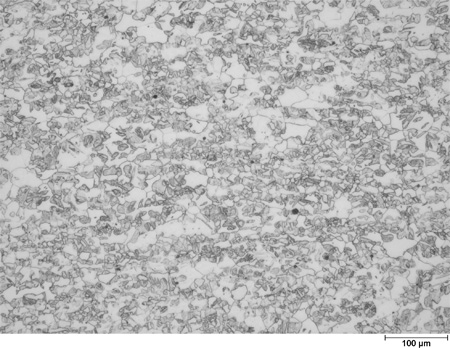
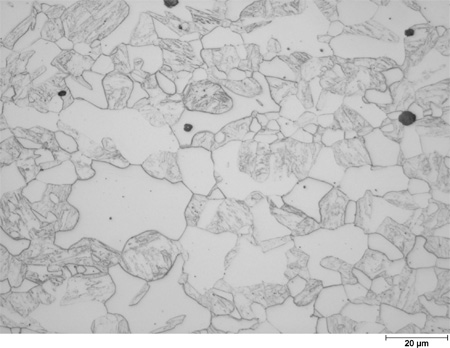
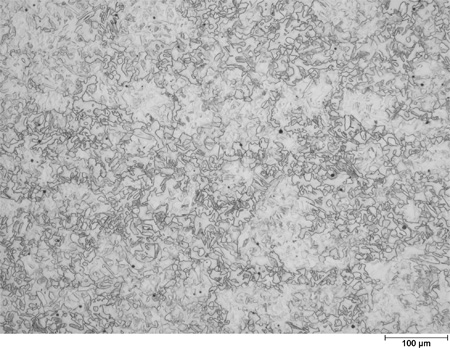
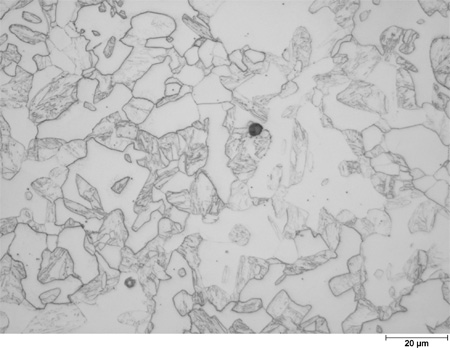
The base ASTM A1010 steel, designated 11Cr, is shown in figure 12 and figure 13 and exhibits the expected dual-phase microstructure of ferrite plus martensite. In the figures, the darker-etching regions are martensite, and the white grains are ferrite. Reducing the Cr content from 11 to 9 percent changed the microstructure to martensite with no ferrite present. Figure 14 and figure 15 show the single-phase martensite microstructure of 9Cr. This plate is in the as-normalized condition and has significantly coarser microstructure than the dual-phase 11Cr steel.
By adding 2 percent Si to the 9 percent Cr steel, the microstructure once again becomes dual-phase martensite plus ferrite, as shown in figure 16 and figure 17. There is more ferrite and less martensite in 9Cr2Si than in the base ASTM A1010 microstructure. The ferrite grains, in particular, are much larger in 9Cr2Si than in 11Cr.
Figure 12. Photo. Microstructure of 11Cr plate from heat 67-V1-77 in the as-normalized condition: 100X.
Figure 13. Photo. Microstructure of 11Cr plate from heat 67-V1-77 in the as-normalized condition: 500X.
Figure 14. Photo. Microstructure of 9Cr plate from heat 67-V1-68 in the as-normalized condition: 100X.
Figure 15. Photo. Microstructure of 9Cr plate from heat 67-V1-68 in the as-normalized condition: 500X.
Figure 16. Photo. Microstructure of 9Cr2Si plate from heat 67-V1-71 in the as-normalized condition: 100X.
Figure 17. Photo. Microstructure of 9Cr2Si plate from heat 67-V1-71 in the as-normalized condition: 500X.
The strong ferrite-forming effect of Si is still sufficient in the 7Cr2Si steel to retain the dual-phase microstructure of ferrite plus martensite as shown in figure 18 and figure 19. The microstructures of the two 2 percent Si steels are similar to one another despite the different Cr contents (9 and 7 percent) of the two steels.
Figure 18. Photo. Microstructure of 7Cr2Si plate from heat 67-V1-73 in the as-normalized condition: 100X.
Figure 19. Photo. Microstructure of 7Cr2Si plate from heat 67-V1-73 in the as-normalized condition: 500X.
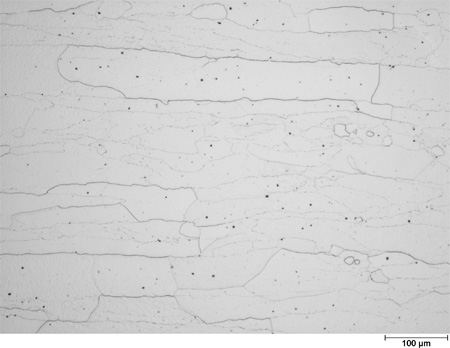
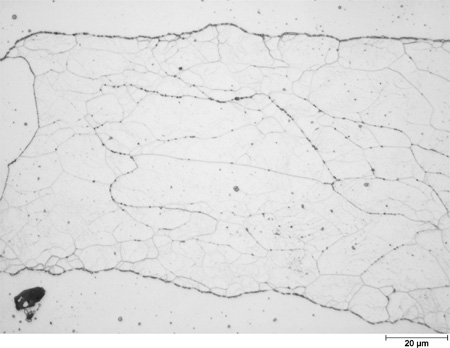
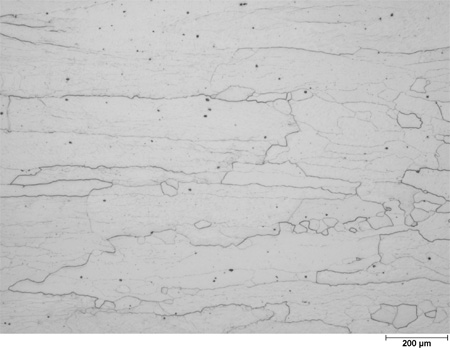
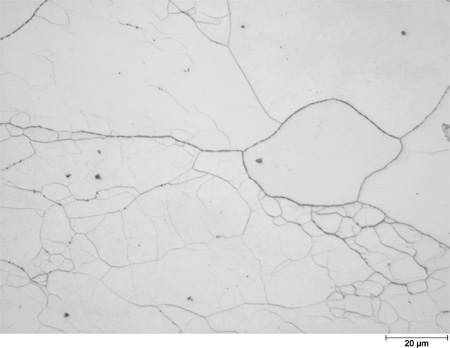
Substituting 2 percent Al for the Si in the 7 percent Cr steel has a profound effect on the as-normalized microstructure in figure 20 and figure 21. Note that in figure 20, the lower magnification micrograph was originally taken at 50X rather than 100X that was used for the other steels. In the case of the 7Cr2Al steel plate, the as-normalized microstructure is all ferrite with no martensite. The large ferrite grains are elongated in the rolling direction, and the grain boundaries are decorated with precipitates. There are also many subgrains within the larger elongated ferrite grains in 7Cr2Al. Steel 5Cr2Si2Al has a microstructure similar to 7Cr2Al as shown in figure 22 and figure 23. Both these steels with 2 percent Al also contained large concentrations of nonmetallic inclusions, indicated by the dark particles scattered in figure 20 through figure 23.
Figure 20. Photo. Microstructure of 7Cr2Al plate from heat 67-V1-75 in the as-normalized condition: 50X.
Figure 21. Photo. Microstructure of 7Cr2Al plate from heat 67-V1-75 in the as-normalized condition: 500X.
Figure 22. Photo. Microstructure of 5Cr2Si2Al plate from heat 67-V1-80 in the as-normalized condition: 50X.
Figure 23. Photo. Microstructure of 5Cr2Si2Al plate from heat 67-V1-80 in the as-normalized condition: 500X.
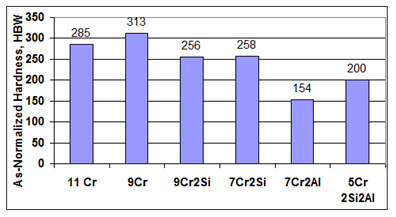
The results of standard Brinell hardness tests on the as-normalized plates are presented in table 4 and figure 24. Based on the general relationship between the hardness of nonaustenitic steels and TS, as expressed in ASTM A370, the hardness of the three dual phase steels and the fully martensitic steel appear to be sufficiently high (greater than 220 Brinell hardness number (HBW)) that after tempering, they could be expected to achieve the desired 50-ksi (345-MPa) YS and potentially the 70-ksi (482-MPa) target YS.(16) However, the two steels containing 2 percent Al and with all ferrite microstructure exhibited hardness values that were low, suggesting that their tensile properties would not meet the project goals.
Table 4. As-normalized hardness and microstructure.
Steel |
Heat |
Hardness (HBW) |
Microstructure |
11Cr |
67-V1-77 |
285 |
Dual-phase ferrite plus martensite |
9Cr |
67-V1-68 |
313 |
All martensite |
9Cr 2Si |
67-V1-71 |
256 |
Dual-phase—more ferrite than 11 percent Cr |
7Cr 2Si |
67-V1-73 |
258 |
Dual-phase—more ferrite than 11 percent Cr |
7Cr 2Al |
67-V1-75 |
154 |
All ferrite |
5Cr 2Si 2Al |
67-V1-80 |
200 |
All ferrite |
Figure 24. Graph. Hardness of as-normalized experimental steels.