U.S. Department of Transportation
Federal Highway Administration
1200 New Jersey Avenue, SE
Washington, DC 20590
202-366-4000
Federal Highway Administration Research and Technology
Coordinating, Developing, and Delivering Highway Transportation Innovations
| REPORT |
| This report is an archived publication and may contain dated technical, contact, and link information |
|
| Publication Number: FHWA-HRT-10-035 Date: September 2011 |
Publication Number: FHWA-HRT-10-035 Date: September 2011 |
To accomplish the goals of the project, modulus values from multiple mixtures and binders were necessary. These databases were assembled from existing national efforts and from data obtained at NCSU. In the following sections, the databases are summarized by material type (i.e., binder or mixture). First, the specific reasons for such databases are given.
The most comprehensive database for both binder moduli and viscosity and mixture moduli that is currently available is the one used to develop the Witczak and modified Witczak models. This database is extensive and covers a range of material characteristics. At the outset of this project, such a database was sufficient to meet the project goals. However, an indepth evaluation of the database identified the following three problems in using it for model development:
In developing the Witczak database, researchers used two definitions for frequency. The decision to use two definitions was motivated by widespread confusion between frequency and time for LVE materials and the differences in the binder and mixture fields. Researchers studying asphalt binders have been influenced by rheology and often cite the relationship between time and frequency as follows:
| (10) |
Where:
| ω | = | Angular frequency in radians per second. |
|---|---|---|
| t | = | Time. |
| fs | = | Shear frequency. |
Conversely, researchers who focus on AC tend to use the argument that time and frequency are related as follows:
| (11) |
Where:
| f | = | Frequency (hertz). |
|---|---|---|
| fc | = | Frequency under axial compression. |
This latter interpretation is more accurate if the time under consideration is the pulse time (i.e., it equates the modulus at a given frequency to the appropriate modulus when the material is subjected to a load pulse of a given duration). The former definition is more accurate when it is necessary to equate the modulus determined at a given frequency to the material modulus under a fixed load after a given duration.
The use of different definitions for frequency appears to be an effort to appease both mixture and binder branches and their techniques for data interpretation. To coordinate these two datasets, the Witczak data match time from equations 10 and 11. Such an approach allows the prediction of the modulus of AC at 10 Hz and 77 °F (25 °C). As a result, the appropriate binder modulus that can substitute into equation 2 is the one at 10 rad/s (1.59 Hz) and 77 °F (25 °C). This is referred to as the inconsistent definition of frequency in this report because the frequency at which |E*| and |G*| are measured is not consistent. A small sample of the database that clearly shows this inconsistent definition is shown in table 3.
| Mix Number | Temperature (°C) | Mixture |E*| Test Data | Binder Stiffness Data | |||
|---|---|---|---|---|---|---|
| fc (Hz) | |E*| (psi) | fs(Hz) | |G*| (psi) | σ b (degrees) | ||
| 1 | 4.4 | 1 | 1.35E+06 | 0.16 | 9.81E+02 | 54.7 |
| °C =(°F-32)/1.8 |
||||||
A more logical approach, which was used in all of the other |G*|-based models and is presented in table 2, is to use a consistent definition for frequency. To predict the mixture modulus at 10 Hz and 77 °F (25 °C), the logical binder modulus that should be used is the one at 10 Hz and 77 °F (25 °C). Such an effort required the complete repopulation of the Witczak database, which was part of the effort in this project.
Because part of this research effort was to assess the sensitivity of existing models, independent databases were needed. These databases are summarized in the following sections; however, it should be noted that for fairness, care was taken to ensure that the inconsistent definition was used to make predictions using the modified Witczak model. The consistent definition was used for development of the ANN-based model.
The |G*| data in the Witczak database are not measured values and were estimated using the predictive equations given in equations 3–5. Such an approach was deemed necessary for consistency purposes. Even though the |G*| binders were measured for several of the mixtures, no such data were available for approximately half of the mixtures in the database. By using |G*| from the predictive equations, the entire database could be used to develop the modified Witczak model. Therefore, the effects of the errors in the binder modulus model were integrated into the predictive capabilities of the model. To evaluate the predictive power of these models and to assess the need to return to the measured data, the measured and predicted |G*| and δb values for the 8,940 data points from 41 binders (including 9 modified binders) used in developing equations 3–5 were compared. Figure 3 illustrates that the model shows little bias, but the errors in the predictive models are significant. In some cases, the errors exceeded 100 percent, which could translate directly to errors in the predicted mixture moduli. The predicted δb is shown in figure 4, and the errors were even more significant than they were for the predicted |G*|. Again, such errors can have a significant effect on the predictive model's capabilities. An independent dataset was also used to assess the errors, and the results are shown in figure 5 (arithmetic scale) and figure 6 (logarithmic scale). This analysis shows that any given binder may have significant bias, the effects of which will directly translate to |E*| predictions.
To correct this problem, the binder data in the Witczak database were completely ignored, and only mixtures that had independently measured |G*| values available were used. This approach reduced the number of usable mixtures to approximately half the number that was initially thought to be available.
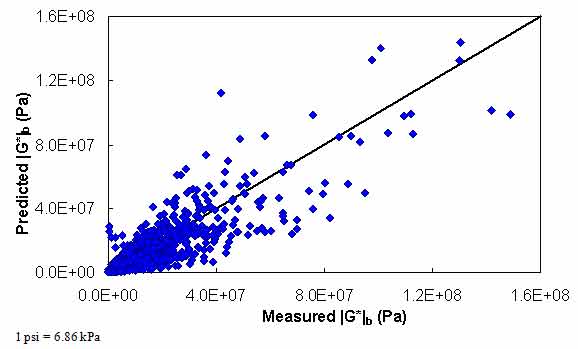
Figure 2. Graph. Comparison between the Witczak predictive model and measured |G*|b values in arithmetic scale.
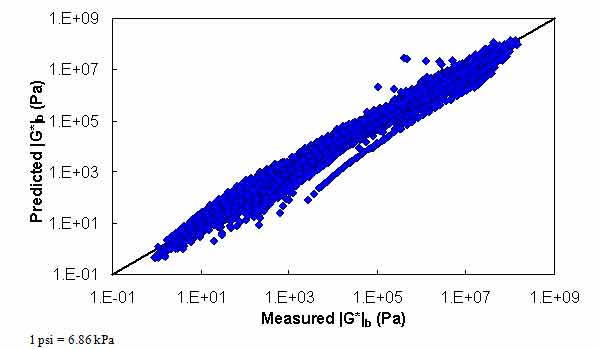
Figure 3. Graph. Comparison between the Witczak predictive model and measured |G*|b values in logarithmic scale.
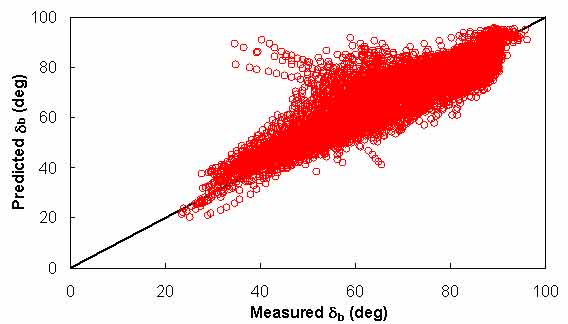
Figure 4. Graph. Comparison between the Witczak predictive model and measured σb to develop the σb model.
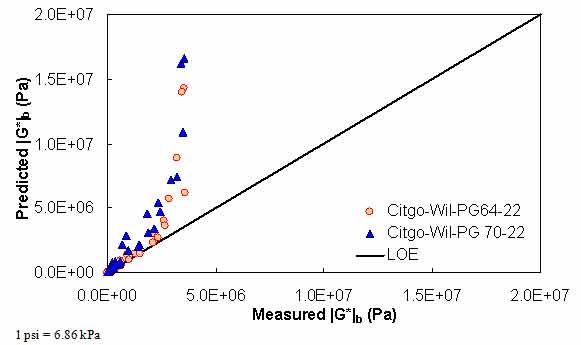
Figure 5. Graph. Comparison between the Witczak predictive model and measured |G*|b values using Citgo binders in the North Carolina Department of Transportation (NCDOT) database in arithmetic scale.
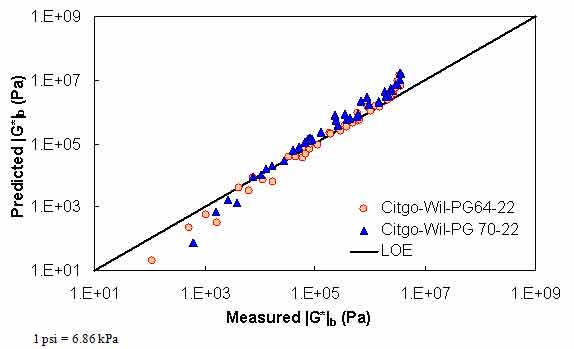
Figure 6. Graph. Comparison between the Witczak predictive model and measured |G*|b values using Citgo binders in the NCDOT database in logarithmic scale.
Through the process of determining that the binder data in the Witczak database consist of predicted values, it was also found that the low-temperature binder moduli were not determined in the same way as the intermediate and high temperatures. It was not possible to discern how these values were determined for the database because they do not agree with the predictions made from a surrogate model. Additionally, they are approximately two orders of magnitude smaller than typical values for these temperatures. Measured moduli for the available binders were provided only for temperatures as low as 59 °F (15 °C).
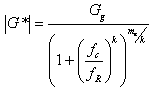
To address this problem, the measured binder data that were available had to be processed in a way that would allow extrapolation. According to the Christensen Anderson Marasteanu (CAM) model, shown in equations 12 and 13, the following is assumed for all binders in the database:
 |
(12) |
| (13) |
Where:
| Gg | = | Maximum shear modulus or glassy modulus (pascal). |
|---|---|---|
| δ | = | Binder phase angle (degree). |
| fR | = | Reduced frequency (hertz). |
| fc, me, and k | = | Fitting coefficients. |
Equation 12 has been characterized for each of the binders using least square optimization techniques. The fit was verified, and the low-temperature binder stiffness was determined. Note that for consistency, this functional form was also used to populate the binder data at the same temperatures as the |E*| measurements. Unfortunately, the Witczak binders do not provide available data to assess potential errors using this extrapolation methodology. To fully assess the errors, additional binder data, which include bending beam rheometer (BBR) measurements or shear modulus measurements taken at extremely low temperatures, and dynamic shear rheometer (DSR) measurements at intermediate and high temperatures are required.
After accounting for these binder data issues, it was found that the lack of binder data at different aging levels is a serious limitation of the Witczak database. This limitation is important because the LTPP database contains binder modulus values at original-, RTFO-, PAV-aged, and even recovered conditions. Accounting for these inconsistencies in the analysis process required an understanding of their effects on the binder shear modulus. Because the data in the Witczak database are insufficient for this purpose, additional binder databases were necessary.
There are six binder datasets: (1) Witczak, (2) FHWA mobile trailer, (3) FHWA TPF-5(019), (4) NCDOT, (5) Western Research Institute (WRI), and (6) Citgo.(15) The following sections describe these binder datasets.
Table 4 summarizes the binders that make up the Witczak binder database. Each of these binders corresponds to a particular mixture or mixtures in the Witczak |E*| database. The binders in this database have measured |G*| values available at a range of temperatures and frequency combinations as well as various aging conditions (original, RTFO, and PAV). Additionally, in table 4, a subset of these binders has measured BBR results. Note that the Citgo and WRI binders are the only ones with BBR data. Each binder has BBR stiffness and slope values at −11.2, −0.4, and 10.4 °F (−24, −18, and −12 °C) (WesTrack) or −22, −11.2, and −0.4 °F (−30, −24, and −18 °C) (all others) and times of 8, 15, 30, 60, 120, and 240 s, respectively. All binders in this database have viscosity data in the form of temperature susceptibility function parameters A and VTS.
| Binder Code | Temperature(°C) | Frequency(rad/s) | Performance Grade (PG) | Original | RTFO | PAV | BBR Available |
|---|---|---|---|---|---|---|---|
| ALF AC-5 | 15, 25, 35, 45, 60, 70, 80, 95, 105, and 115 | 1, 1.59, 2.51, 3.98, 6.31, 10, 15.9, 25.1, 39.8, 63.1, and 100 | 58 | ✔ | ✔ | ✔ | ✔ |
| ALF AC-10 | ✔ | ✔ | ✔ | ✔ | |||
| Paramount PG 58-22 |
✔ | ✔ | ✔ | ||||
| ALF AC-20 | 64 | ✔ | ✔ | ✔ | ✔ | ||
| WesTrack | ✔ | ✔ | ✔ | ✔ | |||
| Chevron PG 64-22 | ✔ | ✔ | ✔ | ||||
| Paramount PG 64-16 |
✔ | ✔ | ✔ | ||||
| Navajo PG 70-10 | 70 | ✔ | ✔ | ✔ | |||
| ALF-Novophalt | 76 | ✔ | ✔ | ✔ | ✔ | ||
| Chevron PG 76-16 | ✔ | ✔ | ✔ | ||||
| Navajo PG 76-16 | ✔ | ✔ | ✔ | ||||
| ALF-Styrelf | 82 | ✔ | ✔ | ✔ | ✔ | ||
| MNRD120P | 15, 25, 35, 45, 60, 70, 80, 95, and 105 | 58 | ✔ | ✔ | ✔ | ✔ | |
| MNRDAC20 | 64 | ✔ | ✔ | ✔ | ✔ | ||
| MPA Citgo 70-22 | 25, 35, 45, 60, 70, 80, 95, 105, and 115 | 70 | ✔ | ✔ | ✔ | ||
| MPA-Elvaloy | 76 | ✔ | ✔ | ✔ | |||
| MPA-TA | ✔ | ✔ | ✔ | ||||
| MPA-Novophalt | 82 | ✔ | ✔ | ✔ | |||
| MPA-Stylink | ✔ | ✔ | ✔ | ||||
| °C = (°F−32)/1.8 |
|||||||
°C = (°F−32)/1.8
Note: Blank cells indicate data are unavailable in the database.
The FHWA mobile trailer database contains original-, RTFO-, and PAV-aged |G*| values for a range of binders throughout the United States (see table 5). Note that the temperature and frequency combinations are not as consistent or as broad as those in the Witczak database. All of the asphalt binders in this database have viscosity data available.
| Binder Code | Temperature (°C) | Frequency (rad/s) | PG | Original | RTFO | PAV | BBR Available |
|---|---|---|---|---|---|---|---|
| IA_0358 | 5, 17, 23, 25, 40, and 45 | 0.1, 0.63, 1, 3.14, 6.3, 10, 31.45, 62.9, 100, 157.199 | 58 | ✔ | ✔ | ✔ | |
| WI_0357 | 5, 15.6, 19.6, 22, 23.6, 25, 31.2, 45 | 64 | ✔ | ✔ | ✔ | ||
| ME_0359 | 5, 17.9, 23.9, 25, 37.5, and 45 | ✔ | ✔ | ✔ | |||
| LA_0462 | 5, 25, 45, and 54 | ✔ | ✔ | ✔ | |||
| WA_0463 | 5, 15, 25, 38, and 45 | ✔ | ✔ | ✔ | |||
| KS_0464 | 5, 31, and 45 | ✔ | ✔ | ✔ | |||
| NY_0466 | 4.4, 5, 13, 21.1, 25, 37.8, 45, and 54.4 | ✔ | ✔ | ✔ | |||
| MA_0467 | 4.4, 5, 13, 15, 22, 25, 37.8, 45, and 54.4 | ✔ | ✔ | ✔ | |||
| NC_0360 | 5, 20.8, 25, and 45 | 70 | ✔ | ✔ | ✔ | ||
| MN_0465 | 5, 13, 25, 45, and 54.4 | ✔ | ✔ | ✔ | |||
| AZ_0356 | 5, 22, 25, and 45 | 76 | ✔ | ✔ | ✔ | ||
| CO_0777-BA | -10, 4.4, 21.1, 37.8, and 54.5 | 58 | ✔ | ||||
| CO_0777-BA+ADVERA | ✔ | ||||||
| CO_0777-BA+SASOBIT | 64 | ✔ | |||||
| OK_0673 | ✔ | ||||||
| SD_0674 | ✔ | ||||||
| MO_0672 | 70 | ✔ | |||||
| AL_0675 | 76 | ✔ | |||||
| NJ_0671 | ✔ | ||||||
| ME_0570 | 4.4, 21.1, 37.8, and 54.10 | 64 | ✔ | ||||
| NE_0569 | ✔ | ||||||
| KS_0568 | 70 | ✔ | |||||
| KS_0568 (2) | ✔ | ||||||
| °C = (°F−32)/1.8 |
|||||||
A portion of the current FHWA ALF binder data is available to the research team and is summarized in table 6. For these materials, DSR values are available at a wider range of frequencies than in the other databases. At the time this report was written, BBR results were not available; however, the possibility of obtaining such values along with data from other binders in the TPF-5(019) study is under investigation. Also, these binders have |G*| values measured under original-, RTFO-, and PAV-aged conditions. Viscosity values are not available for these materials.
| Binder Code | Temperature (°C) | Frequency (rad/s) | PG | Original | RTFO | PAV | BBR Available |
|---|---|---|---|---|---|---|---|
| Binder (AB)-B-6261 | 7, 19, 25, 31, 40, 46, 58, 64, 70, and 82 | 0.100, 0.126, 0.158, 0.200, 0.251, 0.316, 0.398, 0.501, 0.631, 0.794, 1.000, 1.259, 1.585, 1.995, 2.512, 3.162, 3.981, 5.012, 6.309, 7.942, 10.000, 12.589, 15.849, 19.952, 2.118, 31.622, 39.809, 50.115, 62.091, 79.426, and 100.000 | 52 | ✔ | |||
| SBS LG base-B-6275 | 58 | ✔ | |||||
| PG 70-22 1-B-6267 | 70 | ✔ | |||||
| PG 70-22 2-B-6272 | ✔ | ||||||
| PG 70-22 3-B-6298 | ✔ | ||||||
| SBS LG-B-6295 | ✔ | ||||||
| Terpoly-B-6289 | 76 | ✔ | |||||
| CRTB-B-6286 | ✔ | ||||||
| °C = (°F−32)/1.8 |
|||||||
The binders corresponding to NCDOT mixture data are available in the NCDOT binder database, which is summarized in table 7. Data for these binders, both |G*| and viscosity, are available only for the RTFO-aged condition.
| Binder Code | Temperature (°C) | Frequency (rad/s) | PG | Original | RTFO | PAV | BBR Available |
|---|---|---|---|---|---|---|---|
| AA-Inman | 16, 22, 28, and 40 | 0.06, 0.31, 0.63, 3.14, 6.28, 31.42, 62.83, and 94.25 | 64 | ✔ | |||
| El Paso-Apex | ✔ | ||||||
| El Paso-Charlotte | ✔ | ||||||
| Citgo-Wil-64 | ✔ | ||||||
| AA-Sali-70 | 70 | ✔ | |||||
| Citgo-Wil-70 | ✔ | ||||||
| AA-Sali-76 | 76 | ✔ | |||||
| °C = (°F−32)/1.8 |
|||||||
Table 8 summarizes the binders that are used in the Citgo database. This database contains original-, RTFO-, and PAV-aged |G*| and BBR results for two different binders used in NCHRP 9-25 and 9-31.(16,17) No viscosity measures are available for these binders.
| Binder Code | Temperature (°C) | Frequency (rad/s) |
PG | Original | RTFO | PAV | BBR Available |
|---|---|---|---|---|---|---|---|
| Citgo_A | 15, 25, 35, 45, 60, and 75 | 0.1, 0.159, 0.251, 0.398, 0.631, 1, 1.59, 2.51, 3.98, 6.31, 10, 15.9, 25.1, 39.8, 63.1, and 100 | 70 | ✔ | ✔ | ✔ | ✔ |
| Citgo_B | ✔ | ✔ | ✔ | ✔ | |||
| °C = (°F−32)/1.8 |
|||||||
The WRI binder database consists of two sets of binders from the Kansas and Nevada test sites. The four binders used at the Kansas site are from different crude sources, but all are PG 64-22. Additionally, the four binders used at the Nevada site are from different crude sources, each of which meets the AC-30 requirements of AASHTO M226-80, “Standard Specification for Viscosity Graded Asphalt Cement.”(18)
Table 9 summarizes the relevant information for the binders in this database. Viscosity values for these binders are not available.
| Binder Code | Temperature (°C) | Frequency (rad/s) | PG | Original | RTFO | PAV | BBR Available |
|---|---|---|---|---|---|---|---|
| KS-1-Sinclair Tulsa | 0.0, 10.0, 20.0, 30.0, 40.0, 50.0, 60.0, 70.0, and 80.0 | 0.10, 0.13, 0.16, 0.20, 0.25, 0.32, 0.40, 0.50, 0.63, 0.79, 1.0, 1.26, 1.58, 2.0, 2.51, 3.16, 3.9, 5.0, 6.3, 7.9, 10.0, 12.59, 15.6, 19.9, 25.11, 31.6, 39.8, 50.1, 63.1, 79.4, and 100.0 | 64 | ✔ | ✔ | ✔ | |
| KS-2-Coastal Eldorado | ✔ | ✔ | ✔ | ||||
| KS-3-Koch Muskogee | ✔ | ✔ | ✔ | ||||
| KS-4-Royal Trading | ✔ | ✔ | ✔ | ||||
| NV-1-Sinclair WY | 0.0, 10.0, 20.0, 30.0, 40.0, 50.0, 60.0, and 70.0 | AC-30 | ✔ | ✔ | ✔ | ||
| NV-2-Crown Nevada | ✔ | ✔ | ✔ | ||||
| NV-3-Crown Venezuela | ✔ | ✔ | ✔ | ||||
| NV-4-Crown Canadian | ✔ | ✔ | ✔ | ||||
| °C = (°F−32)/1.8 |
|||||||
°C = (°F−32)/1.8
Note: Blank cells indicate data are unavailable in the database.
The mixture databases for this project are similar in content to the binder databases; however, the temperatures and frequencies are different. These mixture databases contain the volumetric information listed in table 2. There are seven mixture datasets: (1) Witczak, (2) FHWA mobile trailer I, (3) FHWA mobile trailer II, (4) FHWA TPF-5(019), (5) NCDOT, (6) WRI, and (7) Citgo. The following sections describe the mixture databases.
Over the years, differences in TPs used to develop the database have led to limitations of the use of some mixtures in the Witczak database. The complete database contains 7,400 data points; however, the database used for this project has been limited to 3,180 data points for 106 mixtures. To avoid confusion, this limited database is referred to as the “processed Witczak database.” These mixtures are summarized in table 10 along with the spread of volumetric properties. Note that for all of the mixtures in this database, the true measured |G*| data are available (see table 4).
A primary difference between the FHWA mobile trailer database and the processed Witczak database is TP. The mobile trailer database is populated with |E*| data obtained from the procedure and equipment suggested for AMPTs, whereas the processed Witczak database is populated using data obtained from the AASHTO TP-62 protocol.(8) For modeling purposes, the mobile trailer mixture database is separated into two groups: FHWA I and FHWA II, which are summarized in table 11 and table 12, respectively. Note that a comparison of table 10 with table 11 and table 12 shows that the processed Witczak database covers an overall broader range of conditions than the mobile trailer mixture database. However, the latter database has smaller values of some parameters, particularly those related to the mixture gradation (i.e., ρ¾, ρ3/8, and ρ4). This indicates that smaller nominal maximum-sized aggregate (NMSA) mixtures are represented more strongly in the mobile trailer database than they are in the processed Witczak database.
The FHWA ALF study mixtures are available for the TP-62 test conditions. These mixtures consist of the same aggregate type and gradation, air void content, and asphalt content. The only differences between these mixtures are the asphalt type and a slight difference in the effective asphalt content. Table 13 presents a summary of the FHWA TPF-5(019) mixtures.(15)
| Binder Code | Number of Mix Variations | Total Number of Tests | Temperature (°C) | Frequency (Hz) | Aging Condition | ||
|---|---|---|---|---|---|---|---|
| Plant or Unaged | Short-Term Oven Aging (STOA) | Long-Term Oven Aging (LTOA) or Field | |||||
| MPA Citgo 70-22 |
4 | 4 | −17.8, 4.4, 21.1, 37.8, and 54.4 | 25, 10, 5, 1, 0.5, and 0.1 | 4 | ||
| MPA-Elvaloy | 4 | 4 | 4 | ||||
| MPA-Novophalt | 4 | 4 | 4 | ||||
| MPA-Stylink | 4 | 4 | 4 | ||||
| MPA-TA | 4 | 4 | 4 | ||||
| ALF AC-5 | 6 | 6 | −10, 4.4, 21.1, 37.8, and 54.4 | 4 | 2 | ||
| ALF AC-10 | 2 | 2 | 1 | 1 | |||
| ALF AC-20 | 6 | 6 | 4 | 2 | |||
| WesTrack | 34 | 34 | 22 | 12 | |||
| Chevron 64-22 | 17 | 17 | 17 | ||||
| Paramount 64-16 |
1 | 1 | 1 | ||||
| Navajo70-10 | 2 | 2 | 2 | ||||
| ALF-Novophalt | 2 | 2 | 1 | 1 | |||
| Chevron 76-16 | 2 | 2 | 2 | ||||
| ALF-Styrelf | 2 | 2 | 1 | 1 | |||
| MNRD120P | 8 | 8 | 6 | 2 | |||
| MNRDAC20 | 4 | 4 | 1 | 3 | |||
| ρ¾ | Maximum | 26.1 | |||||
| Minimum | 0 | ||||||
| ρ3/8 | Maximum | 41 | |||||
| Minimum | 15 | ||||||
| ρ4 | Maximum | 73 | |||||
| Minimum | 30 | ||||||
| ρ200 | Maximum | 6.6 | |||||
| Minimum | 2.6 | ||||||
| Va | Maximum | 12.5 | |||||
| Minimum | 0.7 | ||||||
| Vbeff | Maximum | 13.5 | |||||
| Minimum | 6.1 | ||||||
| VMA | Maximum | 22.2 | |||||
| Minimum | 11.2 | ||||||
| VFA | Maximum | 95.1 | |||||
| Minimum | 32.8 | ||||||
| °C = (°F−32)/1.8 |
|||||||
| Binder Code | Number of Mix Variations | Total Number of Tests | Temperature (°C) | Frequency (Hz) |
Aging Condition | ||
|---|---|---|---|---|---|---|---|
| Plant or Unaged | STOA | LTOA or Field | |||||
| WI_0357 | 9 | 36 | 15.6,19.6, 23.6, and 31.3 | 25, 10, 5, 1, 0.5, and 0.1 | 24 | 12 | |
| ME_0359 | 9 | 36 | 17.9, 23.9, and 37.5 | 24 | 12 | ||
| LA_0462 | 9 | 28 | 25, 45, and 54 | 15 | 13 | ||
| NY_0466 | 12 | 32 | 13, 25, and 45 | 20 | 12 | ||
| MA_0467 | 5 | 16 | 15, 25, and 45 | 16 | |||
| NC_0360 | 13 | 52 | 21, 25, and 45 | 40 | 12 | ||
| MN_0465 | 11 | 39 | 13, 25, and 45 | 27 | 12 | ||
| AZ_0356 | 9 | 26 | 22 and 44 | 14 | 12 | ||
| CO_0777 | 1 | 4 | 4.4, 21.1, 37.8, and 54.4 | 4 | |||
| CO_0777+ ADV | 1 | 4 | 4 | ||||
| CO_0777+ SAS | 1 | 4 | 4 | ||||
| OK_0673 | 13 | 34 | 22 | 12 | |||
| SD_06741 | 6 | 24 | 12 | 12 | |||
| MO_06722 | 6 | 24 | 24 | ||||
| AL_06753 | 24 | 96 | 72 | 24 | |||
| NJ_06711 | 6 | 24 | 12 | 12 | |||
| ME_0570 | 11 | 44 | 21.1, 37.8, and 54.4 | 32 | 12 | ||
| NE_0569 | 16 | 54 | 46 | 8 | |||
| KS_05681 | 6 | 30 | |||||
| KS_0568(2)1 | 4 | 20 | |||||
| ρ¾ | Maximum | 11.6 | |||||
| Minimum | 0 | ||||||
| ρ3/8 | Maximum | 45.1 | |||||
| Minimum | 2.3 | ||||||
| ρ4 | Maximum | 67.4 | |||||
| Minimum | 22.3 | ||||||
| ρ200 | Maximum | 6.6 | |||||
| Minimum | 2.7 | ||||||
| Va | Maximum | 8.7 | |||||
| Minimum | 4.5 | ||||||
| Vbeff | Maximum | 12.7 | |||||
| Minimum | 4.8 | ||||||
| VMA | Maximum | 20 | |||||
| Minimum | 9.5 | ||||||
| VFA | Maximum | 70.3 | |||||
| Minimum | 43 | ||||||
| °C = (°F-32)/1.8 1Vbeff is not given, 2inconsistent ID numbers for correlating volumetric and |E*| data, and 3measured |E*| under confining pressure. |
|||||||
| Binder Code | Number of Mix Variations | Total Number of Tests | Temperature (°C) | Frequency (Hz) | Aging Condition | ||||
|---|---|---|---|---|---|---|---|---|---|
| Plant or Unaged | STOA | LTOA or Field | |||||||
| IA_0358 | 7 | 28 | 17, 23, and 40 | 25, 10, 5, 1, 0.5,and 0.1 | 16 | 12 | |||
| WA_0463 | 6 | 24 | 15, 25, 38, and 45 | 12 | 12 | ||||
| KS_0464 | 8 | 32 | 25, 31, and 45 | 20 | 12 | ||||
| ρ¾ | Maximum | 2.1 | |||||||
| Minimum | 0 | ||||||||
| ρ3/8 | Maximum | 17 | |||||||
| Minimum | 14.7 | ||||||||
| ρ4 | Maximum | 45.9 | |||||||
| Minimum | 34.1 | ||||||||
| ρ200 | Maximum | 6.5 | |||||||
| Minimum | 3.8 | ||||||||
| Va | Maximum | 8.5 | |||||||
| Minimum | 5.7 | ||||||||
| Vbeff | Maximum | 11.5 | |||||||
| Minimum | 8.2 | ||||||||
| VMA | Maximum | 19.9 | |||||||
| Minimum | 15.1 | ||||||||
| VFA | Maximum | 65.5 | |||||||
| Minimum | 52.1 | ||||||||
|
°C = (°F−32)/1.8 |
|||||||||
| Binder Code | Number of Mix Variations | Total Number of Tests | Temperature (°C) | Frequency (Hz) | Aging Condition | ||||
|---|---|---|---|---|---|---|---|---|---|
| Plant or Unaged | STOA | LTOA or Field | |||||||
| PG 70-22 3-B-6298 | 1 | 3 | -10, 5, 20, 40, and 54 | 25, 10, 5, 1, 0.5, and 0.1 | 3 | ||||
| SBS LG-B-6295 | 1 | 3 | 3 | ||||||
| Terpoly-B-6289 | 1 | 3 | 3 | ||||||
| CRTB-B-6286 | 1 | 3 | 3 | ||||||
| ρ¾ | 0.0 | ||||||||
| ρ3/8 | 14.8 | ||||||||
| ρ4 | 44 | ||||||||
| ρ200 | 6.7 | ||||||||
| Va | 4 | ||||||||
| Vbeff | Maximum | 12.4 | |||||||
| Minimum | 12.3 | ||||||||
| VMA | Maximum | 16.4 | |||||||
| Minimum | 16.3 | ||||||||
| VFA | Maximum | 75.6 | |||||||
| Minimum | 75.5 | ||||||||
|
°C = (°F−32)/1.8 |
|||||||||
The NCDOT mixture database consists of 36 AC mixtures covering a range of materials. All of the mixtures were tested at NCSU. The test conditions for the mixtures in this database are most similar to the TP-62 protocol. The database is summarized in table 14.
| Binder Code | No. of Mix Variations | Total No. of Tests | Temperature (°C) | Frequency (Hz) | Aging Condition | ||||
|---|---|---|---|---|---|---|---|---|---|
| Plant or Unaged | STOA | LTOA or Field | |||||||
| El Paso-Charlotte-64 | 2 | 2 | −10, 10, 35, and 54 | 25, 10, 5, 1, 0.5, 0.1, 0.05, and 0.01 | 2 | ||||
| Citgo-Wil-64 | 24 | 24 | 24 | ||||||
| AA-Sali-70 | 1 | 1 | 1 | ||||||
| Citgo-Wil-70 | 8 | 8 | 8 | ||||||
| AA-Sali-76 | 1 | 1 | 1 | ||||||
| ρ¾ | Maximum | 31 | |||||||
| Minimum | 0 | ||||||||
| ρ3/8 | Maximum | 55 | |||||||
| Minimum | 1 | ||||||||
| ρ4 | Maximum | 67 | |||||||
| Minimum | 14 | ||||||||
| ρ200 | Maximum | 6.6 | |||||||
| Minimum | 3 | ||||||||
| Va | Maximum | 4.9 | |||||||
| Minimum | 3 | ||||||||
| Vbeff | maximum | 14.2 | |||||||
| Minimum | 7.3 | ||||||||
| VMA | Maximum | 18.4 | |||||||
| Minimum | 10.8 | ||||||||
| VFA | Maximum | 79.1 | |||||||
| Minimum | 67.7 | ||||||||
|
°C = (°F−32)/1.8 |
|||||||||
The results of laboratory testing and analysis of plant-produced AC mixtures from two sets of four test sections constructed for the WRI on US-77 in Kansas and on I-15 in Clark County, NV, are documented in this database. In each of these two sites, the four test sections were constructed using the same asphalt mixture and four binders from different crude sources. The laboratory testing was conducted on plant-produced samples that were compacted to a target air void of 7 percent using a gyratory compactor. The tests were conducted for the as-received plant-aged condition and after LTOA in accordance with AASHTO R30-02, “Standard Specification for Mixture Conditioning of Hot Mix Asphalt (HMA).”(19) A summary of the relevant information in this database is shown in table 15.
| Binder Code | No. of Mix Variations | Total No. of Tests | Temperature (°C) | Frequency Hz) | Aging Condition | ||||
|---|---|---|---|---|---|---|---|---|---|
| Plant or Unaged | STOA | LTOA or Field | |||||||
| KS-1-Sinclair Tulsa | 4 | 4 | 4.4, 21.1, and 40 | 10, 1, 0.1, and 0.01 | 2 | 2 | |||
| KS-2-Coastal Eldorado | 4 | 4 | 2 | 2 | |||||
| KS-3-Koch Muskogee | 4 | 4 | 2 | 2 | |||||
| KS-4-Royal Trading | 4 | 4 | 2 | 2 | |||||
| NV-1-Sinclair WY | 2 | 2 | 4, 20, and 40 | 10, 5, 1, 0.5, 0.1, 0.05, and 0.01 | 1 | 1 | |||
| NV-2-Crown Nevada | 2 | 2 | 1 | 1 | |||||
| NV-3-Crown Venezuela | 2 | 2 | 1 | 1 | |||||
| NV-4-Crown Canadian | 2 | 2 | 1 | 1 | |||||
| ρ¾ | Maximum | 9 | |||||||
| Minimum | 1 | ||||||||
| ρ3/8 | Maximum | 40 | |||||||
| Minimum | 14 | ||||||||
| ρ4 | Maximum | 50 | |||||||
| Minimum | 32 | ||||||||
| ρ200 | Maximum | 6.6 | |||||||
| Minimum | 4.2 | ||||||||
| Va | Maximum | 7.4 | |||||||
| Minimum | 6.6 | ||||||||
| Vbeff | Maximum | 9.8 | |||||||
| Minimum | 6.4 | ||||||||
| VMA | Maximum | 17.2 | |||||||
| Minimum | 13.4 | ||||||||
| VFA | Maximum | 57.4 | |||||||
| Minimum | 47.1 | ||||||||
|
°C = (°F−32)/1.8 |
|||||||||
The Citgo database consists of two mixtures fabricated with the same aggregate structure
(0.4-inch (9.5-mm) Superpave™ mixture) but with different asphalt binders. Both STOA and LTOA were conducted on these mixtures. A summary of the mixture properties is presented in table 16. These two mixtures are included in NCHRP projects 9-25 and 9-31.(16,17) For this database, the modulus values were measured in accordance with the AASHTO TP-62 protocol, and the aging was conducted in accordance with AASHTO R30-02.(8,19)
| Binder Code | No. of Mix Variations | Total No. of Tests | Temperature (°C) | Frequency (Hz) | Aging Condition | ||
|---|---|---|---|---|---|---|---|
| Plant or Unaged | STOA | LTOA or Field | |||||
| Citgo-A | 2 | 4 | 4, 20, and 40 | 10, 5, 1, 0.5, 0.1, 0.05, and 0.01 | 2 | 2 | |
| Citgo-B | 2 | 4 | 2 | 2 | |||
| ρ¾ | 0 | ||||||
| ρ3/8 | 6 | ||||||
| ρ4 | 50 | ||||||
| ρ200 | 5.1 | ||||||
| Va | 4.3 | ||||||
| Vbeff | 11.5 | ||||||
| VMA | 15.8 | ||||||
| VFA | 72.6 | ||||||
|
°C = (°F−32)/1.8 |
|||||||
Under the FHWA DTFH61-05-RA-00108 project, NCSU researchers tested a set of mixtures for both |E*| and M–R–.(14) The importance of this database is that it can be used to verify the predictive capabilities of the MR ANN model. In total, seven different mixtures are included with two different asphalt binder types. The asphalt binders used for these mixtures are not part of the binder database. Because these mixtures are only used for the MR ANN verification, the relevant information is different (see table 17). The designation for these mixes follows the NCDOT convention where the first letter represents either a surface mix (S) or a base mix (B). The second number represents the NMSA, and the final letter represents the gradation of fine (F), coarse (C), or flat and elongated (FE). The “M” on the last mix denotes that the binder was modified. Two of the study mixtures are derivations of the S12.5C mix in that only the asphalt content was changed by either ± percent.
| Mix | Percent Va | Percent AC | Asphalt Grade |
|---|---|---|---|
| S12.5C | 4 | 5.5 | PG 64-22 |
| S12.5C-AC+1 | 4 | 6.5 | |
| S12.5C-AC-1 | 4 | 4.5 | |
| S12.5FE | 4 | 5.7 | |
| S12.5F | 4 | 4.8 | |
| B25.0C | 4 | 4.9 | |
| S12.5CM | 4 | 5.5 | PG 76-22 |
Mixture and binder properties of AC layers on LTPP test sections at different aging conditions (i.e., original-, TFO/RTFO-, PAV-aged, and field-aged) were extracted from the LTPP database for use as inputs for the models developed as part of this study. The following list provides the criteria for selecting the layers to be considered in dynamic modulus estimates:(20)
Many properties of interest for this project are available in multiple locations within the LTPP database. Because of this, the team established a hierarchy of data sources to extract information from the LTPP database. The following lists provide the priority used in extracting data (lower numbers denote higher priority) for each of the aging conditions. Included are the LTPP module and the specific table name for each data source.
Binder shear modulus and phase angle are as follows:(20)
Viscosity ring/ball, penetration, absolute viscosity, and kinematic viscosity are as follows:(20)
Volumetrics-VMA, VFA, Va, theoretical maximum specific gravity (Gmb), and bulk specific gravity (Gmm) are as follows:(20)
Table 18 provides the location within the LTPP database where the information was extracted and a summary of the data utilized in this project.
| Field Name | Description |
|---|---|
| STATE_CODE | Code representing State or province |
| PROJECT_ID | SHRP_ID for GPS sections and PROJECT_ID for SPS sections |
| PROJECT_LAYER | Project layer code as established in TST_LO5B for SPS sections; layer code as established in TST_LO5B for GPS sections(20) |
| CONSTRUCTION_DATE | Date layer was constructed |
| SAMPLE_TYPE | 1–original binder, 2–lab-aged (TFO/RTFO), 3–lab-aged (PAV), and 4–field-aged |
| GSTAR_SAMPLE_DATE | Date of |G*| sampling (if field-aged sample) |
| GSTAR_1 | Binder complex modulus at temperature 1 |
| PHASE_ANGLE_1 | Phase angle at temperature 1 |
| GSTAR_TEMP_1 | Binder complex modulus at temperature 1 |
| GSTAR_2 | Binder complex modulus at temperature 2 |
| PHASE_ANGLE_2 | Phase angle at temperature 2 |
| GSTAR_TEMP_2 | Binder complex modulus at temperature 2 |
| GSTAR_3 | Binder complex modulus at temperature 3 |
| PHASE_ANGLE_3 | Phase angle at temperature 3 |
| GSTAR_TEMP_3 | Binder complex modulus at temperature 3 |
| GSTAR_4 | Binder complex modulus at temperature 4 |
| PHASE_ANGLE_4 | Phase angle at temperature 4 |
| GSTAR_TEMP_4 | Binder complex modulus at temperature 4 |
| GSTAR_5 | Binder complex modulus at temperature 5 |
| PHASE_ANGLE_5 | Phase angle at temperature 5 |
| GSTAR_TEMP_5 | Binder complex modulus at temperature 5 |
| GSTAR_6 | Binder complex modulus at temperature 6 |
| PHASE_ANGLE_6 | Phase angle at temperature 6 |
| GSTAR_TEMP_6 | Binder complex modulus at temperature 6 |
| GSTAR_SOURCE | LTPP module from which binder complex modulus was extracted (i.e., TST = testing, RHB = rehabilitation, SPS = SPS construction, INV = inventory, and CALC = calculated) |
| BINDER_SAMPLE_DATE | Date of binder sampling (if field-aged sample) |
| RING_BALL | Ring/ball (°F) results |
| RING_BALL_SOURCE | LTPP module from which ring and ball was extracted (i.e., TST = testing, RHB = rehabilitation, SPS = SPS construction, INV = inventory, and CALC = calculated) |
| PENETRATION_39.2F | Penetration at 39.2 °F |
| PENETRATION_39.2F_SOURCE | LTPP module from which penetration at 39.2 °F was extracted (i.e., TST = testing, RHB = rehabilitation, SPS = SPS construction, INV = inventory, and CALC = calculated) |
| PENETRATION_77F | Penetration at 77 °F |
| PENETRATION_77F_SOURCE | LTPP module from which penetration at 77 °F was extracted (i.e., TST = testing, RHB = rehabilitation, SPS = SPS construction, INV = inventory, and CALC = calculated) |
| PENETRATION_115F | Penetration at 115 °F |
| PENETRATION_115F _SOURCE | LTPP module from which penetration at 115 °F was extracted (i.e., TST = testing, RHB = rehabilitation, SPS = SPS construction, INV = inventory, and CALC = calculated) |
| ABSOLUTE_VISCOSITY | Absolute viscosity at 140 °F (poises) |
| ABSOLUTE_VISCOSITY_SOURCE | LTPP module from which absolute viscosity was extracted (i.e., TST = testing, RHB = rehabilitation, SPS = SPS construction, INV = inventory, and CALC = calculated) |
| KINEMATIC_VISCOSITY | Kinematic viscosity at 275 °F (centistokes) |
| KINEMATIC_VISCOSITY_SOURCE | LTPP module from which kinematic viscosity was extracted (i.e., TST = testing, RHB = rehabilitation, SPS = SPS construction, INV = inventory, and CALC = calculated) |
| VMA | Voids in mineral aggregate |
| VMA_SOURCE | LTPP module from which VMA was extracted (i.e., TST = testing, RHB = rehabilitation, SPS = SPS construction, INV = inventory, and CALC = calculated) |
| VFA | Voids filled with asphalt |
| VFA_SOURCE | LTPP module from which VFA was extracted (i.e., TST = testing, RHB = rehabilitation, SPS = SPS construction, INV = inventory, and CALC = calculated) |
| AIR_VOID SAMPLE_DATE | Date of air void sampling (if field-aged sample) |
| AIR_VOIDS | Percent air voids |
| AIR_VOIDS_SOURCE | LTPP module from which air voids was extracted (i.e., TST = testing, RHB = rehabilitation, SPS = SPS construction, INV = inventory, and CALC = calculated) |
| GMB | Bulk specific gravity of the mix |
| GMB_SOURCE | LTPP module from which bulk specific gravity was extracted ((i.e., TST = testing, RHB = rehabilitation, SPS = SPS construction, INV = inventory, and CALC = calculated) |
| GMM | Maximum specific gravity |
| GMM_SOURCE | LTPP module from which maximum specific gravity was extracted (i.e., TST = testing, RHB = rehabilitation, SPS = SPS construction, INV = inventory, and CALC = calculated) |
| MR_SAMPLE_DATE | Date of resilient modulus sampling (if field-aged sample) |
| MR_5 | Resilient modulus at 5 °C |
| MR_25 | Resilient modulus at 25 °C |
| MR_40 | Resilient modulus at 40 °C |
| MR_SOURCE | LTPP module from which resilient modulus was extracted (i.e., TST = testing, RHB = rehabilitation, SPS = SPS construction, INV = inventory, and CALC = calculated) |
| BINDER_GRADE | Binder grade information (only populated for RTFO data) |
|
°C = (°F−32)/1.8 |
|
For GPS projects, each layer is specific to one test section. As such, the data utilized from the LTPP database are section-specific. However, for SPS projects, the same materials were used in the construction of many test sections on one SPS project. Inputs for these SPS projects were computed as the average of the layer over the entire SPS project. Therefore, |E*| estimates were developed for each PROJECT_LAYER_CODE (as reported in the TST_LO5B table) and reported as project-level data.(20) For SPS projects that were linked to GPS test sections, priority was given to data from the SPS project. If those data were not available, the SPS records were populated with data from the corresponding GPS test section.
In some cases, the AC layers were sampled and tested multiple times and at varying ages. If test results were available from multiple sample dates, |E*| was computed for each sample date. The corresponding age was calculated and included with the data.
Va for field-aged samples are not directly available in the LTPP database; therefore, the following equation was used to calculate air voids from bulk- and maximum-specific gravities measured from field samples:
 |
(14) |
Where:
| Va | = | Air voids (percent). |
|---|---|---|
| Gmb | = | Bulk specific gravity. |
| Gmm | = | Maximum specific gravity. |
In addition, because VFA information is not available directly in the LTPP database, the following equation was used to compute VFA:
| (15) |

