U.S. Department of Transportation
Federal Highway Administration
1200 New Jersey Avenue, SE
Washington, DC 20590
202-366-4000
Federal Highway Administration Research and Technology
Coordinating, Developing, and Delivering Highway Transportation Innovations
| REPORT |
| This report is an archived publication and may contain dated technical, contact, and link information |
|
| Publication Number: FHWA-HRT-10-066 Date: October 2011 |
Publication Number: FHWA-HRT-10-066 Date: October 2011 |
This chapter describes the rehabilitation of rigid pavements. Data from the SPS-6 sites were used to assess the impact of rehabilitation effort with and without HMA overlay on performance and response of JPCP and JRCP. The impact of design features (i.e., different rehabilitation procedures and the presence or absence of an HMA overlay) on performance and response was statistically evaluated for major distresses commonly recorded in the LTPP database for rigid pavements and reported in the MEPDG.
The core sections of the SPS-6 experiment consisted of independent rehabilitation strategies. The experiment did not evenly combine all restoration and overlay options. Additionally, it was unbalanced for statistical purposes. As a result, ANOVA of individual sites was not possible. Therefore, the statistical analysis of SPS-6 was performed by simultaneously considering all of the sites in the experiment using the Friedman test.
The Friedman test is a nonparametric test (distribution-free) used to compare repeated observations on the same subjects. Unlike the more common parametric repeated measures ANOVA or paired t-test, the Friedman test makes no assumptions about the distribution of the data (e.g., normality). In addition, it can be used for multiple comparisons, as is the case of the SPS-6 experiment which had multiple rehabilitation alternatives. The Friedman test uses the ranks of the data rather than their raw values to calculate the statistic. The test statistic for the Friedman test is a chi-square with n - 1 degrees of freedom, where n is the number of repeated measures (i.e., the number of sections in each site of the experiment). Statistical significance was defined at 95 percent (p ≤ 0.05 for the chi-square test).
The Friedman test also permits the evaluation of paired statistical significance between two rehabilitation strategies. In some instances, the result of one analysis may indicate that significant differences exist between the rankings of sections (i.e., the performances of these sections are statistically different). However, there might be groups within the sorted ranking with similar performances. The paired statistical analysis feature is important to identify groups of strategies with equivalent performance.
The WD average (i.e., the unit area under the distress performance curve) over the survey period was selected as a performance measure of various distresses and roughness. It was calculated as described in the previous chapter.
Different distresses were used to evaluate the performance of rehabilitated rigid pavements. The decision was based on the importance and frequency of occurrence, but most notably, it was based on distresses that were visible during the surveys (i.e., present in the surface layer). The SPS-6 experiment consisted of rigid pavement sections that had been rehabilitated with or without HMA overlay. The core sections of the experiment are described in table 61. Sections that were rehabilitated through an HMA overlay were monitored after rehabilitation, and typical flexible pavement distresses (e.g., rutting, fatigue cracking, transverse cracking, etc.) were recorded throughout the service life of the experiment. Sections that were rehabilitated and did not receive an HMA overlay were monitored, and typical rigid pavement distress surveys (e.g., faulting, slab cracking, etc.) were recorded.
This particular characteristic of SPS-6 sites required multiple analyses in which individual sections were grouped based on their surface layer type and, consequently, their monitoring distresses. Roughness was measured in all sections, and it was chosen as the performance measure associated with all sections independent of their surface type as an indication of functional performance of the rehabilitation strategies. Different cracking performance measurements were taken according to the surface layer type. The sum of all cracking area was also an important performance measure used to evaluate all sections simultaneously, especially for decisionmaking on crack preventive maintenance. Therefore, roughness and total cracking were used to simultaneously compare the performance of all rehabilitation strategies.
Table 61. Core sections of the SPS-6 experiment.
SHRP ID |
Overlay Thickness (mm) |
PCC Preparation |
Code |
|---|---|---|---|
0601 |
- |
Routine maintenance (control) |
- |
0602 |
- |
Minimum restoration |
min-no |
0603 |
102 |
Minimum restoration |
min-ov |
0604 |
102 |
Saw and seal AC over joints |
ss-ov |
0605 |
- |
Maximum restoration |
max-no |
0606 |
102 |
Maximum restoration |
max-ov |
0607 |
102 |
Crack/break and seat |
cb-4 inches |
0608 |
203 |
Crack/break and seat |
cb-8 inches |
1 inch = 25.4 mm
- Indicates that the section did not have an overlay and/or code.
There were four sections in each SPS-6 site with distinct restoration treatments executed prior to or just after the 4-inch (102-mm) overlays. The restoration treatments were minimum and maximum restoration, saw and seal over joints, and crack/break and seat. The impact of these treatments on performance was analyzed by grouping these sections into a new dataset, excluding all others. Roughness and typical flexible pavement distresses were used as performance measures. Sections with different restoration treatments but without overlays were used to evaluate the performance of these treatments when they were the main component of the rehabilitation strategy. The no treatment control section was also analyzed in this group dataset, and roughness and distresses typical of rigid pavement were used as performance measures. Table 62 summarizes all datasets and provides the purpose of the study and the distresses and responses used in each analysis.
The analysis of the SPS-6 sites was intended to assess the impact of rehabilitation strategies on performance and response as well as the influence of climate and pavement surface conditions prior to rehabilitation. Therefore, each dataset defined in table 62 was analyzed in four ways: (1) all sites in the study, (2) sites grouped by wet/dry condition, (3) sites grouped by freeze/no-freeze condition, and (4) sites grouped by fair/poor condition prior to rehabilitation. By comparing results from different conditions, it was possible to investigate the influence of climate conditions and pavement deterioration prior to rehabilitation on performance. Separate analyses were conducted for JPCP and JRCP.
In addition to performance measures, mechanistic responses were analyzed. Sections with HMA overlays were evaluated using maximum deflection measured at the center of the lane, while sections without overlays were analyzed using the load transfer efficiency between joints and the maximum deflection at the center of the slab.
Table 62. Description of independent studies and performance measures used in the analyses.
Study Type/Dataset |
Purpose |
Distress |
|---|---|---|
All rehabilitation strategies and all sections |
To compare performance of all rehabilitation options |
Roughness |
Total cracking |
||
PCC restoration prior to overlay: sections 0603, 0604, 0606, and 0607 |
To evaluate the impact of different preoverlay treatments on performance |
Roughness |
Rutting |
||
Fatigue cracking |
||
Longitudinal cracking |
||
Transverse cracking |
||
Maximum deflection |
||
PCC restoration: sections 0601, 0602, and 0605 |
To evaluate the impact on performance of PCC restoration without HMA overlay |
Roughness |
PCC faulting |
||
Slab corner breaks |
||
Durability |
||
Longitudinal slab cracking |
||
Transverse slab cracking |
||
Load transfer efficiency (LTE) |
||
Maximum deflection |
There were 14 sites in the SPS-6 experiment. Eight of them were JPCP, and six were JRCP. The sites and their characteristics in the experimental factorial are presented in table 63. Their behavior was different, and the level of distresses typically varied. The analysis of the impact of different rehabilitation strategies on performance was performed separately for JPCP and JRCP sites.
Table 63. SPS-6 sites for the experimental factorial.
Pavement Type |
Pavement Condition |
Climate, Moisture/Temperature |
|||
|---|---|---|---|---|---|
Wet Freeze |
Wet |
Dry Freeze |
Dry |
||
JPCP |
Fair |
Missouri (29) |
Alabama (1) and Tennessee (47) |
South Dakota (46) |
|
Poor |
Indiana (18) |
Arakansas (5) |
Arizona (4) and California (6) |
||
JRCP |
Fair |
Iowa (19), Michigan (26), and Pennsylvania (42) |
Oklahoma (40) |
||
Poor |
Illinois (17) and Missouri (29) |
||||
Note: State codes are provided in parentheses. Blank cells indicate that there are no sites with those sets of conditions.
This section describes the results of the study on JPCP sites in the SPS-6 experiment. JPCP sites were located throughout the United States and had a balanced distribution between climate and pavement condition. Only the dry, no-freeze climatic zone did not have a representative site. Four out of eight sites were reported to have fair pavement conditions prior to rehabilitation. Five sites were located in wet regions, and five were located in freeze regions. Traffic was similar in all sites in terms of daily truck volume and class distributions.
Analysis of All Rehabilitation Strategies
Roughness and total cracking were used to evaluate all rehabilitation alternatives simultaneously. Roughness was the only performance indicator measured in all sections within each site. The surveys were independent from surface type and were performed systematically during the experiment. The surveys provided a uniform way of comparing the impact of all of the rehabilitation strategies used in the experiment. In addition to roughness, total cracking was used as an indicator of performance. In this case, the measurements were not obtained directly. Cracking was measured depending on the surface layer type after the rehabilitation strategy was completed.
After the data were processed and verified for quality and existing outliers were removed, WD was computed for short-term and long-term performance (see table 64 and table 65). The Friedman test used the calculated WD to create a ranking of performance, from lowest WD (best performance) to highest (worst performance) for each site in the dataset. Descriptive statistics of the ranking (i.e., average, standard deviation, sum of rankings, etc.) for each type of section were used to calculate the chi-square value to determine if statistical differences existed among the performance rankings.
Table 64. Short-term average WD-IRI values for SPS-6 sites with JPCP.
Section |
Experiment Design |
Sites (State Codes)/Average IRI WD Values (m/km) |
||||||||
|---|---|---|---|---|---|---|---|---|---|---|
Restoration |
Overlay (mm) |
1 |
4 |
5 |
6 |
18 |
29 |
46 |
47 |
|
0601 |
No |
no |
1.57 |
1.64 |
2.02 |
1.83 |
1.50 |
0.40 |
1.49 |
|
0602 |
Minimum |
no |
0.69 |
2.43 |
2.01 |
1.89 |
1.02 |
0.69 |
0.47 |
0.86 |
0603 |
Minimum |
102 |
0.74 |
1.29 |
0.48 |
0.96 |
0.68 |
0.67 |
0.89 |
0.43 |
0604 |
Saw and seal |
102 |
0.64 |
0.99 |
0.50 |
0.91 |
0.75 |
0.78 |
0.83 |
0.79 |
0605 |
Maximum |
no |
0.69 |
1.51 |
0.97 |
1.95 |
1.18 |
0.73 |
0.41 |
0.89 |
0606 |
Maximum |
102 |
0.85 |
1.04 |
0.54 |
1.02 |
0.72 |
0.60 |
0.71 |
0.45 |
0607 |
Crack/break and seat |
102 |
1.07 |
1.56 |
0.55 |
0.86 |
0.78 |
0.72 |
0.90 |
0.90 |
0608 |
Crack/break and seat |
203 |
0.47 |
0.93 |
0.45 |
0.83 |
0.54 |
0.46 |
0.66 |
0.40 |
1 ft = 0.305 m
1 mi = 1.61 km
1 inch = 25.4 mm
Note: Higher WD values indicate rougher pavement over time. The blank cell
indicates data are not available.
Table 65. Long-term average WD-IRI values for SPS-6 sites with JPCP.
Section |
Experiment Design |
Sites (State Codes)/Average IRI WD Values (m/km) |
||||||||
|---|---|---|---|---|---|---|---|---|---|---|
Restoration |
Overlay (mm) |
1 |
4 |
5 |
6 |
18 |
29 |
46 |
47 |
|
0601 |
No |
no |
3.09 |
2.48 |
3.15 |
2.72 |
3.15 |
3.03 |
1.86 |
|
0602 |
Minimum |
no |
1.30 |
3.65 |
2.18 |
2.24 |
2.21 |
1.31 |
1.56 |
1.19 |
0603 |
Minimum |
102 |
1.32 |
1.74 |
0.94 |
1.39 |
1.07 |
1.26 |
1.36 |
0.78 |
0604 |
Saw and seal |
102 |
1.23 |
1.20 |
0.97 |
1.55 |
1.19 |
1.41 |
1.50 |
0.98 |
0605 |
Maximum |
no |
1.25 |
1.81 |
1.38 |
1.90 |
2.14 |
1.28 |
1.28 |
1.19 |
0606 |
Maximum |
102 |
1.48 |
1.37 |
1.01 |
1.84 |
1.13 |
1.13 |
1.25 |
0.80 |
0607 |
Crack/break and seat |
102 |
2.43 |
1.43 |
1.07 |
1.58 |
1.09 |
1.46 |
1.38 |
1.19 |
0608 |
Crack/break and seat |
203 |
0.93 |
1.14 |
0.90 |
1.09 |
1.00 |
0.95 |
1.11 |
0.78 |
1 ft = 0.305 m
1 mi = 1.61 km
1 inch = 25.4 mm
Note: The blank cell indicates data are not available.
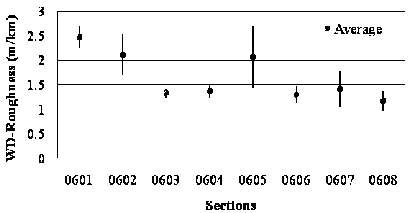
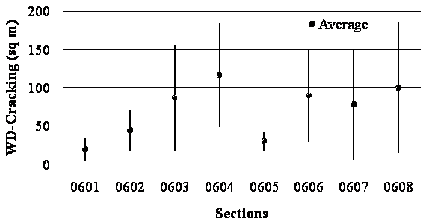
The Friedman null hypothesis stated that there was no difference between the section rankings (i.e., all sections had identical performances). The null hypothesis was rejected if the p-value was lower than 0.05, which represents a 95 percent confidence that at least two sections have statistically different rankings. Examples of Friedman test outputs are provided in figure 40 and figure 41. In the figures, the average WD value for IRI found for each rehabilitation strategy among all sites was analyzed. The vertical bars represent the interval between the mean value ±1 standard deviation as an illustration of the variability of the measurements. The results indicate that for short-term roughness performance, there were at least two sections with statistically different performances (see figure 40, p = 0.0004, ANOVA chi-square = 26.5938). A similar result was found for long-term performance in figure 41 (p < 0.0001, ANOVA chi-square = 40.2188).
When the result from the Friedman test indicated the existence of at least two strategies with statistically different rankings, the next steps were to identify those sections and build the rankings of best-performing strategies based on the statistical analysis. The paired analyses from the Friedman test were used for this purpose. The significance (p-value) of these paired analyses indicated the presence or absense of statistical differences between their rankings. Table 66 and table 67 provide the statistical p-values for each paired analysis for short-term and long-term roughness rankings.
The paired analysis results were used to create a practical ranking of roughness performance based on the statistical significance. Based on results presented in table 66 and table 67, the final ranking of evaluating roughness performance was created for the short term and the long term and are described in table 68 and table 69, respectively. Sections were ordered from best to worst performance, and sections with equivalent performance were grouped under the same rank.

1 ft = 0.305 m
1 mi = 1.61 km
Figure 40. Graph. WD-IRI short-term values for JPCP in SPS-6 sections.

1 ft = 0.305 m
1 mi = 1.61 km
Figure 41. Graph. WD-IRI long-term values for JPCP in SPS-6 sections.
Table 66. Friedman test paired analysis of rehabilitation strategies by IRI short-term performance ranking for SPS-6 sites with JPCP.
Paired Analysis |
p-Value |
|---|---|
0601 and 0602 |
- |
0601 and 0603 |
- |
0601 and 0604 |
- |
0601 and 0605 |
- |
0601 and 0606 |
- |
0601 and 0607 |
- |
0601 and 0608 |
< 0.05 |
0602 and 0603 |
- |
0602 and 0604 |
- |
0602 and 0605 |
- |
0602 and 0606 |
- |
0602 and 0607 |
- |
0602 and 0608 |
< 0.05 |
0603 and 0604 |
- |
0603 and 0605 |
- |
0603 and 0606 |
- |
0603 and 0607 |
- |
0603 and 0608 |
- |
0604 and 0605 |
- |
0604 and 0606 |
- |
0604 and 0607 |
- |
0604 and 0608 |
- |
0605 and 0606 |
- |
0605 and 0607 |
- |
0605 and 0608 |
< 0.05 |
0606 and 0607 |
- |
0606 and 0608 |
- |
0607 and 0608 |
< 0.05 |
- Indicates a pair analysis with
no
statistical significance.
Table 67. Friedman test paired analysis of rehabilitation strategies by IRI long-term performance ranking for SPS-6 sites with JPCP.
Paired Analysis |
p-Value |
|---|---|
0601 and 0602 |
- |
0601 and 0603 |
< 0.05 |
0601 and 0604 |
< 0.05 |
0601 and 0605 |
- |
0601 and 0606 |
< 0.05 |
0601 and 0607 |
- |
0601 and 0608 |
< 0.05 |
0602 and 0603 |
- |
0602 and 0604 |
- |
0602 and 0605 |
- |
0602 and 0606 |
- |
0602 and 0607 |
- |
0602 and 0608 |
< 0.05 |
0603 and 0604 |
- |
0603 and 0605 |
- |
0603 and 0606 |
- |
0603 and 0607 |
- |
0603 and 0608 |
- |
0604 and 0605 |
- |
0604 and 0606 |
- |
0604 and 0607 |
- |
0604 and 0608 |
- |
0605 and 0606 |
- |
0605 and 0607 |
- |
0605 and 0608 |
< 0.05 |
0606 and 0607 |
- |
0606 and 0608 |
- |
0607 and 0608 |
< 0.05 |
- Indicates a pair analysis with no statistical significance.
Table 68. Ranking of rehabilitation strategies for short-term roughness performance of SPS-6 sites with JPCP.
Section |
Ranking |
Restoration |
Overlay (mm) |
|---|---|---|---|
0608 |
1 |
Crack/break and seat |
203 |
0603 |
2 |
Minimum |
102 |
0604 |
2 |
Saw and seal |
102 |
0606 |
2 |
Maximum |
102 |
0602 |
5 |
Minimum |
No |
0605 |
5 |
Maximum |
No |
0607 |
5 |
Crack/break and seat |
102 |
0601 |
5 |
Control |
No |
69. Ranking of rehabilitation strategies for long-term roughness performance of SPS-6 sites with JPCP.
Section |
Ranking |
Restoration |
Overlay (mm) |
|---|---|---|---|
0608 |
1 |
Crack/break and seat |
203 |
0603 |
2 |
Minimum |
102 |
0606 |
2 |
Maximum |
102 |
0604 |
2 |
Saw and seal |
102 |
0605 |
5 |
Maximum |
No |
0607 |
5 |
Crack/break and seat |
102 |
0602 |
5 |
Minimum |
No |
0601 |
8 |
Control |
No |
1 inch = 25.4 mm
Results from table 68 and table 69 suggest that the rehabilitation alternative for section 0608 (crack/break and seat with an 8-inch (203-mm) overlay) was the best performing treatment for roughness in both the short term and long term. The statistical analysis also suggests that there was practically no difference in performance between sections overlaid with 4-inch (102-mm) HMA regardless of the restoration treatment performed prior to the overlay, except the alternative crack/break and seat with a 4-inch (102-mm) overlay, which was the poorer alternative with overlays. Roughness performance for this rehabilitation alternative was equivalent to not having an overlay after restoration.
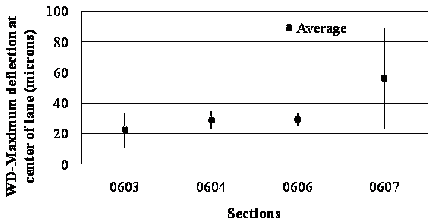
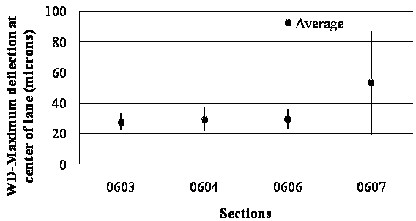
The same approach described for the analysis of roughness was applied to total cracking, which was computed as the sum of fatigue, longitudinal, and transverse cracking measured in sections overlaid with HMA and the sum of transverse and longitudinal slab cracking measured in sections without HMA overlays. Figure 42 (p < 0.0001, ANOVA chi-square = 38.4896) and figure 43 (p < 0.0001, ANOVA chi-square = 31.7919) describe the Friedman ANOVA test for this type of distress. Based on the same test statistics, the ranking of best performing rehabilitation strategies for total cracking was created.
1 ft = 0.305 m
Figure 42. Graph. Average short-term WD-cracking for JPCP at SPS-6 sites.
1 ft = 0.305 m
Figure 43. Graph. Average long-term WD-cracking for JPCP at SPS-6 sites.
Table 70 Â show a compilation of the rankings for roughness and total cracking performances for short-term performance, and table 71 presents the results for long-term performance.
Table 70. Summary of rankings for short-term performance of JPCP structures at SPS-6 sites.
Statistical Relevance (Y/N) |
Distress |
|||||
|---|---|---|---|---|---|---|
Roughness |
Total Cracking |
|||||
Y |
p = 0.0004 |
Y |
p = 0.0004 |
|||
Ranking |
Ranking |
Strategy |
Overlay (mm) |
Ranking |
Strategy |
Overlay (mm) |
1 |
Crack/break and seat |
203 |
1 |
Minimum |
None |
|
2 |
Minimum |
102 |
2 |
Maximum |
None |
|
2 |
Saw and seal |
102 |
2 |
None |
None |
|
2 |
Maximum |
102 |
4 |
Crack/break and seat |
102 |
|
5 |
Minimum |
None |
5 |
Minimum |
102 |
|
5 |
Maximum |
None |
5 |
Crack/break and seat |
203 |
|
5 |
Crack/break and seat |
102 |
5 |
Maximum |
102 |
|
5 |
Control |
8 |
Saw and seal |
102 |
||
1 inch = 25.4 mm
Note: The blank cell indicates that there was no overlay for the control.
Table 71. Summary of rankings for long-term performance of JPCP structures at SPS-6 sites.
Statistical Relevance (Y/N) |
Distress |
|||||
|---|---|---|---|---|---|---|
Roughness |
Total Cracking |
|||||
Y |
p < 0.0001 |
Y |
p < 0.0001 |
|||
Ranking |
Ranking |
Strategy |
Overlay (mm) |
Ranking |
Strategy |
Overlay (mm) |
1 |
Crack/break and seat |
203 |
1 |
None |
None |
|
2 |
Minimum |
102 |
1 |
Minimum |
None |
|
2 |
Maximum |
102 |
1 |
Maximum |
None |
|
2 |
Saw and seal |
102 |
4 |
Crack/break and seat |
203 |
|
5 |
Maximum |
None |
4 |
Crack/break and seat |
102 |
|
5 |
Crack/break and seat |
102 |
4 |
Maximum |
102 |
|
5 |
Minimum |
None |
4 |
Minimum |
102 |
|
8 |
Control |
8 |
Saw/seal |
102 |
||
1
inch = 25.4 mm
Note: The blank cell indicates that there was no overlay for the control.
The impact of rehabilitation strategies on roughness and total cracking performance was investigated for all sections in the JPCP sites of the SPS-6 experiment. Results from the statistical analysis suggest that rehabilitation treatments with HMA overlay provided smoother pavement sections. The best alternatives to mitigate the progression of total cracking were those without overlays. This result was influenced by the fact that, when combining all cracking from HMA overlays on PCC (including saw and seal joints), reflective cracking at joints was surveyed as longitudinal and transverse cracks, which significantly increased the amount of cracking observed in HMA overlaid sections. The main conclusions from table 70 and table 71 are as follows:
The influence of site conditions was determined by two variables: pavement surface condition prior to rehabilitation (fair versus poor) and climate (wet versus dry and freeze versus no-freeze). These conditions were determined for each site, and the Friedman test was applied to each group.
Additionally, traffic was investigated, and AADTT volumes were computed from 2000 to 2007. No significant variation in daily truck traffic was found among the sites in the SPS-6 experiment. All sites had AADTT values close to 800 trucks except for Missouri (1,700 average daily trucks) and South Dakota (292 daily trucks). Therefore, there were not enough sites with significant variations in traffic level that resulted in meaningful statistical results.
The analysis followed the same steps described in the previous section. Rehabilitation strategy rankings were developed for each group of sites using the paired analyses from the Friedman test if statistical differences in performance were found.
Table 72 and table 73 provide the rankings for roughness and total cracking for long-term performance in sections with poor and fair surface conditions prior to rehabilitation. For both tables, four sites were used in the analysis of poor surface condition. Despite grouping the data according to similar characteristics in respect to surface condition, the strategy rankings remained unaltered from the ranking considering all sites. One result was that the maximum restoration effort provided a smoother pavement in the long term than the minimum effort when neither received a HMA overlay.
Table 72. Summary of rankings for long-term performance of JPCP structures at SPS-6 sites in poor surface condition prior to rehabilitation.
Statistical Relevance (Y/N) |
Distress |
|||||
|---|---|---|---|---|---|---|
Roughness |
Total Cracking |
|||||
Y |
p = 0.0007 |
N |
||||
Ranking |
Ranking |
Strategy |
Overlay (mm) |
Ranking |
Strategy |
Overlay (mm) |
1 |
Crack/break and seat |
203 |
||||
2 |
Minimum |
102 |
||||
2 |
Saw/seal |
102 |
||||
2 |
Maximum |
102 |
||||
2 |
Crack/break and seat |
102 |
||||
2 |
Maximum |
None |
||||
7 |
Minimum |
None |
||||
7 |
Control |
|||||
1 inch = 25.4 mm
Note: Blank cells indicate that no data are available because cracking did not
have statistical relevance.
Table 73. Summary of rankings for long-term performance of JPCP structures at SPS-6 sites in fair surface condition prior to rehabilitation.
Statistical Relevance (Y/N) |
Distress |
|||||
|---|---|---|---|---|---|---|
Roughness |
Total Cracking |
|||||
Y |
p = 0.0052 |
Y |
p = 0.0009 |
|||
Ranking |
Ranking |
Strategy |
Overlay (mm) |
Ranking |
Strategy |
Overlay (mm) |
1 |
Crack/break and seat |
203 |
1 |
Maximum |
None |
|
2 |
Maximum |
102 |
1 |
Minimum |
None |
|
2 |
Minimum |
102 |
3 |
Control |
||
2 |
Maximum |
None |
3 |
Crack/break and seat |
203 |
|
2 |
Saw/seal |
102 |
3 |
Crack/break and seat |
102 |
|
2 |
Minimum |
None |
3 |
Minimum |
102 |
|
2 |
Crack/break and seat |
102 |
3 |
Maximum |
102 |
|
8 |
None |
None |
8 |
Saw/seal |
102 |
|
1 inch = 25.4 mm
Note: The blank cell indicates that there was no overlay for the control.
The influence of other site conditions was evaluated, and tables containing the statistical results and rankings are presented in appendix D.
After a careful assessment of the results from all the analyses performed, summary tables were assembled for better visualization and interpretation of results. These tables were created for each distress and analysis period (short-term and long-term performance). Table 74 and table 75 present the results for short-term and long-term roughness, while table 76 and table 77 describe the results for short-term and long-term total cracking. The best alternatives with statistical relevance are shown in each cell. The number before the treatment indicates its ranking among all the alternatives.
These summary tables provide information for selecting the best rehabilitation alternative among those evaluated in this study based on distress type and site conditions. Moreover, the influence of different site conditions can be determined by observing the best treatments for each condition. The analysis of sites in different climate regions and with different surface conditions resulted in rankings that are similar to each other. Therefore, the study suggests that site conditions did not have a significant impact on roughness and total cracking performance for the rehabilitation strategies included in the SPS-6 JPCP experiment.
Table 74. Summary of short-term roughness performance of JPCP structures.
Climate |
Surface Condition |
||||
|---|---|---|---|---|---|
Poor |
Overlay (mm) |
Fair |
Overlay (mm) |
||
Wet |
Freeze |
1: Crack/break and seat |
203 |
1: Crack/break and seat |
203 |
1:Minimum |
102 |
1: Minimum |
102 |
||
3: Maximum |
102 |
3: Maximum |
102 |
||
3: Saw/seal |
102 |
3: Saw/seal |
102 |
||
No-freeze |
1: Crack/break and seat |
203 |
1: Crack/break and seat |
203 |
|
1: Minimum |
102 |
1: Minimum |
102 |
||
3:Maximum |
102 |
3: Maximum |
102 |
||
3: Saw/seal |
102 |
3: Saw/seal |
102 |
||
Dry |
Freeze |
1: Crack/break and seat |
203 |
1: Crack/break and seat |
203 |
1: Maximum |
102 |
1: Maximum |
102 |
||
1: Minimum |
102 |
1: Minimum |
102 |
||
1: Saw/seal |
102 |
1: Saw/seal |
102 |
||
No-freeze |
1: Crack/break and seat |
203 |
1: Crack/break and seat |
203 |
|
1: Maximum |
102 |
1: Maximum |
102 |
||
1: Minimum |
102 |
1: Minimum |
102 |
||
1: Saw/seal |
102 |
1: Saw/seal |
102 |
||
1 inch = 25.4 mm
Table 75. Summary of long-term roughness performance of JPCP structures.
Climate |
Surface Condition |
||||
|---|---|---|---|---|---|
Poor |
Overlay (mm) |
Fair |
Overlay (mm) |
||
Wet |
Freeze |
1 : Crack/break and seat |
203 |
1: Crack/break and seat |
203 |
1: Minimum |
102 |
1: Minimum |
102 |
||
3:Maximum |
102 |
3: Maximum |
102 |
||
3:Saw/seal |
102 |
3: Saw/seal |
102 |
||
No-freeze |
1: Crack/break and seat |
203 |
1: Crack/break and seat |
203 |
|
1: Minimum |
102 |
1: Minimum |
102 |
||
3: Saw/seal |
102 |
3: Saw/seal |
102 |
||
4: Maximum |
102 |
4: Maximum |
102 |
||
Dry |
Freeze |
1: Crack/break and seat |
203 |
1: Crack/break and seat |
203 |
1: Maximum |
102 |
1: Maximum |
102 |
||
1: Minimum |
102 |
1: Minimum |
102 |
||
1: Saw/seal |
102 |
1: Saw/seal |
102 |
||
No-freeze |
1: Crack/break and seat |
203 |
1: Crack/break and seat |
203 |
|
1: Minimum |
102 |
1: Minimum |
102 |
||
1: Saw/seal |
102 |
1: Saw/seal |
102 |
||
4: Maximum |
102 |
4: Maximum |
102 |
||
Table 76. Summary of short-term total cracking performance of JPCP structures.
Climate |
Surface Condition |
||||
|---|---|---|---|---|---|
Poor |
Overlay (mm) |
Fair |
Overlay (mm) |
||
Wet |
Freeze |
1: Maximum |
None |
1: Maximum |
None |
1: Minimum |
None |
1: Minimum |
None |
||
3: Control |
3: Control |
||||
4: Crack/break and seat |
102 |
4: Crack/break and seat |
102 |
||
No-freeze |
1: Maximum |
None |
1: Maximum |
None |
|
1: Minimum |
None |
1: Minimum |
None |
||
3: Control |
3: Control |
||||
4: Crack/break and seat |
102 |
4: Crack/break and seat |
102 |
||
Dry |
Freeze |
1: Maximum |
None |
1: Maximum |
None |
1: Minimum |
None |
1: Minimum |
None |
||
1: Control |
3: Control |
||||
4: Crack/break and seat |
102 |
4: Crack/break and seat |
102 |
||
No-freeze |
1: Maximum |
None |
1: Maximum |
None |
|
1: Minimum |
None |
1: Minimum |
None |
||
1: Control |
3: Control |
||||
4: Crack/break and seat |
102 |
4: Crack/break and seat |
102 |
||
1 inch = 25.4 mm
Note: Blank cells indicate that there was no overlay for the control.
Table 77. Summary for long-term total cracking performance of JPCP structures.
Climate |
Surface Condition |
||||
|---|---|---|---|---|---|
Poor |
Overlay (mm) |
Fair |
Overlay (mm) |
||
Wet |
Freeze |
1: Maximum |
None |
1: Maximum |
None |
1: Minimum |
None |
1: Minimum |
None |
||
1: Control |
3: Control |
||||
4: Crack/break and seat |
102 |
4: Crack/break and seat |
102 |
||
No-freeze |
1: Maximum |
None |
1: Maximum |
None |
|
1: Minimum |
None |
1: Minimum |
None |
||
1: Control |
3: Control |
||||
4: Crack/break and seat |
102 |
4: Crack/break and seat |
102 |
||
Dry |
Freeze |
1: Maximum |
None |
1: Maximum |
None |
1: Minimum |
None |
1: Minimum |
None |
||
1: Control |
3: Control |
||||
4: Crack/break and seat |
102 |
4: Crack/break and seat |
102 |
||
No-freeze |
1: Maximum |
None |
1: Maximum |
None |
|
1: Minimum |
None |
1: Minimum |
None |
||
1: Control |
3: Control |
||||
4: Crack/beak and seat |
102 |
4: Crack/break and seat |
102 |
||
1 inch = 25.4 mm
Note: Blank cells indicate that there was no overlay for the control.
The summary tables show only alternatives in which statistically significant differences in performance were found. The tables were developed to identify the best alternatives for each type of analysis performed. The selected rehabilitation alternatives were then grouped for each combination of site conditions. Although these may be the best performance alternatives, they may not be the lowest cost alternatives, and selection of a rehabilitation alternative must also consider the cost.
From the summary tables, the following conclusion was made: crack/break and seat with 8-inch (203-mm) overlays and minimum restoration with 4-inch (102-mm) overlays were statistically equivalent and were found to be the best alternatives for most of the scenarios evaluated when short-term and long-term roughness performance was considered. Additionally, these alternative would be the highest cost alternative.
The analysis of total cracking indicated the following:
The sawed and sealed joints did not deteriorate significantly on these sections, and they became an effective control of reflection cracking. If they were removed from total cracking, the saw and sealed sections would have shown similar performance to other HMA overlays.
PCC Restoration Prior to Overlay
Different restoration treatments were applied prior to the installation of a 4-inch (102-mm) overlay in four sections as part of the rehabilitation strategy. The impact on performance of these PCC restoration treatments was evaluated by analyzing a subset of the data that included only four sections: 0603, 0604, 0606, and 0607 (see table 62). The same approach used in the analysis of the entire dataset and described in the previous section was applied in this investigation.
The surface layer after the rehabilitation that was completed was HMA, and the monitoring program to survey these sections was typically used for flexible pavements. Rutting, fatigue, and longitudinal and transverse cracking were used as performance measures. The subset of data was too small to provide results with statistical significance for the majority of distresses observed. Within the availability of data, only short-term and long-term transverse cracking performance was found to be statistically significant, and the results provided insight on expected performance.
Figure 44 (p = 0.0027, ANOVA chi-square = 14.175) and figure 45 (p < 0.0001, ANOVA chi-square = 21.75) present the average transverse cracking values computed as WD for both short-term and long-term performance. The vertical bars represent the variability among all sites represented by 1 standard deviation from the average. Both plots indicate that saw and seal after overlay (section 0604) was the least effective treatment to prevent transverse cracking, while crack/break and seat (section 0607) was the most effective. It could be argued that the sawed and sealed joints should be excluded from the analysis. This would result in saw and seal being similar to or better than any other overlay. The complete rankings of best-performing rehabilitation treatments with overlay are provided in table 78 and table 79 for short-term and long-term performance.
1 ft = 0.305 m
Figure 44. Graph. Average short-term WD-transverse cracking values for JPCP at SPS-6 sites.
1 ft = 0.305 m
Figure 45. Graph. Average long-term WD-transverse cracking values for JPCP at SPS-6 sites.
Table 78. Summary of rankings for short-term performance of JPCP composite structures at SPS-6 sites.
Transverse Cracking |
|||
|---|---|---|---|
Statistical Relevance (Y/N) |
Y |
p = 0.0027 |
|
Ranking |
Ranking |
Strategy |
Overlay (mm) |
1 |
Crack/break and seat |
102 |
|
2 |
Minimum |
102 |
|
2 |
Maximum |
102 |
|
4 |
Saw/seal |
102 |
|
Table 79. Summary of rankings for long-term performance of JPCP composite structures at SPS-6 sites.
Transverse Cracking |
|||
|---|---|---|---|
Statistical Relevance (Y/N) |
Y |
p < 0.0001 |
|
Ranking |
Ranking |
Strategy |
Overlay (mm) |
1 |
Crack/break and seat |
102 |
|
2 |
Minimum |
102 |
|
3 |
Maximum |
102 |
|
4 |
Saw/seal |
102 |
|
1 inch = 25.4 mm
The impact of PCC restoration treatments on performance of overlaid sections was investigated in the JPCP sites of the SPS-6 experiment. Transverse cracking was the only distress for which statistical differences were found between the four treatments. The conclusions from this study were as follows:
The analysis of impact of site conditions had additional constraints on data availability. Statistical differences in performance were identified for short-term roughness and short-term and long-term transverse cracking only. The results are presented in summary tables in appendix D.
Summary tables combine the results for all site conditions and provide a better visualization and interpretation of the outcome. They present the alternatives in which statistical significant differences in performance were found in the analysis. Blank cells indicate no statistical differences in performance of the selected alternatives. The rankings of best alternatives are shown in each cell. The number before the alternative indicates its ranking among all eight alternatives. When one or more alternatives were found to perform better than other sections but no difference was found between the selected ones, the same ranking was assigned to the group of alternatives. Table 80 presents the best restoration treatments prior to overlay for short-term roughness performance.
Table 80. Performance for short-term roughness of overlaid JPCP structures.
Climate |
Surface Condition |
||||
|---|---|---|---|---|---|
Poor |
Overlay (mm) |
Fair |
Overlay (mm) |
||
Wet |
Freeze |
1: Maximum |
102 |
1: Maximum |
102 |
1: Minimum |
102 |
1: Minimum |
102 |
||
1: Saw/seal |
102 |
1: Saw/seal |
102 |
||
No-freeze |
1: Maximum |
102 |
1: Maximum |
102 |
|
1: Minimum |
102 |
1: Minimum |
102 |
||
1: Saw/seal |
102 |
1: Saw/seal |
102 |
||
Dry |
Freeze |
||||
No-freeze |
|||||
1 inch = 25.4 mm
Note: Blank cells indicate that all alternatives have statistically equal
performances.
Table 81and table 82 present the results for short-term and long-term transverse cracking performance.
Table 81. Performance for short-term transverse cracking of overlaid JPCP structures.
Climate |
Surface Condition |
||||
|---|---|---|---|---|---|
Poor |
Overlay (mm) |
Fair |
Overlay (mm) |
||
Wet |
Freeze |
1: Crack/break and seat |
102 |
1: Crack/break and seat |
102 |
1: Maximum |
102 |
1: Maximum |
102 |
||
1: Minimum |
102 |
1: Minimum |
102 |
||
No-freeze |
1: Crack/break and seat |
102 |
1: Crack/break and seat |
102 |
|
1: Maximum |
102 |
1: Maximum |
102 |
||
1: Minimum |
102 |
1: Minimum |
102 |
||
Dry |
Freeze |
1: Crack/break and seat |
102 |
1: Crack/break and seat |
102 |
1: Maximum |
102 |
1: Maximum |
102 |
||
1: Minimum |
102 |
1: Minimum |
102 |
||
No-freeze |
1: Crack/break and seat |
102 |
1: Crack/break and seat |
102 |
|
1: Maximum |
102 |
1: Maximum |
102 |
||
1: Minimum |
102 |
1: Minimum |
102 |
||
1 inch = 25.4 mm
Table 82. Performance for long-term transverse cracking of overlaid JPCP structures.
Climate |
Surface Condition |
||||||||
|---|---|---|---|---|---|---|---|---|---|
Poor |
Overlay (mm) |
Fair |
Overlay (mm) |
||||||
Wet |
Freeze |
1: Crack/break and seat |
102 |
1: Crack/break and seat |
102 |
||||
1: Minimum |
102 |
1: Minimum |
102 |
||||||
3: Maximum |
102 |
3: Maximum |
102 |
||||||
No-freeze |
1: Crack/break and seat |
102 |
1: Crack/break and seat |
102 |
|||||
1: Minimum |
102 |
1: Minimum |
102 |
||||||
3:Maximum |
102 |
3: Maximum |
102 |
||||||
Dry |
Freeze |
1: Crack/break and seat |
102 |
1: Crack/break and seat |
102 |
||||
1: Minimum |
102 |
1: Minimum |
102 |
||||||
3: Maximum |
102 |
3: Maximum |
102 |
||||||
No-freeze |
1: Crack/break and seat |
102 |
1: Crack/break and seat |
102 |
|||||
1: Minimum |
102 |
1: Minimum |
102 |
||||||
3: Maximum |
102 |
3: Maximum |
102 |
||||||
1 inch = 25.4 mm
The summary tables only present alternatives for which statistically significant differences in performance were found. The tables were created by considering the best alternatives for each analysis performed in the dataset. These selected rehabilitation alternatives were then grouped for each combination of site conditions.
Based on the summary tables, the following conclusions were made:
PCC Restoration
Three sections in each SPS-6 site did not receive overlays as part of their rehabilitation strategies, and they were used to evaluate the impact of PCC restoration on performance. These sections were 0601 (control), 0602 (minimum restoration), and 0605 (maximum restoration). The same approach using the Friedman test was applied. Distresses that were common to rigid pavements were used as performance measures.
The small number of sections available for this study significantly reduced the power of the analysis and the chances of finding statistical differences among the treatment alternatives that were evaluated. No statistical differences in performance were found for short-term performance. The only performance indicator that showed statistical differences between the treatments was long-term roughness. Average WD values for long-term roughness are provided in figure 46 along with the variability of measures in the vertical bars representing one standard deviation from the average (p = 0.002, ANOVA chi-square = 12.4375). The ranking of best-performing alternatives is presented in table 83. Longitudinal slab cracking provides an example of performance data that were statistically equivalent (see figure 47 (p = 0.0582, ANOVA chi-square = 5.6875)). From the long-term roughness analysis, the findings supported by the statistical analysis can be summarized as follows:

1 ft = 0.305 m
1 mi = 1.61 km
Figure 46. Graph. Long-term WD-roughness for JPCP at SPS-6 site.
Table 83. Rankings for long-term performance of JPCP structures at SPS-6 sites.
Roughness |
|||
|---|---|---|---|
Statistical Relevance (Y/N) |
Y |
p = 0.002 |
|
Ranking |
Ranking |
Strategy |
Overlay (mm) |
1 |
Maximum |
None |
|
2 |
Minimum |
None |
|
3 |
Control |
None |
|
1 inch = 25.4 mm

1 ft = 0.305 m
Figure 47. Graph. Long-term WD-longitudinal cracking for JPCP at SPS-6 sites.
An attempt was made to evaluate the impact of site conditions on performance, but the results were not statistically significant. In part, this study remains mostly inconclusive, particularly due to the small sample size and consequent minimal power of the statistical analysis. Additional sections with rehabilitation treatments without overlays would provide a more robust characterization of performance differences among the rehabilitation treatments evaluated in this study.
Summary of Findings for JPCP Sites
When all sections in each site were evaluated simultaneously for roughness and total cracking performance, the following findings were observed:
The results of independent evaluation of sections with HMA overlays suggested the following:
The analysis of rehabilitation treatments without HMA overlays suggested the following:
This section describes the analysis results for JRCP sites in the SPS-6 experiment. There were six sites with JRCP structures in the experiment (see table 63). Similar to the study of JPCP sites, the analysis of SPS-6 sites with JRCP structures was originally intended to consider the impact of rehabilitation strategies on performance as well as the influence of climate and pavement surface conditions prior to rehabilitation. Unfortunately, the number of sites evaluated for each climatic region and surface condition was too small for any meaningful statistical analysis. Therefore, only the analysis considering all sites simultaneously was conducted. The study was divided in three parts: (1) all rehabilitation strategies, (2) PCC restoration prior to overlay, and (3) PCC restoration without overlay.
Analysis of All Rehabilitation Strategies
Roughness and total cracking were used to characterize performance and simultaneously evaluate all alternatives. Roughness was the only performance indicator measured for all sections within each site. The surveys were independent from surface type and were performed systematically during the experiment. They provided a uniform way of comparing the impact of different rehabilitation strategies used in the experiment. In addition to roughness, total cracking was used as an indicator of performance for the analysis of all sections. In this case, the measurements were not obtained directly. Cracking was measured depending on the surface layer type after the rehabilitation strategy was completed. For this study, total cracking was computed as the sum of fatigue, longitudinal cracking, and transverse cracking measured in sections overlaid with HMA and the sum of transverse and longitudinal slab cracking measured in sections without HMA overlays.
The same analysis approach described in previous sections using WD and the Friedman test was used to evaluate the impact of rehabilitation strategies of JRCP structures. After the data were processed and verified for quality, WD was computed for short-term and long-term performance. The Friedman test used WD to create a ranking of performance from the lowest value of WD (best performance) to the highest value (worst performance) for each site in the dataset. WD results for the entire set were then used in to determine the chi-square statistics to evaluate if differences existed among the performance rankings of the sections.
Roughness and long-term total cracking performances were statistically different among the rehabilitation strategies investigated. The results of the statistical analysis are presented in figure 48 (p = 0.0027, ANOVA chi-square = 21.8889), figure 49 (p < 0.0001, ANOVA chi-square = 30.7361), and figure 50 (p = 0.0047, ANOVA chi-square = 20.4444). Similar to the results for the JPCP sites, the results suggested that rehabilitation strategies with HMA overlays improved roughness performance, while strategies without overlays were better for improving total cracking development and propagation. The complete ranking of best-performing rehabilitation treatments with overlays is provided in table 84 for short-term performance and in table 85 for long-term performance.

1 ft = 0.305 m
1 mi = 1.61 km
Figure 48. Graph. Short-term WD-roughness values for JRCP at SPS-6 sites.
1 ft = 0.305 m
1 mi = 1.61 km
Figure 49. Graph. Long-term WD-roughness values for JRCP at SPS-6 sites.
1 ft2 = 0.093 m2
Figure 50. Graph. Long-term WD-total cracking values for JRCP at SPS-6 sites.
Table 84. Rankings for short-term performance of JRCP structures at SPS-6 sites.
Distress |
||||||
|---|---|---|---|---|---|---|
Statistical Relevance (Y/N) |
Roughness |
Total Cracking |
||||
Y |
p = 0.0027 |
N |
||||
Ranking (if relevant) |
Ranking |
Strategy |
Overlay (mm) |
Ranking |
Strategy |
Overlay (mm) |
1 |
Minimum |
102 |
||||
1 |
Maximum |
102 |
||||
3 |
Crack/break and seat |
203 |
||||
3 |
Saw/seal |
102 |
||||
3 |
Crack/ break and seat |
102 |
||||
3 |
Maximum |
None |
3 |
Minimum |
None |
8 |
Control |
1 inch =
24.5 mm
Note: The blank cells indicate that no differences were found in short-term
total cracking performance among
all treatments.
Table 85. Rankings for long-term performance of JRCP structures at SPS-6 sites.
Distress |
||||||
|---|---|---|---|---|---|---|
Statistical Relevance (Y/N) |
Roughness |
Total Cracking |
||||
Y |
p < 0.0001 |
Y |
p = 0.0047 |
|||
Ranking |
Ranking |
Strategy |
Overlay (mm) |
Ranking |
Strategy |
Overlay (mm) |
1 |
Crack/break and seat |
203 |
1 |
None |
||
2 |
Maximum |
102 |
1 |
Maximum |
None |
|
2 |
Minimum |
102 |
3 |
Minimum |
None |
|
4 |
Crack/break and seat |
102 |
3 |
Crack/break and seat |
102 |
|
4 |
Saw/seal |
102 |
3 |
Minimum |
102 |
|
6 |
Maximum |
None |
3 |
Maximum |
102 |
|
6 |
Minimum |
None |
3 |
Crack/break and seat |
203 |
|
8 |
None |
None |
8 |
Saw/seal |
102 |
|
1 inch = 24.5 mm
Note: The blank cell indicates that there was no overlay for the control.
The results from table 84 and table 85 suggest that rehabilitation strategies with overlays were better for improving roughness performance for both short-term and long-term performance when compared to strategies without overlays. No difference was found in short-term total cracking performance among all treatments, while the control section (no treatment) and maximum restoration without overlays were identified as the best strategies in the long term.
The impact of rehabilitation strategies on roughness and total cracking performance was investigated for all sections in the JRCP sites. Results from the statistical analysis suggest that rehabilitation treatments with HMA overlays provided smoother pavement sections, as expected. The best alternatives to mitigate the progression of total cracking were the ones without overlays. This result was probably influenced by the fact that, when combining all cracking from HMA overlays on PCC, reflective cracking at joints were surveyed as longitudinal and transverse cracks. Additionally, for nonoverlaid sections, the joints were not counted as cracks, which significantly increased the amount of cracking observed during the surveys of HMA overlaid sections. The main conclusions from table 84 and table 85 were as follows:
The sawed and sealed joints did not deteriorate significantly on these sections, and they became an effective control of reflection cracking. If they were removed from total cracking, the saw and sealed sections would have shown similar performance to other HMA overlays.
PCC Restoration Prior to Overlay
The impact on performance of PCC restoration prior to overlaying the structure with HMA was evaluated by analyzing a subset of the data that included sections 0603, 0604, 0606, and 0607 (see table 62). The sample size was too small to identify statistical differences for the majority of distresses evaluated. Only short-term and long-term transverse cracking performances were found to be statistically different when comparing the rehabilitation alternatives.
Figure 51 (p = 0.0041, ANOVA chi-square = 13.25) and figure 52 (p = 0.0012, ANOVA chi-square = 15.8) summarize the average WD results with associated standard deviations for short-term and long-term values. Both figures indicate that saw and seal prior to overlay (section 0604) was the worst treatment to prevent transverse cracking when the sawed joints were considered cracks, while crack/break and seat (section 0607) was the best treatment. The complete rankings of best-performing rehabilitation treatments with overlays are provided in table 86 for short-term performance and in table 87 for long-term performance.

1 ft = 0.305 m
Figure 51. Graph. Average short-term WD-transverse cracking values for JRCP at SPS-6 sites.

1 ft = 0.305 m
Figure 52. Graph. Average long-term WD-transverse cracking values for JRCP at SPS-6 sites.
Table 86. Rankings for short-term performance of JRCP composite structures at SPS-6 sites.
Transverse Cracking |
|||
|---|---|---|---|
Statistical Relevance (Y/N) |
Y |
p = 0.0041 |
|
Ranking |
Ranking |
Strategy |
Overlay (mm) |
1 |
Crack/break and seat |
102 |
|
2 |
Maximum |
102 |
|
2 |
Minimum |
102 |
|
4 |
Saw/seal |
102 |
|
Table 87. Rankings for long-term performance of JRCP composite structures at SPS-6 sites.
Transverse Cracking |
|||
|---|---|---|---|
Statistical Relevance (Y/N) |
Y |
p = 0.0012 |
|
Ranking |
Ranking |
Strategy |
Overlay (mm) |
1 |
Crack/break and seat |
102 |
|
1 |
Minimum |
102 |
|
3 |
Maximum |
102 |
|
4 |
Saw/seal |
102 |
|
1 inch = 25.4 mm
The impact of PCC restoration treatments on performance of overlaid sections was investigated for JRCP sites of the SPS-6 experiment. Transverse cracking was the only distress for which statistical differences were found between the four treatments. The conclusions from this study were as follows:
The sawed and sealed joints did not significantly deteriorate on these sections, and they became an effective control of reflection cracking. If they were removed from total cracking, the sawed and sealed sections would have shown similar performance to other HMA overlays.
PCC Restoration
Three sections in each SPS-6 site did not receive overlays as part of their rehabilitation strategies, and they were used to evaluate the impact of PCC restoration on performance. The sections included 0601 (control), 0602 (minimum restoration), and 0605 (maximum restoration). Distresses common to rigid pavements were used as performance measures.
The only performance indicator that showed statistical differences between the treatments was short-term transverse slab cracking. Average WD values for short-term transverse slab cracking are provided in figure 53 (p = 0.0111, ANOVA chi-square = 9) along with the variability of measures in the vertical bars represented by one standard deviation from the average. From this figure, the ranking of best-performing alternatives was created and is presented in table 88.
The maximum restoration treatment and the control section had statistically equivalent performances for short-term transverse slab cracking. The minimum restoration treatment provided the worst transverse slab cracking performance. The small number of sites limited the statistical findings.

1 inch = 25.4 mm
Figure 53. Graph. Short-term average WD-transverse cracking values for JRCP at SPS-6 sites.
Table 88. Rankings for short-term performance of JRCP structures at SPS-6 sites.
Transverse Cracking |
|||
|---|---|---|---|
Statistical Relevance (Y/N) |
Y |
p = 0.0111 |
|
Ranking |
Ranking |
Strategy |
Overlay (mm) |
1 |
Maximum |
None |
|
1 |
None |
None |
|
3 |
Minimum |
None |
|
1 inch = 25.4 mm
Summary of Findings for JRCP Sites
When all sections in each site were evaluated simultaneously for roughness and total cracking performance, the following were observed:
The results of independent evaluation of sections with HMA overlays suggested the following:
The sawed and sealed joints did not deteriorate significantly on these sections, and they became an effective control of reflection cracking. If reflective cracking could be removed from total cracking, the saw and sealed sections would have shown similar performance to other treatments.
The findings from this statistical analysis of sections without HMA overlay were as follows:
The study to evaluate the impact of design features and site conditions on response of rehabilitated rigid pavements followed the same approach used in the study of performance. FWD deflections obtained from the LTPP database were used as the response measure of the pavement structure. The main difficulty was to determine which deflection measure to use. Sections with concrete slabs at the surface were evaluated as typical rigid pavements. Deflections at the center of the slab and at the transfer joints were used in this study. Sections that received an HMA overlay were monitored like flexible pavements, and deflections at the center of the lane were used.
Two separate analyses were developed to address both deflection measurement patterns. The first analysis was performed by selecting only sections with a concrete slab surface. The analysis investigated the impact of rehabilitation strategies on deflections at the center of the slab and LTE between slabs. The second analysis evaluated the impact of PCC treatments prior to overlay on maximum deflection measured at the center of the lane after being overlaid.
JPCP and JRCP structures were evaluated independently. Sections 0601, 0603, and 0605 were used to evaluate the maximum deflection at the center of the slab and LTE, while sections 0603, 0604, 0606, and 0607 were used to evaluate maximum deflection at the center of the lane in the composite pavement structures. There were limitations due to the amount of data available, especially after the data were grouped by pavement structure type and surface. The statistical power of the analysis was limited because of the small sample size (eight sites), and no statistical differences were found in the pavement response of JPCP structures.
The only analysis that provided some statistically meaningful results was the evaluation of maximum deflection at the center lane of overlaid JRCP structures. Figure 54 (p = 0.0155, ANOVA chi-square = 10.4) and figure 55 (p = 0.0351, ANOVA chi-square = 8.6) provide the Friedman test results for short-term and long-term maximum deflection, respectively. The vertical bars represent the 68 percent interval, indicating the level of variability given by one standard deviation from the average WD value for maximum deflections. Table 89 and table 90 present the ranking of rehabilitation strategies based on measurements of maximum deflection at the center of the lane.
1 ![]() m = 0.039 mil
m = 0.039 mil
Figure 54. Graph. Maximum deflection (center of lane) short-term WD values for JRCP at SPS-6 sites.
1 ![]() m = 0.039 mil
m = 0.039 mil
Figure 55. Graph. Maximum deflection (center of lane) long-term WD values for JRCP at SPS-6 sites.
Table 89. Rankings for short-term maximum deflection at the center of the lane of JRCP composite structures in SPS-6 sections.
Maximum Deflection at Center of Lane |
|||
|---|---|---|---|
Statistical Relevance (Y/N) |
Y |
p = 0.0155 |
|
Ranking |
Ranking |
Strategy |
Overlay (mm) |
1 (Lowest deflection) |
Minimum |
102 |
|
2 |
Saw/seal |
102 |
|
2 |
Maximum |
102 |
|
4 |
Crack/break and seat |
102 |
|
Table 90. Rankings for long-term maximum deflection at the center of the lane of JRCP composite structures in SPS-6 sections.
Maximum Deflection at Center of Lane |
|||
|---|---|---|---|
Statistical Relevance (Y/N) |
Y |
p = 0.0351 |
|
Ranking |
Ranking |
Strategy |
Overlay (mm) |
1 (Lowest deflection) |
Maximum |
102 |
|
1 |
Minimum |
102 |
|
3 |
Saw/seal |
102 |
|
4 |
Crack/break and seat |
102 |
|
1 inch = 25.4 mm
The results suggest that crack/break and seat significantly increased the overall deflections measured on the pavement surface. The remaining treatments interchangeably provided equivalent maximum deflection magnitudes. These results were expected because crack/break and seat was an alternative in which the concrete was reduced to smaller pieces, resulting in lower stiffness that increased the maximum deflection at the center of the slab.
There have been several attempts to find direct relationships or models to predict performance based on the structural response of the pavement to loading immediately after rehabilitation. These relationships are not as straightforward as expected, and accurately deriving them is difficult. The objective of this study was to identify trends in the relationship between response measured immediately after the rehabilitation and the observed performance in the subsequent years of the pavement's service life. If identified, these trends can provide important information and guidance to infer the expected pavement performance as a result of the rehabilitation strategy.
Different structural responses were evaluated against the average pavement performance represented by specific distress levels over time for rehabilitation alternatives of SPS-6 sites. LTE between slabs and maximum deflection at the center of the slab were used when the surface remained concrete slabs after rehabilitation. Maximum deflection at the center of the lane was used when the surface changed to HMA after rehabilitation. The average WD for the specific distress was used as the performance measure. Each response was evaluated against all distresses used previously in this study. Long term-performance was used, which represented performance data for 5 years or more.
The SPS-6 experiment had sites across the United States in different climatic zones and subgrade types. Consequently, the results from this study could be impacted by in situ conditions. The alternative to circumvent this problem was to normalize the data in each site by a common factor. For this purpose, one section was selected to be the normalization factor. Response and performance measured at this section were used to normalize the data of the remaining sections in each site. After some trial and error, the results provided helpful and qualitative information about the expected performance given the pavement response measured after the rehabilitation work had been completed.
LTE Versus Performance in JPCP
Section 0602 was selected as the normalization factor for the analysis of sections without overlay. Normalized values were computed according to the equation in figure 56. LTE analysis used deflections at the edge of the slabs forming the transverse joint. An average ratio between deflections at the loaded slab and adjacent slab was used to calculate LTE. Only transverse slab cracking exhibited a clear trend with LTE values. Figure 57 shows normalized transverse slab cracking versus normalized LTE. As the efficiency of the load transfer increases, the amount of transverse slab cracking decreases. This trend suggests that good load transfer joint restoration is important to mitigate the development and propagation of slab cracking.
![]()
Figure 56. Equation. Parameter subscript normalized.
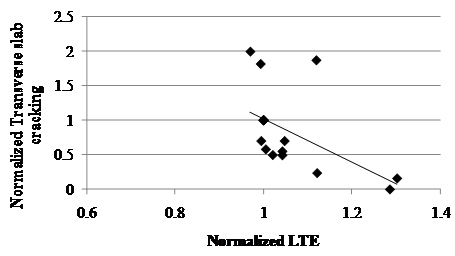
Figure 57. Graph. Normalized long-term transverse cracking versus normalized LTE measured after rehabilitation of JPCP sites.
Maximum Deflection at Center of Slab Versus JPCP Performance
Maximum deflection at the center of the slab was investigated as one possible response that could be associated with future performance. The trend between performance based on roughness and deflection measured at the center of the slab is shown in figure 58, which suggests that higher deflections indicate smoother JPCP over time. This trend is not what would normally be expected, and other correlations for cracking are further examined in the next section.
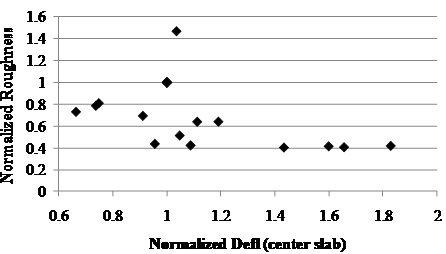
Figure 58. Graph. Normalized long-term roughness versus normalized deflection at the center of the slab measured immediately after rehabilitation of JPCP sites.
The level of slab cracking also showed an inverse trend with maximum deflection measured at the center of the slab. The results presented in figure 59 show normalized values for total cracking as a function of normalized deflection. The trend suggests that slabs with higher deflections under FWD loading are less likely to develop cracking. The results shown in figure 60 for longitudinal cracking also suggest the same observation, although no trend was found for transverse cracking (see figure 61). A possible explanation is that stiffer subgrades resulted in higher slab curling and warping stresses, which led to increased slab cracking. This same result was found in MEPDG.(1) While stiffer foundations reduced axle load stresses, they increased curling and warping stresses, which tended to dominate cracking.
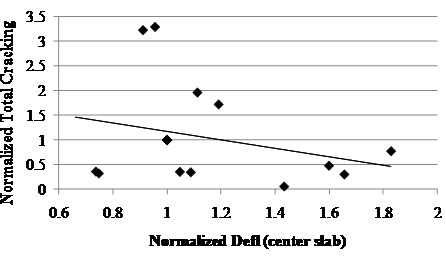
Figure 59. Graph. Normalized long-term total cracking versus normalized deflection at the center of the slab measured immediately after rehabilitation of JPCP sites.
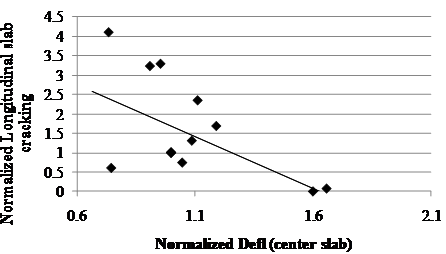
Figure 60. Graph. Normalized long-term longitudinal slab cracking versus normalized deflection at the center of slab measured after rehabilitation of JPCP sites.
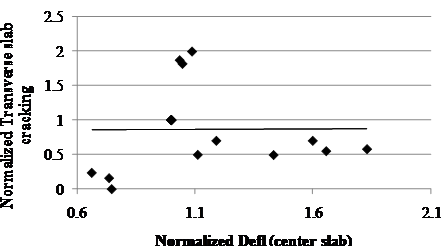
Figure 61. Graph. Normalized long-term transverse cracking versus normalized deflection at the center of slab measured after rehabilitation of JPCP sites.
Faulting was also investigated in this study. The trend obtained from the data analyzed is presented in figure 62, suggesting that faulting was inversely proportional to deflection measured at the center of the slab. High deflection values yielded low faulting, although the trend was weak and depended on only one or two points. No logical explanation exists for this result because the opposite result should occur theoretically. However, the small number of data points limited the outcome of the analysis.
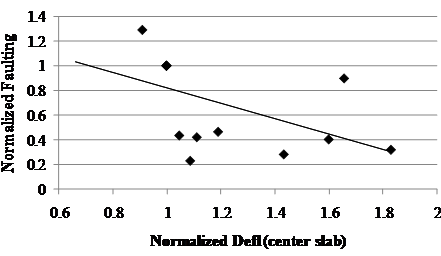
Figure 62. Graph. Normalized long-term faulting versus normalized deflection at the center of slab measured after rehabilitation of JPCP sites.
Maximum Deflection at Center of Lane Versus Performance of Overlaid JPCP
Maximum deflection at the center of the lane was measured in sections that received an overlay as part of the rehabilitation strategy. Sections 0603, 0604, 0606, 0607, and 0608 received different PCC restoration treatments, but all were overlaid as the final step in the rehabilitation process. Section 0603 was chosen for data normalization. Most of the distresses had clear trends with the chosen response. The trends agreed with the conventional understanding and expectations of the relationship between performance and response.
The positive trend between roughness and maximum deflection is shown in figure 63. There was a clear indication in the data, suggesting that overlaid JPCP with high deflections were more likely to be rougher in the long term when compared to sections with low deflection values. Similarly, it was found that overlaid JPCP sections with high center lane deflections were more likely to experience increased rutting compared to sections with low deflection values, as suggested in figure 64. Since most rutting occurred in the HMA layer, the cause for this result was not explainable unless the HMA was so soft that it was contributing to the deflections. Normally, deflections are in the foundation of JPCP.
Fatigue cracking exhibited an expected trend with deflection for overlaid JPCP sections. The trend in figure 65 suggests that high fatigue cracking was expected when deflections values were high. The results in figure 66 suggest that high longitudinal cracking values were observed when maximum deflection at the center of the lane was low. This indicated that the pavement structure was less deformable and more susceptible to surface tensile stresses, which was an important contributor to development and propagation of longitudinal cracking.
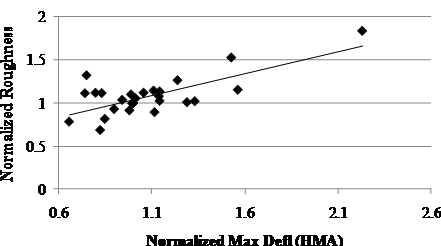
Figure 63. Graph. Normalized long-term roughness versus normalized deflection at the center of the lane measured after rehabilitation of overlaid JPCP sites.
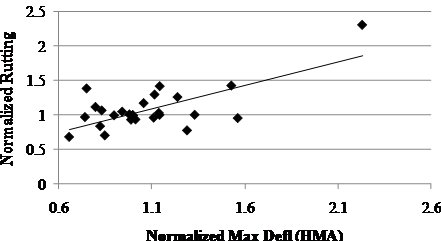
Figure 64. Graph. Normalized long-term rutting versus normalized deflection at the center of the lane measured after rehabilitation of overlaid JPCP sites.
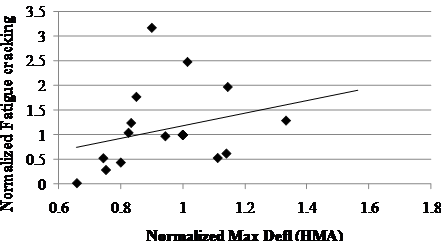
Figure 65. Graph. Normalized long-term fatigue cracking versus normalized deflection at the center of the lane measured after rehabilitation of overlaid JPCP sites.
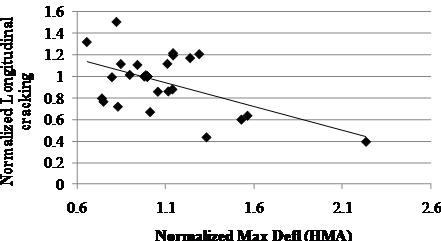
Figure 66. Graph. Normalized long-term longitudinal cracking versus normalized deflection at the center of the lane measured after rehabilitation of overlaid JPCP sites.
Response Versus Performance in JRCP
The investigation of possible trends between response and performance in JRCP structures did not result in any significant conclusions. Different performance measures were analyzed against LTE, maximum deflection at the center of the slab, and maximum deflection at the center of the lane; however, no relevant conclusions were reached.

