U.S. Department of Transportation
Federal Highway Administration
1200 New Jersey Avenue, SE
Washington, DC 20590
202-366-4000
Federal Highway Administration Research and Technology
Coordinating, Developing, and Delivering Highway Transportation Innovations
| REPORT |
| This report is an archived publication and may contain dated technical, contact, and link information |
|
| Publication Number: FHWA-HRT-14-070 Date: September 2014 |
Publication Number: FHWA-HRT-14-070 Date: September 2014 |
Over the last 20 years, structural engineers and architects have proposed the use of cable-stayed bridges for increasingly diverse situations. Either for long main spans where only suspension bridges would have been traditionally considered or wide roadways with medium spans where cantilever or arch bridges would have been selected, cable-stayed bridges are now being built as the more economical and practical solution. This has promoted the development of innovative structural design and fabrication techniques. For example, the majority of the modern cable-stayed bridges now use stay cables that are fabricated directly on the construction site as opposed to being pre-fabricated in a factory and shipped to the site in large coils, providing substantial cost and time savings.
Typical in-situ fabricated stay cables are each made of a bundle of parallel steel cables that are fed through an HDPE tube one by one and are anchored to the towers and deck at a prescribed tension. Each cable is made of five to seven steel strands and is covered by a polyethylene sheath. A 16-cm external diameter stay cable would be made of approximately 40 to 55 steel cables and would have a mass per unit length of 60 to 80 kg/m. Approximately 50 to 60 percent of the surface area of the stay is steel, and the other 40 to 50 percent is polyethylene, air, grease, wax, or concrete grout. Figure 1 and figure 2 show stay cables of the Millau Viaduct in France and the Clark Bridge that spans from Alton, IL, to West Alton MO, respectively.
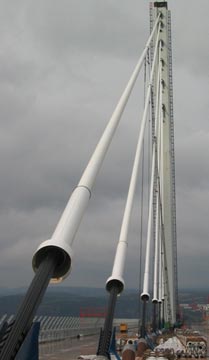 |
| Figure 1. Photo. Modern stay cables with HDPE tube cover on the Millau Viaduct |
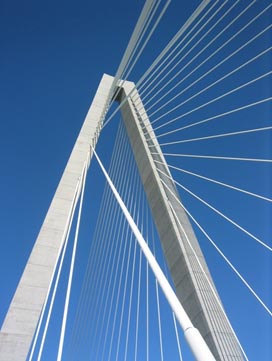 |
| Figure 2. Photo. Modern stay cables with HDPE tube cover on the Clark Bridge |
The HDPE tube serves three main purposes: (1) aerodynamic drag reduction, (2) corrosion protection, and (3) aesthetics. However, it has some drawbacks, in particular when it comes to the effects of wind. Stay cables generally have low structural damping (≈ 0.1 to 0.2 percent of critical damping) and are exposed to wind and are thus prone to wind-induced vibrations. The HPDE tube helps by reducing the drag coefficient of the stays, therefore reducing vibrations due to buffeting from turbulence. However, the smooth surface of the tube combined with light rain and light winds can translate to severe rain/wind-induced vibrations of the stay cables. Also, the smooth surface of the tube in combination with its attitude (inclination and yaw angles) to the wind can induce undesirable dry-inclined cable galloping for a specific range of mean wind speeds corresponding to the critical Reynolds number regime.
To mitigate the increased sensitivity to wind-induced vibrations of the stay cable covered with a smooth HDPE tube, three approaches are being used:
Since the construction of the Pont de Normandie in France in the early 1990s, the majority of cable-stayed bridges built in Europe and North America have stay cables fitted with a helical fillet to prevent rain/wind vibrations. This countermeasure has proven to be highly effective against this phenomenon, in particular when combined with an increase of structural damping. Wind tunnel tests have been conducted to verify that the helical fillet worked.(2,3) However, no official design guidelines or specifications exist on what the geometry of the helical fillet should be for it to be effective. The industry has adopted what experience has shown as a viable solution based on its first use for Pont de Normandie, and nowadays, stay cable manufacturers are each proposing their own solutions. Table 1 presents a short list of helical fillet geometry that has been installed on bridges. The pitch and helix angle of the helical fillet are defined in figure 3. For this study, a double, parallel, and right-handed helical fillet was used.
Table 1. Typical prototype helical fillet geometries (all double helix).
| Bridge and Location | Cable Diameter (mm) |
Pitch (mm) |
Helix Angle (degrees) |
Pitch to Diameter Ratio | Helical Fillet (mm) |
Description Helical Fillet |
| Normandie; France | 170 | 600 | 41.7 | 3.5 | 1.3 diameter | Round |
| Oresund; Sweden to Denmark | 250 | 550 | 55.0 | 2.2 | 2.1 high x 3.0 wide | Rectangular |
| Charles River; Boston, MA | 178 | 610 | 42.5 | 3.4 | 1.5 high x 3.3 wide | Rectangular |
| Generic 1 | 200 | 600 | 46.3 | 3.0 | 2.0 diameter | Round |
| Generic 2 | 160 | 490 | 45.7 | 3.1 | 4.0 diameter | Round |
| Generic 3 | 200 | 620 | 45.4 | 3.1 | 2.0 diameter x 4.0 wide | Round |
| Generic 4 | 200 | 630 | 45.0 | 3.1 | 2.0 diameter x 4.0 wide | Round |
| Present study | 162 | 520 | 44.4 | 3.2 | 2.3 high x 2.4 wide | Rectangular |
| Note: Generic refers to HDPE pipe specimens with helical fillet. | ||||||
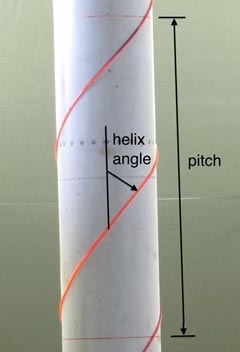 |
| Figure 3. Photo. Pitch and helix angle. |
Without official specifications for the helical fillet geometry, it is understandable that the aerodynamics of the stay cable with a helical fillet is not generally well defined. It is hard to find in literature the mean force coefficients of stay cables with helical fillets and, in particular, the across-wind coefficients. The rule of thumb is that the helical fillet increases the drag coefficient of the stay cables to around 0.7 to 0.8. For stay cables inclined and yawed to the wind with a helical fillet (i.e., for the majority of stay cables built in the last 15 years), the aerodynamic force coefficients are not available.
Whether such alteration to the smooth HDPE tube covering the stays could cause inclined cable galloping is not known, and to the authors’ knowledge, this issue has not been addressed. The purpose of the present study is to fill this gap.
The cable model used for two previous 1:1 scale studies in 2001 and 2008 at NRC-IAR in the same wind tunnel facility was reused for the present study. (See references 4–7.) No modifications of the model itself were necessary with the exception of a thorough cleaning of the surface to make it as uniform as possible, a verification of each of the surface pressure taps and pneumatic tubing installed for the 2008 measurement campaign and the installation of removable helical fillets.
The model was composed of a rigid steel tube 6,687 mm long with an outer diameter of 139.7 mm and a wall thickness of 15.9 mm. The steel tube was covered with a white HDPE tube 6,198 mm long with an inner diameter of 141 mm and a mean outer diameter of 161.7 mm. Two hatches were cut in the steel pipe and HDPE tube to allow for the installation of the surface pressure taps, pneumatic tubing, and electronic pressure transducers.
The main characteristics of the model were as follows:Visual inspection of the model revealed that the outside geometry of the HDPE tube was not perfectly round. To characterize its relative eccentricity, the outside diameter of the model was measured at every 10 degrees of azimuth at four span-wise locations, which correspond to the location of the four rings of surface pressure taps. The results are presented in figure 4. The largest observed deviation was equivalent to 1 percent of the mean diameter with four distinct regions alternating from peak to valley. Flamand and Boujard have reported a similar profile for a HDPE tube and suggest that the method of production of the tube using extrusion results in a shape that differs systematically from a circle.(8)
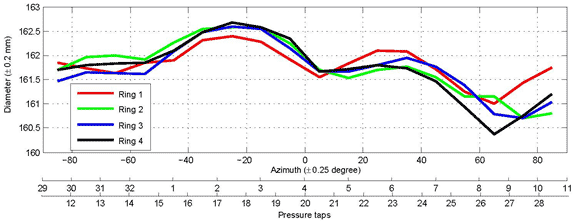 |
| Figure 4. Graph. Variations of the cable model diameter with azimuth at four span-wise locations. |
A helical fillet with a rectangular cross section 2.3 mm high and 2.4 mm wide was fixed in a right-handed direction to the surface of the model with double-sided tape that was 0.1 mm thick. The geometry was selected to represent as close as possible what is used in practice as presented in table 1. A double parallel helix with a pitch of 520 mm was used with a helix angle of 44.5 degrees (See figure 5 and figure 6). The method of installation of the helical fillet was selected so that it could be removed without marking the external surface of the HDPE tube.
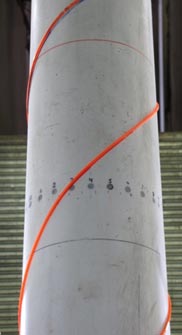 |
| Figure 5. Photo. Close-up view of double helical right-handed fillet. |
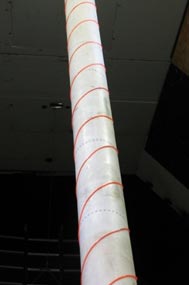 |
| Figure 6. Photo. Overview of double helical right-handed fillet. |
The sectional model rig used for the two previous experiments with an inclined cable in the same test facility was also used for the present study.(7) The only modification that was made to the rig was to allow rotation of the cable model on its axis without a rotation of the spring plane. In the previous experiments, it was possible to rotate the cable on its axis by rotating the spring plane, therefore changing two parameters at the same time. In light of the variations of diameter shown in figure 4, it was considered important to keep the rotation of the model on its axis as an independent parameter.
The suspension system was composed of eight springs and one axial suspension cable. The rig allowed for motion of the cable in two orthogonal planes, with four springs per plane, which is described as sway for a nominally across-wind motion and heave for a nominally along-wind motion. The springs were set on two large drums and tensioning frames, one for each extremity of the model, known as the lower and upper rigs (see figure 7 and figure 8). The stiffness of each spring could be adjusted by changing the number of active coils. The tension in each spring could also be adjusted using a threaded rod pulling system. The orientation of the spring planes with the flow could be changed by rotating the large drums of the lower and upper rig on their axes. Finally, by changing the position of the upper rig in relation to the lower rig, the inclination of the model could be changed.
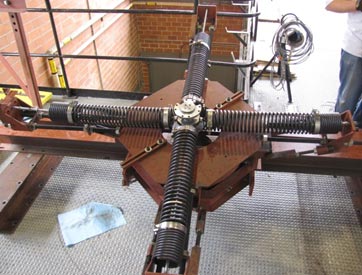 |
| Figure 7. Photo. Lower rig with spring rotation at 0 degrees. |
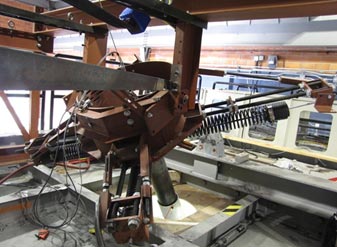 |
| Figure 8. Photo. Upper rig with spring rotation at 45 degrees. |
The axial suspension cable linked the top end of the model to a cross beam at the ceiling of the wind tunnel building. Its role was to take a large part of the weight of the model, preventing it from sliding downwards. The length and the angle of the axial cable in relation to the model were fully adjustable. Figure 9 and figure 10 show overall views of the experimental setup. In figure 9, the red arrow above the wind tunnel roof points to the axial cable supporting the model.
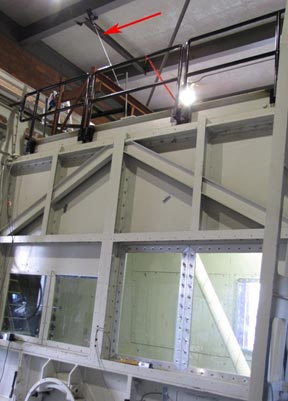 |
| Figure 9. Photo. Cable model at an inclination of 60 degrees from outside the test section of the 3-by-6-m Propulsion and Icing Wind Tunnel. |
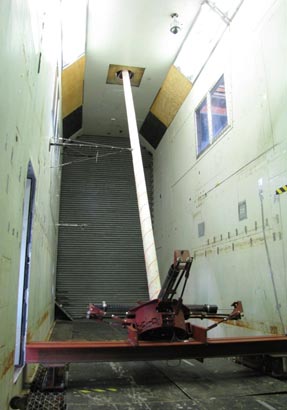 |
| Figure 10. Photo. Cable model at an inclination of 60 degrees from inside the test section of the 3-by-6-m Propulsion and Icing Wind Tunnel. |
To allow for rotation of the model on its axis, two small turntables were added to the flanges that link the extremities of the model to the springs (see figure 11). The model was set free to rotate on its axis by simply loosening two set screws at its extremities. Any rotation was possible.
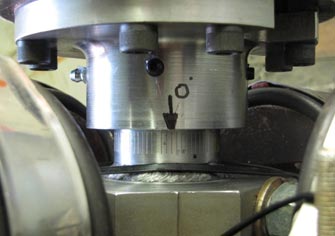 |
| Figure 11. Photo. Turntable that allowed rotation of the cable model on its axis. |
Because all springs were identical, it was possible to adjust their axial stiffness by carefully controlling the number of active coils. For each spring, a steel perch could be threaded in and out of the springs, therefore freeing or locking out a set number of coils. From the 2001 inclined cable study, it was established that 28 active coils corresponded to an axial stiffness of 4.78 kN/m.(4,5) From the 2008 study, it was observed that the axial cable contributed to a non-negligible part of the stiffness of the upper rig.(6,7) At an inclination angle of 60 degrees, the tension in the axial cable contributed to a stiffness of approximately 1.0 kN/m.
To maintain the previous oscillation frequencies (≈ 1.41Hz) and frequency ratio (≈ 1.02 sway-to-heave) as well as the upper and lower rig stiffness, the springs were adjusted to the number of active coils as shown in table 2.
Table 2. Number of active coils per spring.
| Springs | Sway (Two Springs) |
Heave (Two Springs) |
| Upper rig | 28.00 | 26.75 |
| Lower rig | 24.38 | 25.38 |
Each spring was pre-tensioned independently to ensure a linear motion for the entire range of vibrations expected during the tests. The level of tension in the springs in one plane affected the frequencies of oscillations in the other plane, so care was taken to adjust the tension through a control of the spring extension when the model was at rest.
Taking into account the masses of the steel core of the model, the HDPE tube, the instrumentation, the links between the model and the springs, and one-third of the mass of the active part of the springs, the suspended mass was established at 407 kg for this study in accordance with the 2001 and 2008 mass estimates. (See references 4–7.) The distance between the two spring planes was fixed at 6,858 mm. As stated earlier, the length of the steel core of the model was 6,687 mm. However, the length of the model exposed to the flow was slightly shorter at 6,100 mm for the 60-degree inclination case. The mass per unit exposed length of the cable model was therefore equivalent to 66.7 kg/m. Table 3 summarizes the dimensions of the cable related to its length or to the distance between lasers used at both extremities of the cable.
Table 3. Cable length or distance for instrumentation at both extremities of the cable.
| Measurement | Length (mm) |
| Cable length (polyethylene part) | 6,198 |
| Cable length (steel part) | 6,687 |
| Distance between spring planes | 6,858 |
| Distance between displacement transducers for sway | 7,116 |
| Distance between displacement transducers for heave | 7,285 |
| Representative exposed cable length at 60-degree inclination | 6,100 |
| Representative exposed cable length at 45-degree inclination | 6,000 |
The upper end of the model pierced through the roof of the wind tunnel. The lower end of the model and the lower rig were fully immersed in the flow. For the majority of the tests, the circular hole at the interface between the roof and the model was kept open and allowed model displacement of approximately 120 mm. For one case, the hole was sealed to identify the influence of the end conditions on the mean aerodynamic characteristics of the cable model. Figure 12 and figure 13 show the top end of the model.
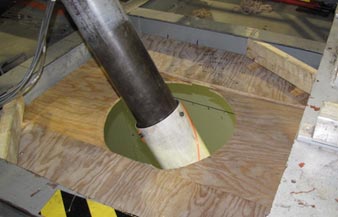 |
| Figure 12. Photo. Top of the open interface between the cable model and the roof of the wind tunnel. |
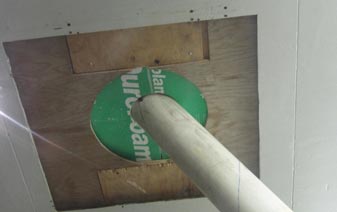 |
| Figure 13. Photo. Underside of the sealed interface between the cable model and the roof of the wind tunnel. |
Smooth Flow
All tests were carried out in the NRC-IAR 3-by-6-m Propulsion and Icing Wind Tunnel in Ottawa, Canada. This test facility is an open circuit wind tunnel of the blowing type. A 7.9-m-diameter 16-blade fan draws outdoor air and pushes it through a large settling chamber followed by a 6:1 ratio contraction before entering the 12.2-m-long test section. The fan is fitted with a set of anti-swirl stators, and the settling chamber has a set of fine mesh screens to keep flow turbulence to a minimum. The test section is followed by a diffuser with a 90-degree bend and exhausts directly outdoors. The test section is 3.05 m wide and 6.1 m high. It is equipped with removable fillets reducing in size in the direction of the flow to mitigate stream-wise pressure gradients associated with growth of the wall boundary layers. The entire floor of the test section is mounted on jacks and can be raised by 2 m.
The fan is powered by a 750-kW direct current motor, providing a maximum wind speed of 39 m/s for the empty test section. The wind speed is controlled by increasing the fan revolutions per minute, which can be done in small increments, allowing a fine adjustment of the mean wind speed when outdoor conditions are calm. In gusty conditions, the wind speed inside the test section can experience low frequency modulation for wind speed below about 14 m/s.
For the present study, only the fillets of the test section roof where installed. Prior to the installation of the cable model, a calibration of the test section dynamic pressure in relation to the pressure difference between the settling chamber and the test section inlet was carried out. The latter was measured during the entire investigation to provide the test section dynamic pressure and wind speed. Figure 14 shows a downstream view of the configuration of the test section during calibration.
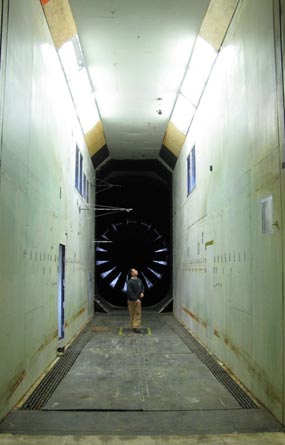 |
| Figure 14. Photo. Downstream view of the test section during dynamic pressure calibration prior to the installation of the cable model. |
The turbulence intensity of the flow was measured throughout the tests at the entrance of the test section, 4 m above the floor, using a Turbulent Flow Instrumentation (TFI) Cobra Probe, which provides, with a high sampling frequency, the three unsteady components of the wind speed and the turbulence characteristics of the wind. For mean wind speeds above 14 m/s, the turbulence intensity varied between 0.35 and 0.5 percent. For lower wind speeds (8 to 12 m/s) in calm days outdoors, similar turbulence levels were observed. On windy days, the turbulence level below 14 m/s generally increased and was typically in the 0.7 to 1.2 percent range. Figure 15 compares the variations of longitudinal turbulence intensity (Iu) with wind speed for the smooth flow case on a calm day versus a windy day.
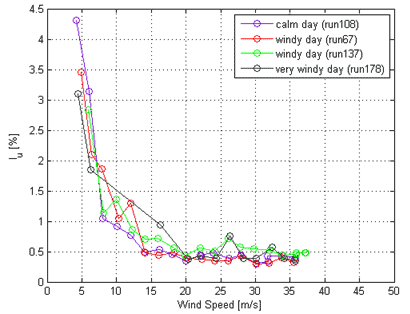 |
| Figure 15. Graph. Variations of Iu with wind speed measured at the entrance of the test section for different external conditions for the smooth flow case. |
Turbulent Flow
The test program included experiments in turbulent flow for the cable model with a 60-degree inclination. The objective was to study the aerodynamics of the cable with and without the helical fillet in a uniform flow field with turbulence characteristics representative of conditions found in the field.
The following characteristics were deemed important to consider in the definition of the turbulence field to use:
Given the limited length of the test section in relation to the length of the model, it was not possible to use large vortex generators such as large bar lattice structures, spires, or panels far ahead of the model and let this turbulence stretch in the test section before reaching the model. It was also not possible to use a rope net or mesh with a small bar size and mesh size to fulfill characteristics 2 and 4.
To obtain a uniform turbulence level, a grid had to be used. However, since the turbulence level decayed rapidly as the vortices traveled downstream, the grid could not be installed vertically at the entrance of the test section like it is commonly done. The turbulence level at the top of the model (closer to the grid) would have been larger than the turbulence level at the bottom of the model, which was approximately 3 m downstream of the top of the model. To fulfill characteristic 3, the grid had to be installed parallel to the cable (i.e., inclined at 60 degrees from the floor). The bar size of the grid had to be large enough to produce eddies bigger than the helical fillet cross section, and the mesh size had to be small enough to promote flow mixing downstream. The logistics of installing a turbulence grid inclined at 60 degrees and with enough strength to sustain 39 m/s winds for a long period suggested the use of a light metallic structure.
Five aluminum ladders 6.4 m long were fastened together and lifted in place in parallel to the model. The ladders spanned the entire height of the test section and 80 percent of the width. They formed a quasi-uniform grid with a bar size of 35 mm and mesh size of 305 mm. Two positions upstream of the model were investigated. The first position was 3.3 m upstream and had a turbulence level above the limit defined in characteristic 1. The second position was 5.1 m upstream of the model and had a mean turbulence level of 3.5 to 4.5 percent and was retained as the solution for the tests. Figure 16 and figure 17 show downstream views of the ladder grid for the two investigated positions.
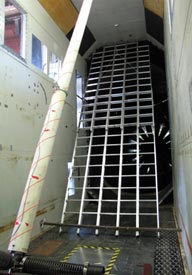 |
| Figure 16. Photo. Grid of ladders used to generate the turbulent flow field for position 1. |
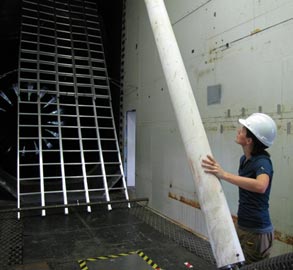 |
| Figure 17. Photo. Grid of ladders used to generate the turbulent flow field for position 2. |
A TFI Cobra Probe was used to document the turbulent flow field behind the ladder grid. The cable model was used to support the probe at several heights above the floor (see figure 18). The probe was mounted 430 mm in front of the model.
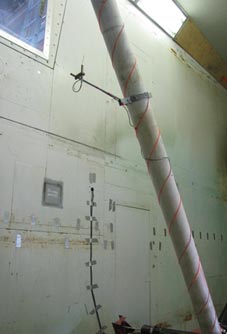 |
| Figure 18. Photo. TFI Cobra Probe attached to the cable model to measure the turbulence level behind the grid of ladders. |
Figure 19 and figure 20 present the results of the measurements of the oncoming turbulent flow field for the turbulent flow test cases. The integral scales of the turbulence, calculated using the autocorrelation function approach, were as follows: longitudinal, xLu = 90 mm, lateral, xLv = 47 mm, and vertical, xLw = 46 mm. The turbulence length scales were 40 times larger than the size of the helical fillet for the longitudinal components of the flow and 20 times for the other directions.
|
||
| Figure 19. Graph. Variations of the normalized spectral densities of the wind velocity fluctuations with frequencies for the smooth and turbulent flow cases. |
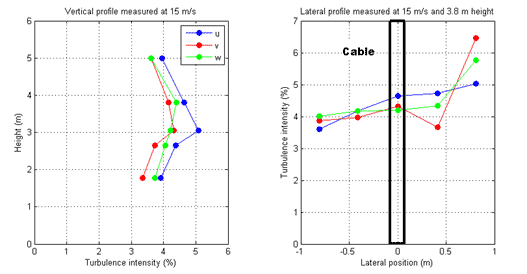 |
| Figure 20. Graph. Vertical and lateral profiles of the intensity of turbulence for the three wind components for the turbulent flow for position 2. |
The left graph in figure 20 presents the variations of the turbulence intensity with height at the model location. The turbulence intensity was uniform along the length of the model with the exception of a slight increase at the wind tunnel mid-height corresponding to a region where the grid of ladders had a higher density. The ladders forming the upper part of the grid overlapped with the ladders forming the lower part of the grid over a 1.5-m section at the center of the wind tunnel. The lateral uniformity of the turbulence (right graph of figure 20) was also acceptable with the exception of an increase in turbulence level near the starboard wall. Within a region of ±4 cable diameters from the model centerline, the flow turbulence can be considered uniform laterally.