U.S. Department of Transportation
Federal Highway Administration
1200 New Jersey Avenue, SE
Washington, DC 20590
202-366-4000
Federal Highway Administration Research and Technology
Coordinating, Developing, and Delivering Highway Transportation Innovations
| REPORT |
| This report is an archived publication and may contain dated technical, contact, and link information |
|
| Publication Number: FHWA-HRT-14-070 Date: September 2014 |
Publication Number: FHWA-HRT-14-070 Date: September 2014 |
A two-page graphical summary of the results collected is presented in appendix B for each test run defined in table 4 (see figure 59 through figure 183). For the dynamic tests, the graphs present the variation of the response of the model for four modes of oscillations as a function of wind speed and Reynolds number. The four modes of oscillations are: (1) the sway (across-wind), (2) heave (along-wind), (3) first modes where both ends of the cable model moved in a synchronous manner, and (4) end-to-end modes (sway and heave) where the model extremities were out of phase with each other. The Reynolds number in the graphs is based on the mean wind speed as measured in the frame of reference of the wind tunnel and the cable model mean diameter, D = 161.7 mm.
The response given in the graphs corresponds to the maximum amplitude of motion of the cable model both from the displacement transducers and from the accelerometers during a 90-s period at the mean wind speeds indicated in the graphs. For the same period of time and experimental conditions, the graphs in appendix B show the following parameters as a function of Reynolds number as follows:
When specific test conditions did not apply (e.g., when the cable model was locked for the static tests), the appropriate graphs were left blank.
The two main findings of the first phase of the investigation were: (1) a stay cable with a typical helical fillet and inclined at 60 degrees to the flow can sustain wind-induced vibrations in smooth flow, and (2) the amplitude of the cable vibrations observed were greatly influenced by the geometry of the HDPE tube, whereby a rotation of the cable model on its longitudinal axis could translate into vibrations with unacceptable amplitudes or vibrations with small amplitude. The first finding is new (i.e., it has not been reported elsewhere). It was not expected since the general belief was that the helical fillet would reduce the sensitivity of the aerodynamics of the model to Reynolds number effects in the critical regime, which is believed to be a primary cause of inclined cable galloping. It might explain observations of stay cable vibrations of cables with a helical fillet in dry conditions as reported in field measurement campaigns. The oscillations were not caused by buffeting due to turbulence and were similar to high reduced velocity vortex shedding.(4) The oscillations occurred in some cases at higher wind speeds than what were reported earlier for a smooth cable, in a Reynolds number range above what is generally considered the critical range for which the static coefficients do not vary significantly with wind speed.
The second finding is also unique and strongly affected the course of the tests. However, it was anticipated based on the observations reported by Flamand and Boujard who pointed out the systematic deviation of general HDPE tubes from a circular shape and its possible corresponding consequences on the mean aerodynamic force coefficients.(8) The test cable cross sectional shape exhibited the same type of asymmetry as measured at four longitudinal positions (see figure 4). The measurements showed deviations of up to 1 percent of the mean cable diameter. The location of the deviations around the circumference appeared to be consistent along the length of the model, suggesting that they were formed during the extruding process of the HDPE tube or during its long-term storage. If an asymmetric pressure distribution can be observed on a smooth round model in the critical regime due to the formation of a small laminar separation bubble on one side of the model and not on the other, as reported in Larose et al., it is understandable that a mildly asymmetric cable shape will have complex aerodynamic properties in the same critical Reynolds number regime.(12)
Based on the second finding, it was concluded that each time the cable was rotated on its axis, a new shape was exposed to the flow, and a different behavior could be expected. This affected the test program greatly since originally it was planned to rotate the cable model on its axis at four azimuths, 0, 13.8, -13.8, and 27.7 degrees, to obtain a clear understanding of the mean force coefficients based on the integration of the surface pressures at four rings. These four azimuths were selected so that three of the four rings of pressure taps for each azimuth would be located at three different cross-sectional locations in relation to the helical fillet.
In four cable rotations, 12 different cross sections of the model with helical fillets would have been covered. Assuming that the model was symmetric, it was believed that a reliable representation of the quasi-steady aerodynamics of cable model would come from the average of cross-sectional coefficients of the four rings for four azimuths (i.e., the average of 16 measurements). However, since the cable model was not symmetric, this averaging across the four azimuths was not sufficient to represent the aerodynamics of the entire model. Several of the static tests, designed to provide the quasi-steady aerodynamics of the cable model, were replaced by dynamic tests at various additional model rotations.
Influence of the Cable Rotation
As described in the “Suspension System” section in chapter 2, a new feature of the mechanical setup of the cable allowed for the rotation of the cable along its main axis without changing the spring plane angle, therefore not affecting the wind-angle plane and the main direction of motion of the cable. An evaluation of the response of the cable for different angles of rotation was carried out. While the original plan was to perform only a few angles to identify the azimuth for which the largest response of the cable was observed, the differences in the results led to a reconsideration of the number of azimuth angles to be selected for performing the measurements.
In fact, for the cable with the helical fillet and inclined at 60 degrees, in smooth flow 13 rotations of the cable were carried out from -92 to 65 degrees. Significant vibration of the model in the sway mode was observed for the cable rotated at angular positions of -92, -90, and -88 degrees. The angular position was defined as being 0 degrees when pressure tap 4 was the stagnation point, and a negative angle was associated with a clockwise rotation of the cable from a top view perspective. The 0-degree azimuth defined in this manner corresponded to the same 0 degrees of the 2001 and 2008 studies. (See references 4–7.) Large amplitude displacements in the first sway mode (across-wind) on the order of 30 to 75 mm were observed in the vicinity of -90 degrees but did not occur for the other rotations examined. Figure 29 shows the amplitude of motion in sway obtained for four different angles of rotation of the cable.
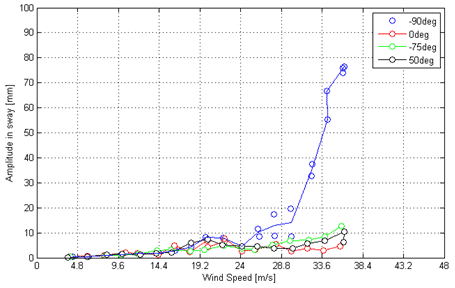 |
| Figure 29. Graph. Amplitude of motion in sway for four different rotations of the cable along its main axis for the cable inclined at 60 degrees with helical fillet and in smooth flow. |
The azimuth angles were picked through inspection of the cross-sectional profiles of the cable model shown in figure 4. It was theorized that a point of inflection in the cross-sectional profile that would be located in the vicinity of the point of separation of the boundary layer at the surface of the model could have an influence on the response, especially if this point of inflection was not symmetric between the two sides of the model. With figure 4 as a reference, when the azimuth of the model was set at -90 degrees, the point of inflection in the profiles centered at azimuth 4 degrees was at 94 degrees from the stagnation point and therefore likely near the area on the cable model where separation of the boundary layer could be expected. This surface deformation could have caused the boundary layer to separate earlier or later on one side of the cable or the other, creating fluctuating across-wind forces due to the motion of the model and undefined possible instabilities.
It is difficult to attribute the variation in the response of the cable model solely on its orientation or attitude to the flow as other factors might have contributed to affect the response. However, there is evidence that around a certain range of cable rotations, the model appeared to be more lively, inferring stronger wind excitation, stronger buildup of energy, and larger vibrations.
A similar verification of the influence of the model orientation on the wind induced response was carried out for the other configurations of the cable (i.e., in turbulent flow or for the cable without the helical fillet). Fewer angles of rotation were tested to evaluate the response of the cable under these other conditions and surprisingly, it was not only around -90 degrees that the cable moved considerably but also around 0, 50, and -54.7 degrees. Under the circumstances of this study, it is therefore difficult to predict the worst response of a stay cable without performing systematic measurements at multiple azimuth angles (over the 360-degree range) as the cable and its HDPE tube are not perfectly round and its behavior appeared to be strongly dependent on its attitude to the main direction of the wind. This conclusion also applies to a stay cable in turbulent flow or without a helical fillet since all those configurations have shown that the cable can give a different response depending on its angle of rotation. It is possible that larger sway vibrations could have occurred for the cable model of this study with rotation beyond the -94 to +65 degrees that was covered. It was out of the scope of work to look for the extreme response in relation to this parameter.
Influence of Cable-Wind Angle Plane
The baseline position of the upper and lower four-spring planes was 0 degrees, with four springs allowing mostly across-wind motion and four springs allowing mostly along-wind motion. The system of spring-planes could be rotated equally at the top and bottom of the cable model to modify the trajectory that the model would take in relation to the main flow direction, referred to here as the “cable-wind plane.” As for the 2001 and 2008 studies, it was possible to adjust the cable-wind plane to any desired values. (See references 4–7.) However, thanks to the new cable model turntables, it was possible to modify the cable-wind plane without affecting the attitude of the cable model to the flow. Both parameters (cable-wind plane and rotation of cable on its axis) could be changed independently, allowing the evaluation the effect of the cable-wind plane only on the response of the cable.
Tests were performed with the cable inclined at 60 degrees in smooth flow with the cable rotated at -90 degrees where strong vibrations were observed for a cable-wind plane of 0 degrees. The cable-wind angle plane was changed to -54.7 and -12.5 degrees. The angle of rotation of the spring plane was negative for a clockwise rotation of the system from a top-down point of view. The first angle of the spring plane of -54.7 degrees was chosen because it represents, in combination with a 60-degree inclination of the cable, a configuration identical to a 45-degree inclination and 45-degree yaw of the cable, which is of interest for cable stay bridges as defined in table 5. This cable-wind plane was also studied in 2001 and 2008. (See references 4–7.)
The second spring angle of -12.5 degrees was selected based on the motion path of the cable observed when the spring angle was at 0 degrees; the cable was not moving perfectly in the across-wind direction but rather at -12.5 degrees from the across-wind axis (see figure 107 in appendix B).
Tests were performed for both additional cable-wind planes, keeping the angle of rotation of the model on its axis at -90 degrees. The tests indicated that the response of the cable was different depending on the spring plane angle. At 0 degrees, the cable was moving strongly with displacement around 75 mm at 36 m/s, while for the spring angle of -54.7 degrees (run 131), the cable was not oscillating significantly. This clearly demonstrated the importance of the relative angle between the motion of the cable and the wind, as anticipated by Macdonald and Larose.(13)
For a spring angle of -12.5 degrees, two runs were performed. The first one (run 163) did not result in significant vibration of the cable, while the second run (run 167) had large amplitude displacements of 50 mm in the sway mode for the wind speed range of 22 to 36 m/s (see figure 30). The difference between the responses of the cable for those two runs is believed to be associated with the flow disturbance coming from outside of the test section. The first run was carried out during a very windy day, which affected the turbulence intensity of the oncoming flow on the cable, especially for wind speeds lower than 20 m/s. The longitudinal turbulence intensity was above 1 percent for speeds below 20 m/s. The variations of the mean wind speed due to this turbulence can affect not only the response of the cable for the low mean wind speeds but also the susceptibility of the cable motion to build and to undergo larger vibration at higher wind speed. The second run (run 167) was performed during a relatively calm day, with a longitudinal turbulence intensity measured at the entrance of the test section lower than 1 percent for wind speeds higher than 5 m/s. Large displacements were observed, but the amplitudes did not exceed the amplitudes observed for a cable-wind plane of 0 degrees.
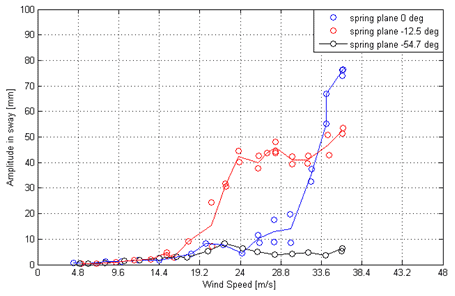 |
| Figure 30. Graph. Amplitude of motion in sway for three different spring plane rotations for the cable inclined at 60 degrees with helical and in smooth flow. |
Additional analysis of the turbulence characteristics and its potential influence on the cable vibrations, which is beyond the scope of the present study, is recommended for these cases.
Influence of Cable Inclination
As part of the second phase of the investigation, the inclination of the model was changed from 60 to 45 degrees (see figure 31). Comparison of the results obtained for both cable inclinations with the same cable rotation (-90 and 0 degrees) and cable-wind plane (0 degrees) was performed. It can be observed in figure 59, figure 106, figure 114, and figure 116 in appendix B that the inclination of the cable did affect the response of the cable for a rotated angle of -90 degrees. At a 45-degree inclination, the cable did not oscillate significantly as it did for the cable inclined at 60 degrees where 75 mm amplitude displacement were observed at 36 m/s. At a 0-degree rotation of the model, no significant vibrations were observed for both cable inclinations.
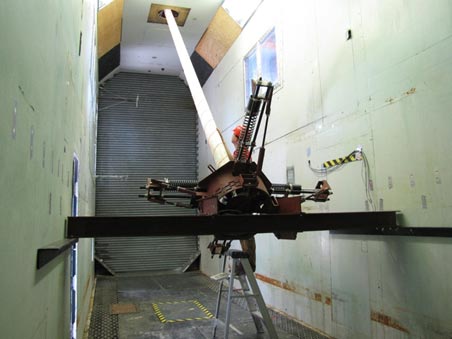 |
| Figure 31. Photo. Cable model at 45-degree inclination and 0-degree spring rotation with smooth flow. |
The mean force coefficients calculated from each ring of surface pressures revealed that the cable inclined at 45 degrees showed much less variation of the mean Cy as a function of Reynolds number compared to the cable inclined at 60 degrees (see figure 32). This observation was consistent with the mean Cy, which presented large variations for wind speeds lower than 19 m/s, showing negative and positive values for the case of the cable at 60 degrees inclination. At 45 degrees, Cy was stable with a more-or-less constant value between 0.2 and 0.5.
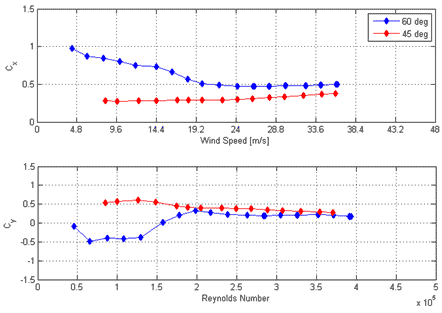 |
| Figure 32. Graph. Mean force coefficients calculated from the integration of surface pressure measurements for the cable inclined at 60 and 45 degrees and rotated at -90 degrees along its main axis in smooth flow and with a helical fillet. |
Several other tests were carried out for a cable inclination of 45 degrees with the helical fillet in place to look for galloping or other wind-induced vibrations. The model was rotated on its axis (-90, 0, 23, and -25 degrees) and the spring plane was also rotated (-54.7, -45, and -12.5 degrees). No significant wind-induced vibrations were observed for a wind speed range of 4 to 36 m/s for these cases. Since the cable model experienced more variations of its cross-sectional force coefficients and larger amplitude of motion at 60-degree inclination, the focus of the second phase of the study was defined to investigate the factors that affect the behavior of the cable only for a 60-degree inclination.
As reported earlier, tests at an inclination of 60 degrees with the helical fillet in smooth flow revealed large oscillations of the cable model in the sway modes at several wind speeds. Experiments were subsequently carried out to define the level of damping necessary to mitigate the vibrations. As per the 2001 tests, the structural damping of the suspension system was first increased by wrapping viscoelastic material (rubber bands) around the active coils of the springs (see figure 33).(4,5) Several rubber bands had to be used to increase by 66 percent the damping level. To obtain a larger increase of the damping level, adding rubber bands was not sufficient to reach a damping level corresponding to a Scruton number (Sc) of 5.0 or more. Scruton number is defined in figure 34.
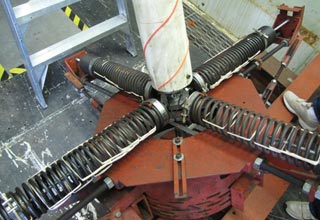 |
| Figure 33. Photo. Elastic bands used to increase the structural damping of the suspension system. |
| Figure 34. Equation. Scruton number. |
Where:
m = Mass per unit length of the model.
ζ = Damping ratio (fraction of critical damping).
ρ = Air density.
d = Mean diameter of the model.
A Scruton number of 5.0 is used as a reference value by the Post-Tensioning Institute guidelines as the mass damping parameter level necessary to mitigate rain/wind-induced vibrations of stay cables with a helical fillet.(1) To reach a Scruton number greater than 5.0, washers covered with a visco-elastic material were inserted between the suspension rig frame and the locking nuts of the threaded rods that were used to control the tension in the springs (see figure 35). It was observed that the damping level of the suspension system was sensitive to the level of contact between the locking nuts and the frame, with a larger contact lowering the damping. By reducing the contact pressure through the compression of a viscoelastic material, the level of damping was increased to the desired value in a repeatable way.
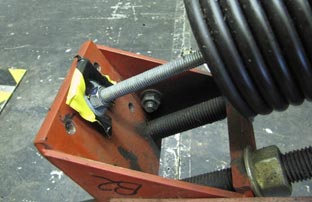 |
| Figure 35. Photo. Viscoelastic washer used to increase the structural damping of the suspension system. |
Figure 36 and figure 37 show the variations of structural damping with amplitude for the three levels of damping examined for both the sway and heave modes respectively. The damping level were referred as follows:
The graphs showing the actual decay traces for each case are presented in appendix B (see figure 184 through figure 186).
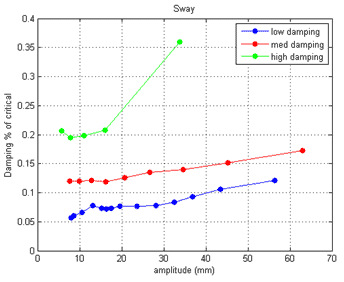 |
| Figure 36. Graph. Structural damping level as a function of amplitude of motion of the cable for the sway mode. |
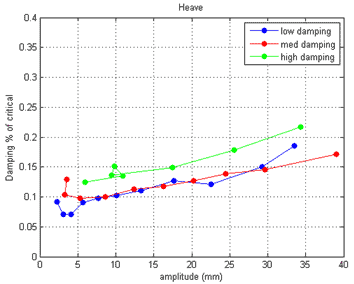 |
| Figure 37. Graph. Structural damping level as a function of amplitude of motion of the cable for the heave mode. |
Figure 38 shows the response of the cable for three different levels of damping. The cable was oriented at 60 degrees from the horizontal with a wind-angle plane of 0 degrees. The cable was rotated along its main axis to -90 degrees with the helical fillet and in smooth flow.
The graphs on the left side of figure 38 indicate the amplitude of motion as detected by the laser displacement and by the accelerometers. The amplitudes were obtained by averaging the maximum and minimum displacement or acceleration. Results indicate that a structural damping level of 0.25 percent (Sc = 5.1) in sway allowed a reduction the amplitude of displacement from 75 to 25 mm or from 7 to 2 m/s2 at the maximum wind speed of 36 m/s. The graphs on the right side of figure 38 show that the mean forces acting on the cable (drag and lift force in the cable axis reference) were not significantly affected by the variation of damping level.
Figure 38 also presents results associated with a repetition of the same configuration at the low damping level case. It can be observed that the maximum amplitude of displacement was not repeated for both low damping level cases. One of the reasons could be linked with the variation of the turbulence intensity of the oncoming flow due to the wind conditions outdoors. The first test where large amplitude was observed was done on a calm day (run 122) with longitudinal turbulence intensity generally low (0.5 percent from 19 to 36 m/s), while the repeat test where low amplitude was observed (run 178) was done on a windy day with more variation of the turbulence intensity as measured at the entrance of the test section and presented in figure 107 for run 122 and in figure 139 for run 178 (see appendix B).
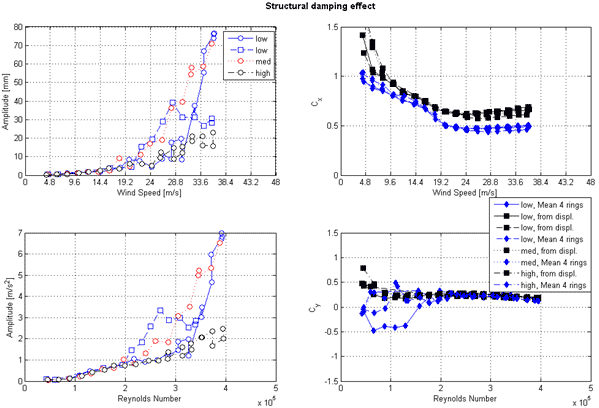 |
| Figure 38. Graph. Response of the cable model as a function of wind speed or Reynolds number for three damping levels as measured by lasers, accelerometers, and surface pressures for different levels of damping. |
No other tests were carried out during the present investigation to evaluate the level of damping needed to mitigate the observed vibrations.
Several tests were conducted in turbulent flow for the test section configuration described in the “Turbulent Flow” section in chapter 2 and shown in figure 39. The effect of wind turbulence on the response of the cable rotated at -90 degrees is presented in figure 40 through figure 43 for the cable with and without the helical fillet, respectively. The results indicate that a 4 to 5 percent intensity of turbulence was not sufficient to mitigate the large vibration of the cable in the sway mode that was observed in smooth flow condition for a cable rotation on its axis between -88 and -92 degrees for the cable with or without a helical fillet. The turbulence seemed to reduce the amplitude of motion, and the vibrations took place at a lower wind speed compared to the smooth flow condition when the helical fillet was present.
However, large vibrations were observed in turbulent flow at higher wind speeds in the end-to-end sway mode that were not present in smooth flow. The same observations were made for the cable without the helical fillet; end-to-end sway motion was strong and present for many of the configurations investigated in turbulent flow. It was accompanied by oscillations in the first sway mode, which were strong not only for cable rotations of -90 and -88 degrees but also at -54.7, 0, -2, and 2 degrees for the cable model without the helical fillet and at an inclination of 60 degrees.
The turbulence had a pronounced effect on the cross-sectional force coefficients, both for the cable model with the helical fillet and for the smooth cable. The effect was similar for the two cases, as illustrated in figure 41 and figure 43, for a cable inclination of 60 degrees and model rotation of -90 degrees.
For the case with the helical fillet, the turbulence reduced the velocity at which Cx reached its minimum by approximately 10 m/s. The rate of change of Cx with Reynolds number appeared to be slightly larger in turbulent flow than in smooth flow for parts of the drag crisis. Note that the larger the rate of change of the coefficients with Reynolds number, the higher the possibility of wind excitation from a quasi-steady aerodynamics point of view.
The turbulence appeared to have eliminated or at least greatly reduced the strong asymmetric pressure distributions in the wind speed range from 5 to 15 m/s that were causing the mean Cy to reach values around -0.45 in smooth flow. This can be considered as a stabilizing influence.
For the case of the smooth cable, the turbulence reduced (with even a larger margin) the velocity at which Cx reached its minimum. The lowest Cx was reached at a velocity 16 m/s lower in turbulent flow than in smooth flow. As for the case with the helical fillet, the rate of change of Cx with Reynolds number appeared to be slightly larger in turbulent flow than in smooth flow. For Cy, the smooth cable had a positive Cy of 0.5 at a velocity of 19 m/s in smooth flow. This positive value was eliminated almost completely by the turbulence with the exception of a small region with Cy ≈ 0.2 at 8 m/s.
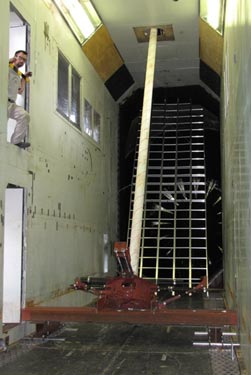 |
| Figure 39. Photo. Cable model at 60-degree inclination and 0-degree spring rotation in turbulent flow. |
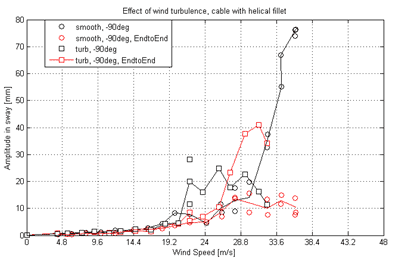 |
| Figure 40. Graph. Amplitude of motion in sway and end-to-end sway at cable rotation of -90 degrees and inclined at 60 degrees with a helical fillet in smooth and turbulent flow. |
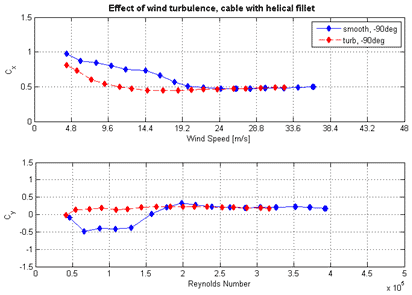 |
| Figure 41. Graph. Mean force coefficients at cable rotation of -90 degrees and inclined at 60 degrees with a helical fillet in smooth and turbulent flow. |
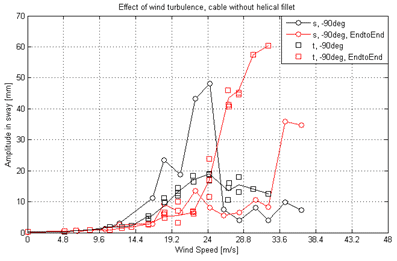 |
| Figure 42. Graph. Amplitude of motion in sway and end-to-end sway at cable rotation of -90 degrees and inclined at 60 degrees without a helical fillet in smooth and turbulent flow. |
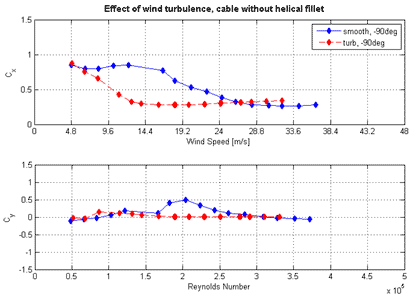 |
| Figure 43. Graph. Mean force coefficients at cable rotation of -90 degrees and inclined at 60 degrees without a helical fillet in smooth and turbulent flow. |
The helical fillet did not mitigate the vibration of the cable. Figure 40 and figure 42 show examples of the response of the cable for different conditions with and without the presence of the helical fillet, respectively. Figure 44 and figure 45 present the results associated with the effect of the presence of the helical fillet for cable rotated at -90 and 0 degrees in smooth flow and the effect of the helical fillet on the mean force coefficients observed for the case at 0 degrees. Sinusoidal wind-induced vibrations were observed independent of the helical fillet. However, the amplitude of vibrations was in general lower when the fillet was in place, and the vibrations occurred at a higher wind speeds.
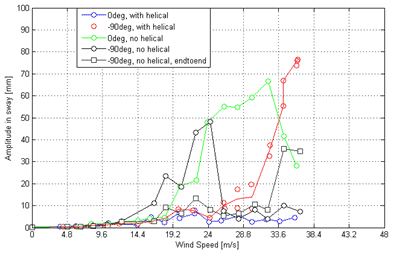 |
| Figure 44. Graph. Amplitude of motion in sway and end-to-end sway for the cable rotated at -90 and 0 degrees and inclined at 60 degrees in smooth flow with and without a helical fillet. |
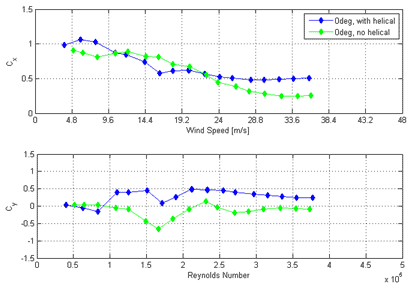 |
| Figure 45. Graph. Mean force coefficients for cable rotated at 0 degrees and inclined at 60 degrees in smooth flow with and without helical fillet. |
The helical fillet shifted the critical Reynolds number regime to lower wind speeds similar to the effect associated with an increase of surface roughness. The rate of change of both the along-wind and across-wind mean force coefficients with Reynolds number was found to be lower with the helical fillet in place. Nevertheless, large vibrations were observed for the cable model inclined at 60 degrees with the helical fillet in smooth flow over a range of Reynolds number where the coefficients did not change rapidly with wind speed. This is opposite to observations made during previous studies on the same model, where the change of the coefficients with Reynolds number was identified as the primary cause of the cable vibrations, in particular when the static coefficient curves reached a point of inflection as a function of Reynolds number, as clearly demonstrated by Andersen.(7) It can thus be inferred that the local increase of surface roughness of the cable model due to the presence of the helical fillet had an influence on the excitation mechanism.
For selected configurations, it was possible to compare the mean force coefficients for the model locked in a static position to the coefficients when the model was free to respond to wind excitation using the spring suspension system. In general, for cable rotation angles of -92, -90, and -88 degrees, the mean Cy proved to be similar between the stationary model case and the moving model case for the model with a helical fillet in smooth flow at 60 degrees inclination. However, locally, the four different rings did not show similar distributions of surface pressures for the two cases. Figure 46 and figure 47 show the mean surface pressure distribution at approximately 11.5 m/s for the cable rotated at -90 degrees and in a static position and for the cable in motion (dynamic). The pressure around the four rings was not evenly distributed and that more surface pressure taps would be required to accurately predict the mean forces acting on the entire cable length. For the static cable, the negative lobe of pressure due to the laminar separation bubbles was active over a larger surface of the cable, and the magnitude was larger than for the case when the cable was in motion.
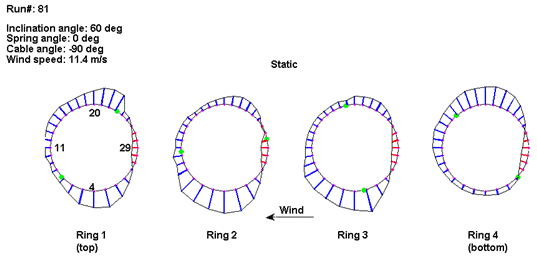 |
| Figure 46. Illustration. Distribution of surface pressure coefficient for the four rings with the cable in a static position (run 81). |
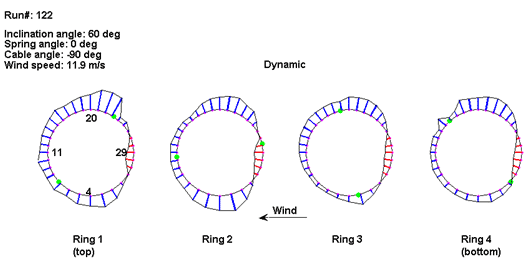 |
| Figure 47. Illustration. Distribution of surface pressure coefficient for the four rings with the cable in motion (run 122). |
Tests with the cable in a static position were also conducted to identify possible galloping using the Den Hartog criterion. Figure 48 shows the mean Cx and Cy calculated from the surface pressure distribution on the four rings as a function of wind angle for the cable in static position and as a function of wind speed for the cable in motion. A negative slope of Cy with cable rotation was depicted between -94 and -92 degrees. However, this slope was not large enough to satisfy the Den Hartog criterion.
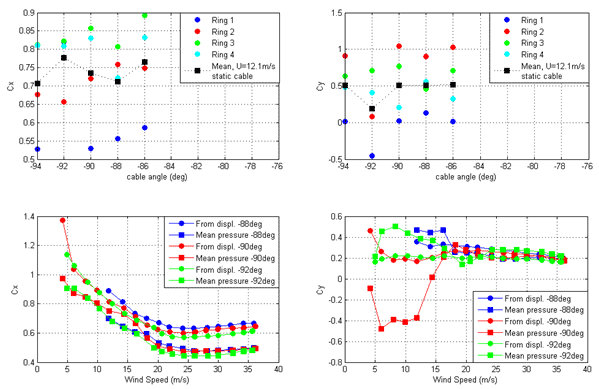 |
| Figure 48. Graph. Mean force coefficients as a function of cable rotation for the static cable and as a function of wind speed for cable in motion. |
Tests were conducted with the cable in a static position with the gap at the top of the cable open and sealed. The gap is necessary to allow the cable to move freely during dynamic test. The size of the opening was selected based on the amplitude of vibration expected. However, this opening has an impact on the flow around the cable near the roof of the test section. To evaluate the effect of this opening on the mean force coefficients as calculated from the surface pressure distributions, the gap was left opened and then sealed, as illustrated in figure 12 and figure 13. Results presented in figure 174 and figure 175 in appendix B indicate that Cx and Cy were not affected by the end conditions of the model, at least not for the region of the cable where the pressure rings were located.
It should be noted that the four rings of pressure taps are far (11 to 17 cable diameters) from the top of the cable where the opening is located. Therefore, the surface pressure distribution at those four locations might not have captured the difference in the flow field that is locally affected at the top of the cable. Adding rings of pressure taps along the main axis of the cable would have helped to better estimate the mean force coefficient acting on the entire cable length. The verification of the influence of the end conditions was carried out in smooth flow for the cable model without helical fillet at an inclination of 60 degrees corresponding to the test conditions of the 2001 and 2008 experiments. (See references 4–7.)
A TFI Cobra Probe was installed directly downwind of pressure ring 3 to look for any correlation between the surface pressure and the wake characteristics. The position of the TFI Cobra Probe in relation to the model is crucial to capture wake characteristics associated with flow phenomena of the separated shear layers. The appropriate position would be a function of Reynolds number, the trajectory of the motion, and the cable rotation. In light of all the possible ideal probe positions and time limitations, it was decided to set the probe at a fixed position during the entire test. The position was considered appropriate to capture the flow shed in the wake: wake of ring 3, on the tip of the probe 403 mm (2.5 cable diameters) behind the cable model, and 5 mm inboard of the model edge on the port side (south side). Figure 49 shows the TFI Cobra Probe as positioned relative to the model.
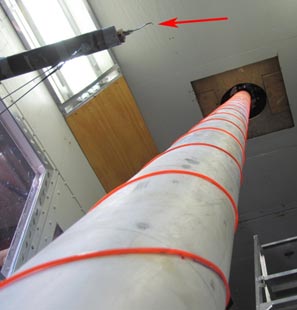 |
| Figure 49. Photo. TFI Cobra Probe placed in the wake of the cable model directly behind ring 3 of pressure taps. |
Spectral analysis of selected pressure ports located on the port side of the cable along with a spectral analysis of the signal captured by the probe in the wake have indicated that a relationship can be established for some cases. Figure 50 presents the spectrum of the longitudinal wind speed measured with the TFI Cobra Probe and the spectrum of pressure port 30 on ring 3 for a wind speed of approximately 24 m/s (run 178). These spectrums were obtained from a dynamic test featuring the model with a helical fillet in smooth flow. Both spectrums showed a peak of energy at about 1.5 and 2.1 Hz, corresponding to the frequencies of oscillation of the cable model. A detailed study of the relationships between unsteady pressure fluctuations, the cable motion, and fluctuations in the wake is beyond the scope of the present report.
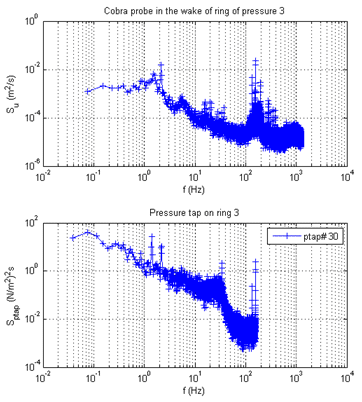 |
| Figure 50. Graph. Spectrum of the longitudinal flow velocity fluctuations located in the wake of the model and spectrum of the surface pressure signal of port 30 on ring 3 with a wind speed of 24 m/s. |
The mean Cy was calculated for each configuration of the cable using two methods. The first method is based on the overall mean displacement of the cable measured with the lasers, which was converted into the aerodynamic force necessary to obtain the measured mean displacement using the stiffness of the dynamic rig in the direction of the motion. The force was then divided by the mean dynamic pressure in the test section and by the diameter and length of the cable corresponding to the frontal area of the model. This method is identical to the method put in place by Andersen et al. and Andersen for analysis of the data from the 2001 and 2008 experiments.(6,7) The second method is based directly on the surface pressure measurements at four locations along the main axis of the cable with a total of 32 pressure ports for each of the four rings of taps. Integration of the mean surface pressure measurements provided the local aerodynamic forces perpendicular to the main axis of the cable and normalized by the dynamic pressure, the cable diameter and a cable length of 1 m to provide Cy and Cx. The force coefficients at the four locations along the main axis of the cable were then averaged to provide the mean Cy and Cx.
It could be argued that both techniques used to calculate the mean force coefficient for the entire cable are not fully representative of the mean aerodynamic forces. The first method assumes that the cable is moving only in one mode with one given frequency and that the mean force acts at mid-length of the cable with the wind speed being constant along the entire length of the cable. Observations of the cable motion have indicated that these assumptions were not fully true. The second method assumes that the pressure distributions at other locations along the main axis of the cable are similar to the pressure distribution obtained from the four measurement locations along the cable axis and that the mean wind speed is constant along the entire length of the cable. Given the measured deviations from the mean diameter reported earlier (See "General" section in chapter 4) and the presence of the helical fillet, it is clear that these assumptions are also not true. However, it is believed that a more representative prediction of mean aerodynamic force coefficients on the cable model could be given by the average of the force coefficients obtained from both sets of measurements. The results from surface pressure measurements have the tendency to underestimate the aerodynamic forces since the part related to friction is not considered, while the forces calculated from the measured overall displacements and the frequency of oscillations can represent an overestimation of the forces.
The force coefficients were calculated using both methods for each configuration of the cable model. It was assumed at first that a rotation of the cable along its main axis should not be a factor that affected the mean aerodynamic force coefficients. However, during the wind-tunnel tests, it was observed that the response of the cable for different cable rotations along its main axis differed greatly from angle to angle. Variations in terms of amplitude of motion of the cable, wind speed at which vibration occurred, and modes of vibration that were excited were observed for the different cable rotations tested. Variations of the mean force coefficients were also observed.
Figure 51 shows Cx and Cy calculated from measured displacements (top), from surface pressure measurements (center), and from the average of both methods (bottom) for the 17 different cable rotation angles tested for the cable inclined at 60 degrees in smooth flow and with the helical fillet. The red line on the bottom graphs represents a least-square fit of the mean force coefficient versus Reynolds number for the 17 configurations combined together. The red lines should be taken as the best representation of the cross-sectional force coefficients of the cable for the configuration mentioned previously. The same analysis was carried out and is presented in figure 52 through figure 55, where coefficients are calculated from mean displacement (top), integration of surface pressure (center), and mean of both methods (bottom).
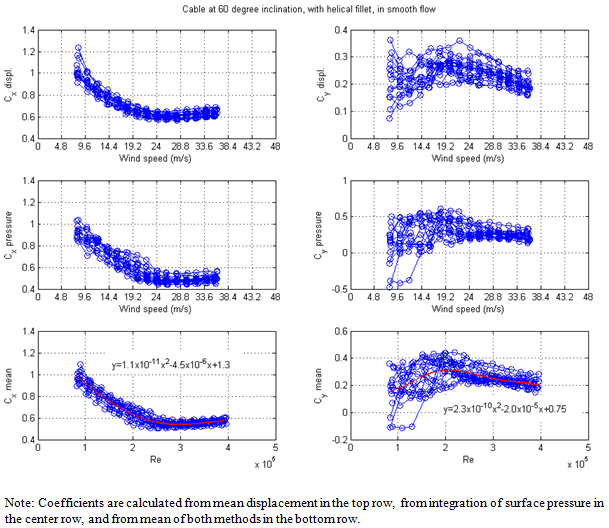 |
| Figure 51. Graph. Variations of Cx and Cy with wind speed for 17 cable rotations with cable inclined at 60 degrees in smooth flow and with the helical fillet. |
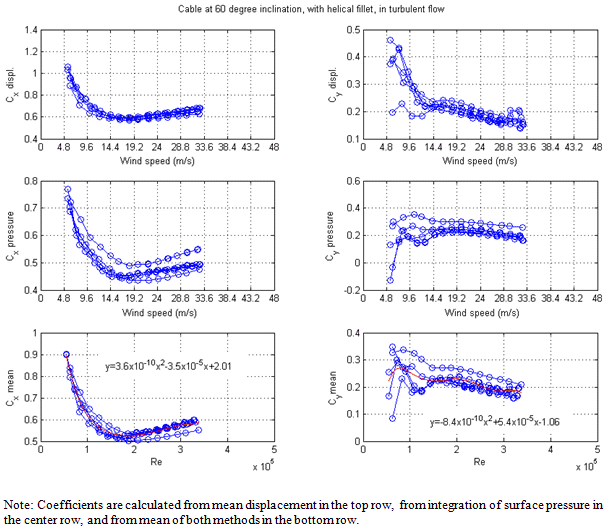 |
| Figure 52. Graph. Variations of Cx and Cy with wind speed for five cable rotations with cable inclined at 60 degrees in turbulent flow and with the helical fillet. |
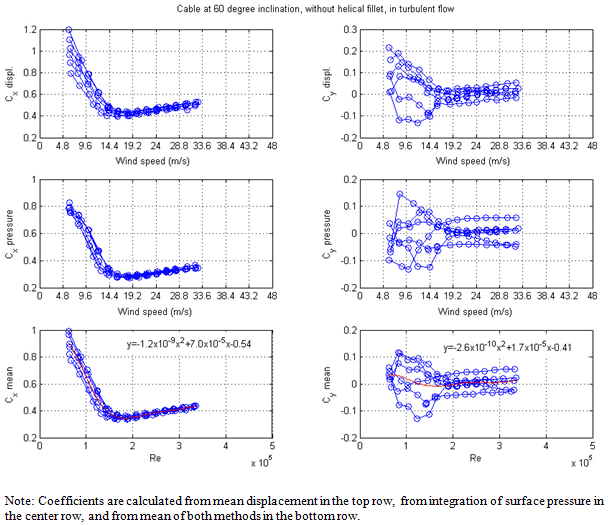 |
| Figure 53. Graph. Variations of Cx and Cy with wind speed for six cable rotations with cable inclined at 60 degrees in turbulent flow and without the helical fillet. |
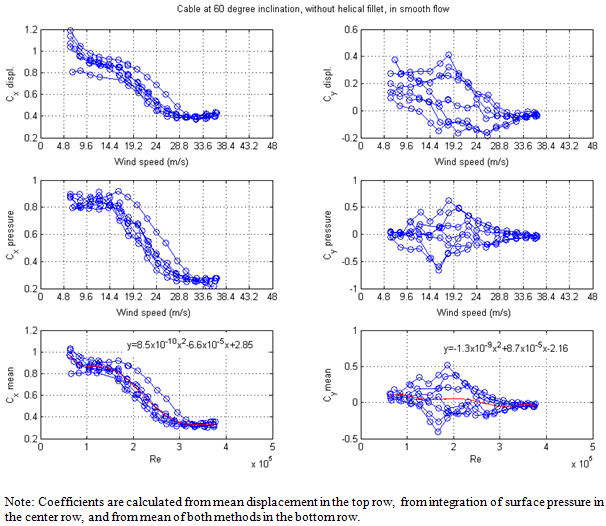 |
| Figure 54. Graph. Variations of Cx and Cy with wind speed for seven cable rotations with cable inclined at 60 degrees in smooth flow and without the helical fillet. |
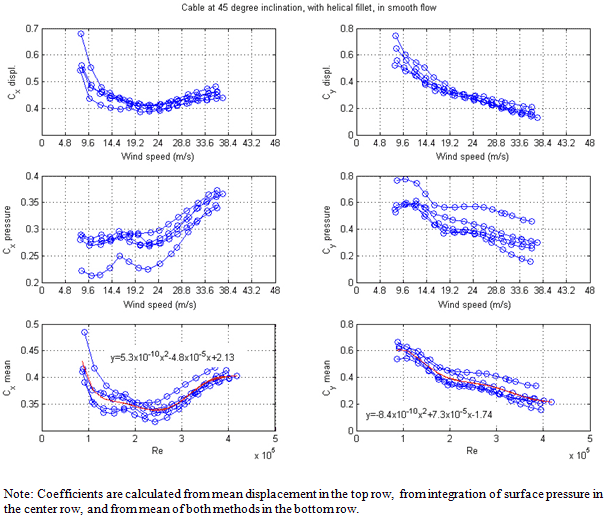 |
| Figure 55. Graph. Variations of Cx and Cy with wind speed for five cable rotations with cable inclined at 45 degrees in smooth flow and with the helical fillet. |
The test program included verifications of the degree of repeatability that could be achieved during the experimental investigation. Selected static and dynamic tests were systematically repeated for conditions as close as possible to the original conditions.
For the static tests, comparisons of the mean cross-sectional force coefficients for the four rings of pressure taps between two identical runs showed excellent repeatability. The differences between the curves of Cx and Cy with Reynolds number were found to be negligible for the cable in smooth flow with helical fillet. Note that each coefficient was based on the integration of 90-s time histories of 32 pressure taps composed of 28,000 points that were time averaged to obtain a single value.
For the dynamic tests, the following four factors had a significant influence on repeatability:
As illustrated in the "Influence of Structural Damping" section earlier in this chapter, the wind conditions outside the wind tunnel were a significant factor to consider when tests were repeated. On windy days, the turbulence of the flow in the test section increased, and low frequency modulation of the wind speed were observed. The wind tunnel operator had to be vigilant in setting up the mean wind speed, deviating in some cases with the standard procedure and the desired increments.
It was observed early in the test program that during long tests with large amplitude of vibration, elements of the dynamic rig had a tendency to loosen up, increasing the friction between moving parts and therefore the structural damping. These elements were identified and systematically verified afterwards to keep the structural damping to a constant level.
Given the dependency of the mean wind speed inside the test section to the outdoor conditions, the wind tunnel operator had to set the wind speed manually based on a live display of the wind velocity in the test section. Once the speed was set, data were collected for 90 s, and the operator increased the speed to the next desired wind speed and repeated the process for 16–17 increments. Care was taken never to reduce the wind speed if the desired wind speed was overshot. It was observed in some occasions that the model had a tendency to behave differently if the wind speed was increased rapidly or slowly. Given the important inertia of the model (407 kg) and the low frequency of oscillations (1.4 Hz), it is possible that oscillations present at low wind speed would carry to higher wind speeds. The excitation of the end-to-end modes in some instances complicated things as well. Therefore, the difficulty for the operator to adjust the mean wind speed in windy days could have combined with the increase of turbulence in the test section to affect the repeatability of the experiments.
In the 2001 and 2008 experiments, carried out in early spring, bugs (e.g., mosquitos, black flies, etc.) were found at several occasions on the windward surface of the model, significantly affecting the surface roughness. (See references 4–7.) The present investigation was carried out later in the spring than the previous experiments. As a result, bugs were observed only occasionally and were systematically removed from the surface of the model during model inspection.
When all four factors were controlled and the dynamic tests were repeated back to back, the variation of the model response with wind speed is repeatable. If a particular test that had large vibration amplitude needed to be repeated for further analysis, it was possible to reproduce the same amplitude of vibrations in the majority of the cases.
Figure 56 and figure 57 compare results of two sets of tests that were repeated. The first case involved static tests where mean force coefficients were compared (runs 81 and 94) and the second case involved dynamic tests where a run that was aborted midway was reran shortly after (runs 239 and 244). The agreement for both cases was excellent, as seen by the overlapping data in the figures.
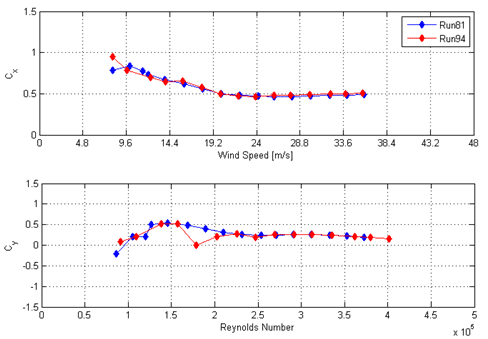 |
| Figure 56. Graph. Mean Cx and Cy calculated from the integration of surface pressure measurements for two runs with cable inclined at 60 degrees and rotated at -90 degrees in smooth flow and with helical fillet. |
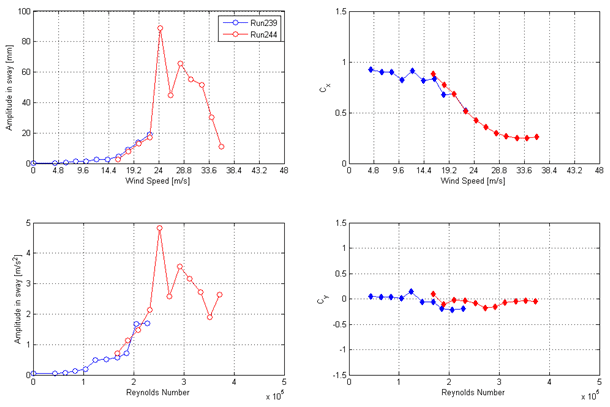 |
| Figure 57. Graph. Response of the cable for two consecutive runs for the cable inclined at 60 degrees and rotated at 2 degrees in smooth flow without the helical fillet. |
Figure 58 shows the results of four runs carried out for the exact same conditions without manipulation of the model. The first run was carried out rapidly with a sampling time of 10 s, the second run was carried out slowly with a sampling time of 90 s, the third run was done for only the low speed range up to 22 m/s, and the fourth run focused only on a peak in the amplitude around 22 m/s. The large peak observed in the first run had a lower amplitude during the second run. The peak was reproduced during the fourth run where the operator rapidly increased or decreased the wind speed to the desired value.
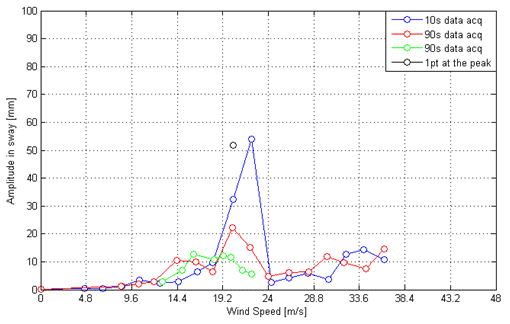 |
| Figure 58. Graph. Amplitude of motion in sway for four consecutive runs for the cable inclined at 60 degrees and rotated at -88 degrees without the helical fillet and in smooth flow. |
At the time of the initiation of this experimental investigation, the phenomenon referred to as dry-inclined cable galloping could be defined as follows: wind-induced vibrations of stay cables for wind speed ranging from 4 to 40 m/s in dry conditions; sustained vibrations, mostly sinusoidal, mostly across-wind; self-limited in amplitude or divergent; and sensitive to fluctuations of the mean wind speed. It is different than buffeting due to turbulence; galloping due to the impinging wake of another structural element; parametric excitation; and galloping due to ice-accretion or other surface contamination.
The mechanisms involved for dry-inclined cable galloping include the following:
These two instability mechanisms are intertwined for inclined stay cables. For example, the variations of the state of the boundary layer due to Reynolds number effects will affect the generation of the axial vortices, affecting the shedding frequency and the wind speed at which the vibration occurs. The vortex shedding and associated motion will affect the apparent wind speed and direction, defining the critical Reynolds number sub-regime experienced by the stay cable and affecting the cross-sectional force coefficients.
In light of the experiments carried out in the framework of this investigation, it can be concluded that the vibrations observed for the cable model with a helical fillet in smooth and turbulent flow generally matched the earlier definition of dry-inclined cable galloping with some exceptions. The vibrations were mostly sinusoidal, across-wind, self-limited in amplitude, influenced by slow fluctuations of the mean wind speed, and affected by the level of structural damping. Peaks at lower wind speeds were observed and disappeared with an increase of speed similar to a typical vortex shedding process or due to a change of Reynolds number sub-regime.
For the tests in smooth flow with the helical fillet for several cable angle rotations, the maximum amplitude occurred at the highest wind speed attainable in the wind tunnel—36 m/s. At this Reynolds number, the cable model had cross-sectional force coefficients varying slowly with wind speed in contrast to what would be expected from dry-inclined cable galloping. Tests were carried out to define if the Den Hartog criterion was met due to variations of the static coefficients with cable angle rotation. This was not the case even though a negative slope of the across-wind coefficients with cable rotation was depicted. It was not possible to verify if it was a high-reduced vortex shedding peak given that the maximum speed of the wind tunnel was reached.
Tests in turbulent flow for the same conditions have shown that the peak occurred at lower wind speed (i.e., at a lower Reynolds number) and that the vibrations switched to a higher frequency mode with end-to-end sway when wind speed was increased. It is possible that a similar behavior would have been observed in smooth flow if it had been possible to increase the wind speed past the observed peak.
For other cases, sinusoidal vibrations with constant amplitude were observed, and the amplitude increased when wind speed was increased. This was the case for a large number of wind speed increments corresponding to a range of 10 to 12 m/s. At higher speeds, the vibrations in the sway mode subsided, and vibrations in the end-to-end sway mode occurred. Given the large range of wind speeds covered, this behavior does not match 100 percent with the expected general behavior of dry-inclined cable galloping.
Nevertheless, the fact that stay cables operate in the critical Reynolds number regime with or without the helical fillet and in smooth or turbulent flow makes the description of the phenomenon more complex. In this regime, the boundary layers near the surface of the stay cable experience a transition from laminar to turbulent flow where separation and sometimes reattachment followed by separation occur. These processes are known to be unstable and can lead to unstable behavior. Boundary layer transition from laminar to turbulent at the surface of a circular cylinder is an instability phenomenon that is sensitive to components such as the micro-structure of the surface, geometric asymmetry, flow turbulence, noise, and small motion. It amplifies the effects of these external factors. A deviation of 1 percent of the mean diameter that normally might have been negligible in different conditions becomes a dominating factor in the critical Reynolds number regime. Adding this to the complexity of the aerodynamics of circular cylinders inclined to the flow has proved to be a challenging instability problem to describe and control.