U.S. Department of Transportation
Federal Highway Administration
1200 New Jersey Avenue, SE
Washington, DC 20590
202-366-4000
Federal Highway Administration Research and Technology
Coordinating, Developing, and Delivering Highway Transportation Innovations
| REPORT |
| This report is an archived publication and may contain dated technical, contact, and link information |
|
| Publication Number: FHWA-HRT-14-070 Date: September 2014 |
Publication Number: FHWA-HRT-14-070 Date: September 2014 |
The experiments were carried out in two distinct phases. The focus of the first phase was to identify any potential divergent vibrations for the cable model with a helical fillet at an inclination of 60 degrees for various rotations of the model on its longitudinal axis and spring rotations. In the event that vibrations would be identified in the first phase, the focus of the second phase would be to define the level of structural damping necessary to mitigate the vibrations and to define the effect of adding turbulence to the oncoming flow on the vibrations. In addition, tests in the second phase were to be carried out to look for other divergent vibrations at other inclination angles and spring rotations with the helical fillet in place.
The exploratory nature of the experiments resulted in the original test program evolving over time. The findings of the day were used to define the tests for the next day as well as for the entire duration of the investigation. The original main objective, which was to define the aerodynamics of the cable model fitted with a helical fillet as a function of wind speed and model attitude to the flow, was reached. Tests were added to link the present study with the two previous studies at NRC-IAR on a smooth cable in 2001 and 2008. (See references 4–7.) For this, the helical fillet was removed for the last 4 days of the investigation, and tests on the smooth model in smooth and turbulent flow at 60 degrees were carried out.
Two inclination angles were investigated, 60 and 45 degrees. The former was selected as the prime inclination to study since it was identified in previous experiments as having aerodynamic characteristics in the critical Reynolds number range most likely to lead to instability for a smooth stay cable. The latter was selected since the flow on one side of the model is fully perpendicular to the helical fillet. A large asymmetry in the pressure field was thus anticipated, resulting in a steady across-wind force that could possibly vary within the critical regime.
The test program is outlined in table 4, and a detailed run log is presented in appendix A.
Table 4. Summary of test program for phases I and II.
| Day | Run | Inclination (degree) |
Spring Rotation (degree) | Cable Rotation (degree) | Case | Comments |
| Phase I | ||||||
| 1 | 27, 28 | 60 | 0 | 0 | Dynamic | Increasing and decreasing wind speed |
| 2 | 32, 35, 37 | 60 | 0 | 0, 0, 27.7 | Static | Increasing and decreasing wind speed |
| 3 | 39, 41 | 60 | 0 | -13.8, 13.8 | Static | |
| 44, 46 | 60 | 0 | -13.8 | Dynamic | 46 is a repeat of 44 | |
| 4 | 49, 52 | 60 | 0 | -30, -40 | Dynamic | |
| 56, 60 | 60 | 0 | -50, -60 | Dynamic | ||
| 5 | 63, 66, 67 | 60 | 0 | -75, -90, -90 | Dynamic | 67 has decreasing wind speed |
| 69, 71 | 60 | 0 | 5, 65 | Dynamic | ||
| 6 | 73, 75 | 60 | 0 | 50, -90 | Dynamic | 75 is a repeat of 66 |
| 81, 85 | 60 | 0 | -90, -86 | Static | ||
| 7 | 88, 90 | 60 | 0 | -88, -92 | Static | |
| 92, 94 | 60 | 0 | -94, -90 | Static | 94 is a repeat of 81 | |
8 |
108 | 60 | 0 | -90 | Dynamic | Medium damping |
| 118, 122, 123 | 60 | 0 | -90 | Dynamic | High and low damping | |
| 123 | 60 | 0 | -90 | Dynamic | Decreasing wind speed | |
| Phase II | ||||||
| 10 | 125, 131 | 60 | 0, -54.7 | -88, -90 | Dynamic | |
| 12 | 136 | 60 | 0 | -90 | Dynamic | |
| 13 | 137, 140 | 45 | 0 | 0, 90 | Dynamic | |
| 142, 144 | 45 | 0 | 27, -25 | Dynamic | ||
| 15 | 149, 152 | 45 | -54.7 | -25, 0 | Dynamic | |
| 155 | 45 | -45 | -25 | Dynamic | ||
| 16 | 159 | 45 | -12.5 | -25 | Dynamic | |
| 18 | 163 | 60 | -12.5 | -90 | Dynamic | Windy |
| 22 | 167 | 60 | -12.5 | -90 | Dynamic | 167 is repeat of 163 |
| 23 | 176, 178 | 60 | 0 | -92, -90 | Dynamic | |
| 27 | 197, 199 | 60 | 0 | -90, -92 | Dynamic | Turbulent flow |
| 28 | 203, 205, 208 | 60 | 0 | -88, 0, 50 | Dynamic | Turbulent flow |
| 30 | 211, 214 | 60 | 0 | 50, 0 | Dynamic | Turbulent, no helical fillet |
| 31 | 216, 219, 222 | 60 | 0 | -90, -88, -92 | Dynamic | Turbulent, no helical fillet |
| 225, 226 | 60 | 0 | -54.7 | Dynamic | Turbulent, no helical fillet | |
| 32 | 230, 233 | 60 | 0 | -57.7, 0 | Dynamic | Smooth, no helical fillet |
| 237, 239 | 60 | 0 | -2, 2 | Dynamic | Smooth, no helical fillet | |
33 |
244 | 60 | 0 | 2 | Dynamic | Smooth, no helical fillet |
| 248, 250 | 60 | 0 | -93 | Static | Top gap open and sealed | |
| 253, 255 | 60 | 0 | -93, -90 | Dynamic | Smooth, no helical fillet | |
| 257, 260 | 60 | 0 | -88 | Dynamic | 10-90 s sampling | |
| 262, 263 | 60 | 0 | -88 | Dynamic | 12-22 m/s, ramp up | |
The spring rotation angles were selected to represent common field conditions based on the relationships defined in 2001.(9) The model inclination (φ) and spring rotation (ɑ) relate to stay cable inclination (θ) and the flow yaw angle (β) through the following equations:
| Figure 21. Equation. Model inclination. |
| Figure 22. Equation. Spring rotation. |
Using these relationships, a model inclination angle of 60 degree and a spring rotation of -54.7 degrees correspond to a stay cable inclination of 45 degrees and yaw angle of 45 degrees. Table 5 presents the relationships for the other cases where a rotation of the spring plane was carried out during the tests. A negative sign for the spring and cable rotation was related with a clockwise rotation when looking down along the cable axis.
Table 5. Relationship between model wind-angle planes and field conditions.
| Run | Model Experiments | Field Conditions | ||
| Inclination φ (degree) |
Spring Rotation ɑ (degree) |
Inclination θ (degree) |
Yaw β (degree) |
|
| 131 | 60 | -54.7 | 45 | 45 |
| 149, 152 | 45 | -54.7 | 30 | 35 |
| 155 | 45 | -45 | 35 | 30 |
| 159 | 45 | -12.5 | 44 | 8 |
| 163, 167 | 60 | -12.5 | 59 | 11 |
All electronic equipment used for the tests was specifically calibrated for this project or verified by the expert technical staff in conformity with NRC-IAR’s quality assurance procedures which are compliant with ISO 9001-2008.
The dynamic pressure in the test section was obtained from two independent pressure measurements using two differential pressure transducers. Two parallel measurements were made for redundancy. The temperature of the flow in the settling chamber and the barometric pressure at the inlet of the test section were also recorded for each run. As described in the section on smooth flow in chapter 2, a test section calibration was carried out to relate the recorded flow characteristics to the wind speed at the model location in the center of the test section.
The sway and heave motion at the extremities of the cable model were measured with laser displacement transducers. Four transducers were used, one pair per each end of the model. The laser sensing heads were placed approximately 250 mm away from the targets fastened to the spring restraining rods. The distance between the sway sensors was 7,116 mm, and the distance between the heave sensors was 7,285 mm. Four accelerometers were also used in parallel with the displacement transducers to provide a redundant monitoring of the motion. The heave and sway motion were calculated by directly averaging the two time histories of displacements per mode. The end-to-end motion in both directions was calculated by subtracting the time histories of the displacement signals at the extremity of the models.
All analogue outputs from the laser transducers and accelerometers were low-pass filtered prior to being sampled simultaneously at frequencies of 500 or 2,500 Hz with a National Instruments® VXI 1629 data acquisition system and LabVIEW®; custom-made software. The sampling time was typically 90 s and was increased to 300 s for the damping tests.
Two TFI Cobra Probes were used for the tests in smooth flow to monitor the flow fluctuations. A sampling frequency of 2,500 Hz was used when the signal from the TFI Cobra Probes were recorded and 500 Hz when the probes were not in use. Each probe monitored three components of the flow fluctuations: longitudinal, lateral, and vertical. Both probes had sturdy probe holders cantilevered from the south wall of the test section. One probe was installed at the inlet plane of the test section to monitor the fluctuations of the oncoming flow. The second probe was installed behind the model at the center of the test section to monitor the flow fluctuations in the wake at the same height as the ring 3 pressure sensors. The tip of the probe in the model wake was located 403 mm behind the cable model and 5 mm inboard of the model edge on the port side. The probes had an acceptable frequency response in excess of 1,500 Hz and were capable of capturing low- and high-frequency fluctuations of the flow.
As was done for the 2008 experiments, the cable model was instrumented with 160 pressure taps. The pressure taps were arranged in 4 cross-sectional rings of 32 taps and 2 longitudinal lines of 16 taps as shown in figure 23.(6,7) Four electronic pressure scanners (Scanivalve Inc.® ZOC 33 and ZOC 23b) were embedded directly in the model to keep the length of the pneumatic tubing to a minimum. Lengths of tubing of 1.2 m were used systematically for all taps. The frequency response of each pressure tap and tubing system was measured prior to the 2008 experiments and was reused for this study to correct for the distortion of the pressure signals due to the tubing. A detailed description of the pressure measurements of the 2008 experiments is given in Andersen et al., Andersen, Nikitas et al., and Jakobsen et al. (See references 6, 7, 10, and 11.)
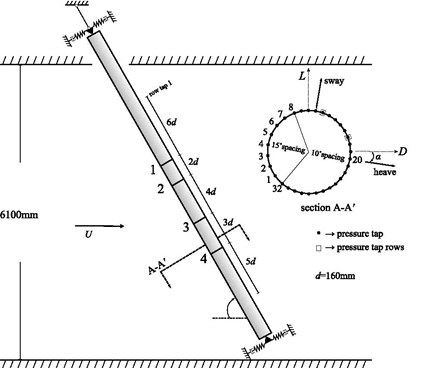 |
d = Nominal cable diameter of 160 mm. |
| Figure 23. Illustration. Sketch of the pressure tap arrangement. |
The pressure signals from the scanners were monitored using a Scanivalve Inc.® RAD system and a dedicated data acquisition system independent of the National Instruments® VXI 1629 system described previously. The pressure signals were sampled at a rate of 312.5 Hz for 90 s. The analog signals from the laser displacement transducers and the accelerometers were also monitored by the surface pressure data acquisition system to provide synchronous recordings of pressure field fluctuations and corresponding motion of the cable model. In addition, a square wave analog signal was monitored by both the National Instruments® VXI 1629 and the surface pressure data acquisition system to allow a precise synchronization of both systems. This way, the fluctuations of the flow in the wake of the model captured with the TFI Cobra Probe could be associated with the pressure fluctuations at the surface of the cable model.
Two types of experiments were carried out during this study: dynamic and static tests. Prior to any testing, a thorough inspection of the cable model was carried out to ensure that dirt, small bugs, or small leaves had not been left on the model from the previous test series. If any were found, the model was systematically cleaned. Inspection of the helical fillet was also carried out to ensure that it remained affixed to the model surface during the experiments. The fillet had a tendency to lift from the surface during cold weather conditions. Figure 24 shows a typical model inspection.
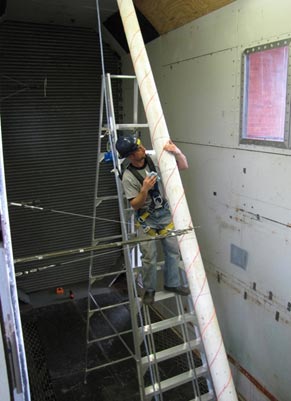 |
| Figure 24. Photo. Model inspection in the test section. |
For the dynamic tests, a wind-off value of all transducer signals was first recorded with the doors of the wind tunnel test section closed. With the doors open, flow is generally present in the test section given the open circuit of the wind tunnel. Subsequently, the wind speed was increased to a desired value displayed continuously from the data acquisition system, and the model displacements and acceleration were graphically displayed on a screen in the control room. Once a steady state wind speed and model response were reached, the operator started the data acquisition process. Once the 90-s data acquisition was completed, the wind tunnel operator increased the wind speed to the next set point. Small increments of wind speed were used, generally 1 or 2 m/s depending on the observed behavior of the cable model. The wind speed sweeps generally covered the entire range of wind speed possible in the facility, from 4 to 36 m/s in 16 to 18 points. Unless otherwise specified, the wind speed sweeps were carried out with positive increments of wind velocity.
In the event that the wind tunnel operator observed a growth of the vibration after 90 s of data acquisition, a second recording was initiated at the same wind speed. For selected cases at high wind speeds, the motion of the model was manually stopped and released to identify the rate of growth of the oscillations. For some of the same cases, the model was excited manually to a high amplitude, and the decay or growth of the vibrations was monitored for 90 s.
The growth of the motion was first captured by manually preventing the cable model to move, starting the acquisition of the data, and finally letting the model move freely. The decay traces were captured by first manually imposing cable motion with large amplitude in the first sway mode, starting the data acquisition, and finally letting the model move freely. In both cases, traces of the displacement of the cable with time could be analyzed, and aerodynamic damping characteristics could be extracted.
An example of a trace measured for the sway mode for the cable with the helical fillet inclined at 60 degrees and rotated at -88 degrees is presented in figure 25. It only took a few seconds for the cable to start building energy and to vibrate with high amplitude even if the effective sprung mass was as high as 407 kg, and the oscillation frequency was 1.4 Hz. It has been reported that for previous tests done with the same cable model in 2001 and 2008, the aerodynamic response of the cable took much longer to build up. (See references 4–7.) In this present case, the cable was prompt to respond, inferring strong negative aerodynamic damping. The presence of the helical fillet, the wind speed at which the motion took place and the frequency ratio of 1.0 between the sway and heave modes could have had a role to play with this observation.
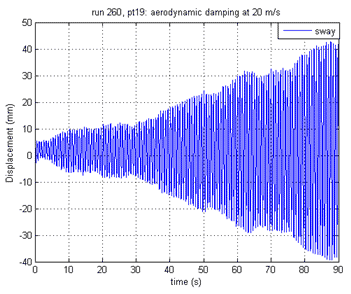 |
| Figure 25. Graph. Growth of the cable model vibration as a function of time inclined at 60 degrees and rotated at -88 degrees. |
Another example of an increase of vibrations is shown in figure 26. It corresponds to vibrations in the sway mode for the cable with helical fillet inclined at 60 degrees and rotated at -90 degrees with no spring plane rotation. In this case, the growth of the vibration in the sway end-to-end mode was rapid and appeared to dominate the motion.
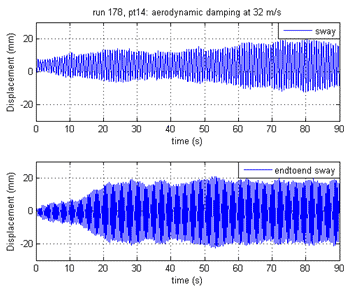 |
| Figure 26. Graph. Growth of the cable model vibration as a function of time inclined at 60 degrees and rotated at -90 degrees. |
Each dynamic test took between 1.5 and 2 h. Prior of the dynamic tests, the structural damping of the suspension rig was established through 300-s decay tests in still air. The structural damping of the cable model and suspension system was evaluated in situ by analysis of decay traces. The model was manually excited at its natural frequency in each mode. When the desired amplitude was reached, the model was released to obtain a smooth decay trace using optical displacement transducers at the model extremities. Piece-wise linear fit of the Hilbert transform of the decay signal in blocks of 10 s produced the amplitude of vibration versus damping curve as presented in figure 27.
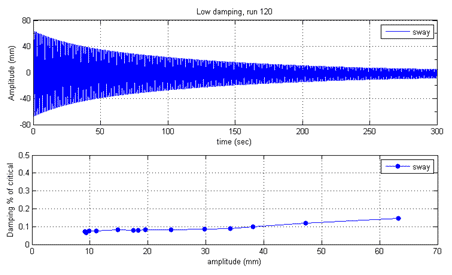 |
| Figure 27. Graph. Example of decay trace for the sway mode of vibration and corresponding variation of damping with amplitude of vibrations. |
For the static tests, steel locking pins were inserted at the extremities of the cable model to restrain oscillations. A tare of the surface pressure transducers was carried out with the doors of the test section closed. The wind speed was then increased to a desired value. Once a steady state wind speed was reached, the operator started the data acquisition process. The tests were repeated for 13 to 15 mean wind speeds.
The test program included several rotations of the cable model on its longitudinal axis (see table 4). The following procedures were used to adjust the angle to a prescribed value as illustrated by figure 28:
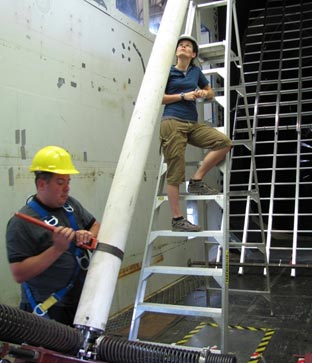 |
| Figure 28. Photo. Procedures followed to set the azimuth angle of the cable model. |
Preliminary data reduction was performed at the end of each run using a dedicated MATLAB® program as follows:
Post processing of the data using MATLAB® was carried out. The following additional data reduction was carried out: